Transcription
FHLB Des Moines and Darling Consulting GroupCurrent Issues in Liquidity ManagementThursday, August 8th 3:00 PM CTExamine key business issues and trends to help defend your liquidity position,understand key requirements of a comprehensive liquidity management system andlearn why your management strategy and philosophy are crucial.Wholesale Funding: Perception Versus RealityThursday, August 15th 3:00 PM CTIn today's economy, consider how wholesale funding can support your earningschallenges and develop a meaningful and cost-effective funding game plan to supportthe growth of your ces/2019-funding-products-webinar-series
2019 LEADERSHIP SUMMITOCTOBER 16-18, 2019JW MARRIOTT MALL OF AMERICA MINNEAPOLIS,MNRegister Now: www.fhlbdm.com/leadership-summit
Risk Management Strategy & Solutions Wholesale Funding Perception vs. RealityWhy NOW is the Best Time to Formulate a Winning Game Plan!August 15, 2019Frank L. Farone, Managing Directorffarone@darlingconsulting.com 2019 Darling Consulting Group, Inc. 260 Merrimac Street Newburyport, MA 01950 Tel: 978.463.0400 DarlingConsulting.comPage 3
Mirror, Mirror On the Wall, What’s the Fairest Funding of All?7 Common Reasons NOT to Use Wholesale FundingWholesale funding is too costlyDeposits reflect customer relationships, borrowings do not3. Wholesale funding does not increase value of franchise or attainmission of a community institution4. Lack of spread (hint: best opportunities when spread tightest)5. Negative regulatory attitude (perpetuates board/Mgm’t negativity)6. No need for funds, flush with cash!7. Not set up to borrow! (Really?!)1.2. 2019 Darling Consulting Group, Inc.Page 4
2019 Darling Consulting Group, Inc.Page 5
Current Rate EnvironmentBond Market is Screaming for More Rate Cuts“DoubleWhammy” 2019 Darling Consulting Group, Inc.Page 6
The Journey: Challenges of a Flat/Inverted CurveYOUR Strategies Throughout Journey?Asset YieldsFunding Costs 2019 Darling Consulting Group, Inc.Page 7
Fed Funds & 10 year Treasury: Note Timing and Patterns 2019 Darling Consulting Group, Inc.Page 8
Current Environment: 2/10 SpreadCurve Flattening Continues With Short-Term Inversion (Previous Page Journey of Rate Moves)CurveFlatteningcontinues 2019 Darling Consulting Group, Inc.Page 9
Curve Inversion FAST Approaching!?“Is This Time Different”?“No reason for great concern”John Snow (Treasury Secretary) – January 2006“I would not interpret the currently very flat yield curve asindicating a significant economic slowdown to come”Ben Bernanke – March 2006“I don’t think I’m concerned with it (flat yield curve).Bill Gross – January 2007 2019 Darling Consulting Group, Inc.First 9Apr-00Jan-0610 YR TSY - 1 YR TSYRecession Start Lead 110Jul-9017Mar-0111Dec-0723Page 10
Steep Curve in October 2018 (Expecting 3 Hikes):Think Opposite? BUY LONG ASSETS! 2019 Darling Consulting Group, Inc.Page 11
2019 Growth Forecast for Bank (8.00% growth assumed): Life is Good!Consider Leverage of 50% of Growth With INVESTMENTS? (Next Page) 2019 Darling Consulting Group, Inc.Page 12
BUY JUMBO MBS 4.05%; Fund Short @3.15% Spread Too Thin?3-4 Fed Hikes Ahead Let’s Wait to Buy Think Opposite! 2019 Darling Consulting Group, Inc.Page 13
GNMA JUMBO MBS 95 13/32 (No Credit Risk) 2019 Darling Consulting Group, Inc.Page 14
Fed Funds Futures Then and Now!Just 7 Months Ago 2019 Darling Consulting Group, Inc.Page 15
Fed Funds Futures “Forward” Rate@ 1.50% by June 2020!?How Reliable is This Forecast? 2019 Darling Consulting Group, Inc.Page 16
Treasury Curve From the Beginning of the Year 2019Expect Fed Cuts and Steeper Curve AheadLong Rates Down 60bp,Short Rates Lower, Too! Consider Impact on LoanYields? What About CD Pricing? 2019 Darling Consulting Group, Inc.INVERT CD CurveNOW!Page 17
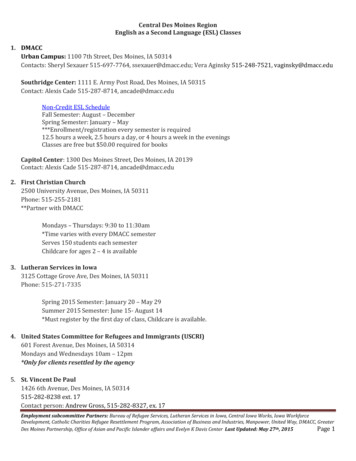
NII Graph: Quarter to Quarter Ramps CompareBASE SIMULATION AS OF 3/31/2019BASE SIMULATION AS OF 6/30/2019Net Interes t Incom e ( 000)Net Interes t Incom e ( 000)84,55084,5 5075,42575,4 2566,30066,3 0057,17557,1 7548,05048,0 5038,92538,9 Up 200BPDown 200BPBaseQ1Q2Q3Q1Q2Q3Q4Q1Q2Q3Q4Down 200BPBaseUp 200BPYear-1 NII246,790257,747257,261262,588Year-2 NII223,544258,582269,117246,671272,287Year-3 4 5 NII197,639256,645305,354BaseUp 200BPYear-1 NII245,202254,187253,145Year-2 NII220,405251,272Year-3 NII205,750Year-4 NIIYear-5 NIIKey Issue: Investment and All Loan ReplacementRates Are Lower This Quarter. Down 25 to 35bp just over the quarter. This is a result of intermediate and longterm market rates declining. Has pressured NII lower over the longterm.Q1Q2Q3Q4Up 200BPNII SUMMARYNII SUMMARYDown 200BP 2019 Darling Consulting Group, Inc.Q4Down 200BPBaseCHANGE / DIFFERENCE IN RESULTSDown 200BPBaseUp 200BPYear-1 NII-1,588-3,560-4,116Year-2 NII-3,139-7,310-6,529Year-3 NII-3,077-9,538-7,583Year-4 NII-3,771-11,964-9,076Year-5 NII-5,453-15,479-13,261Page 18
So, What If the Fed Truly IS Done?Even After Fed Is Done Raising Rates,Deposit Pricing Pressures Continue!How Can FHLB Advances Help? 2019 Darling Consulting Group, Inc.Page 19
/- 200bps Parallel and Non-Parallel (12 months)125BP ofSteepening Between2Y and 10Y Points(Exposure to FallingRates Is Reduced) 2019 Darling Consulting Group, Inc.Page 20
Time Deposit Maturities 2019 Darling Consulting Group, Inc.Pricing Relief ? Drop 8 Month CD to 2.00%Page 21
Lower 8 Month CD Special to 2.00%(“Fed Cut 25BPS” July & 10 Year Treasury Rate 1.64%) 2019 Darling Consulting Group, Inc.Page 22
Industry Margin DecliningMost Community Institutions are NetInterest Income Dependent 80-90% of NOINII Is a Function of Balance Sheet Sizeand SpreadWhich Means .Growth Is Necessary for Success!To Grow, We Need Funding!!! 2019 Darling Consulting Group, Inc.Page 23
More GROWTH NEEDED As Margins ShrinkROAX Increase margin LEVERAGE ROE (NI/Capital) Growth Asset Yields Cost of FundsFee IncomeExpense ControlAsset Sales (Gains? How Replace ?)Tax Management LocalExpansionAcquisitionCapital MarketsCost of Funds Management Is “Key” Now 2019 Darling Consulting Group, Inc.Page 24
Liquidity “Tightening”Commentary in the Field “The declining liquid asset cushions and increased use ofpotentially non-stable liquidity sources suggest that smallbanks as a group are increasing their liquidity risk profiles ”– FDIC Supervisory Insights, Summer 2017How Will You Respond?Remember the Basic Surplus Approach? 2019 Darling Consulting Group, Inc.Page 25
Liquidity Funds Management ProcessPlan needs to include:Strong liquidity management,plus proactive deposit strategiesBASED ON YOUR POSITION,are critical!Educate and Execute. 2019 Darling Consulting Group, Inc.Page 26
Basic Surplus 2019 Darling Consulting Group, Inc.Page 27
Case Study: What Strategies Would YOU Recommend?May 2019 ALCO meeting Asset sensitive Plentiful liquidity (access to 45% liquidity) NO wholesale funding (never the way always been here) Short investment portfolio (18 month average duration) Capital 8.05% (policy 8.00%.capital management critical) 2019 Darling Consulting Group, Inc.Page 28
Parallel Rate Ramps & Steepening of Market Yield Curves9BASE SIMULATION -ALTERNATIVE SCENARIOSKey Points:Net Interest Income ( 000)31,925 Asset sensitive and ultimately very well positioned forhigher interest rates27,475 Amount of overall rising rate benefit will depend on (1)pace of rate hikes and (2) shape of market yield curvesYear 2and “when” rates rise don’thold breath!23,02518,575Year 3 Falling rates proves to be the most problematicscenario for NIIYear 414,125Q3Q4Q1Q2Q3Q49,675Q1Q2BaseUp 200BPQ3Q4Q1Q2Q3Q4Steep Down 200BPQ1Q2Q3Q4Down 200BPQ1Q2Q3Q4Q1Up 200BPQ2Q3Q4Yield Curve Twist5 Deposit stability andYearpricingsensitivity remainimportant “unknowns”; Revisit MCOF wholesaleNII SUMMARYUp 200BPSteep Down 200BPDown 200BPBaseUp 200BPYield Curve Twist91,232Year-1 NII80,23279,13583,57991,23284,900101,219Year-2 NII72,59766,34984,731101,21994,252105,136Year-3 NII71,29960,61885,453105,136101,778108,445Year-4 NII70,55557,09386,177108,445105,675112,207Year-5 NII70,02454,56887,241112,207109,862 2019 Darling Consulting Group, Inc.Slope Matters A LOT!!Page 29
Case Study: Deposit Rates & Funding AlternativesWhere Do We Want to Position Our Funding? At What Cost?CREDIT UNION DEPOSIT RATESNon-Maturity Deposit ProductsPrimary SavingsOwners Choice SavingsPreferred SavingsPreferred SavingsPreferred Plus SavingsPreferred Plus SavingsTime DepositsRate (APY)0.30%0.30%0.30% Low Tier0.85% High Tier0.30% Low Tier2.02% High TierTime Deposits Specials / PromotionsRate (APY)0.90%0.90%1.41%1.76%2.63%2.78%2.73%2.78%3 Month6 Month9 Month12 Month24 Month36 Month48 Month60 MonthRate (APY) Consider 7 month CD @2.25%!11 month 2.30%2-3 year 1.75%4&5 year 1.80%COMPARATIVE WHOLESALE FUNDING RATES AS OF 4/30/2019TreasuryRatesTerm3 Month6 Month9 Month12 Month24 Month36 Month48 Month60 MonthFHLB AdvanceNew .68%N/A2.68%2.59%2.58%2.59%2.65%Brokered CDRatesvs. .45%2.45%2.45%2.55%2.65%2.75%2.85%LIBOR SwapRatesvs. .62%2.67%2.72%2.38%2.32%2.31%2.32%Money Market Fund (SEC Reported Average) @ 2.49%CHANGE IN RATE CURVES (SINCE LAST REVIEW)Changes in Rates (Since Last Review)153 Month6 Month9 Month12 Month24 Month36 Month48 Month60 MonthFHLB RatesBrokered CD 0.20%-0.15%-0.10%10Change (bps)Credit Union CD RatesTerm50(5)(10)(15)(20)3 Month6 Month9 MonthCredit Union CD Rates 2019 Darling Consulting Group, Inc.12 Month24 MonthFHLB Rates36 Month48 MonthBrokered CD RatesPage 30
Case Study Cont’d: CD Maturities:Incent Shorter With Pricing, NO Long CDs 2019 Darling Consulting Group, Inc.Page 31
Liquidity ForecastLoan and Deposit Growth Forecast? Game Plan for Excess Deposits?LIQUIDITY FORECAST @ 90-DAY HORIZONCurrent Basic Surplus w/ 45894,614Less: Net New Loan FundingsPlus: Net Customer Deposit FlowsPlus: Non-Pledgable Investment Cash flowEquals: Projected Basic Surplus (Deficit) at riance4,42112,331016,752Liquidity projections to be discussed at ALCO.24-MONTH WHOLESALE CASH FLOW PROJECTIONSQ1Y1Q2Y1Q3Y1Q4Y1Q1Y2Q2Y2Q3Y2Q4Y2Cash InvestmentsInvestmentsTotal Inv. Cash 9056656605035030540540Brokered DepositsNational CDsBorrowingsTotal Funding ,24974700747007,5007,500Could Pay Down FHLB and/or Brokered CDs, But Discuss Opportunity Cost Today. 2019 Darling Consulting Group, Inc.Page 32
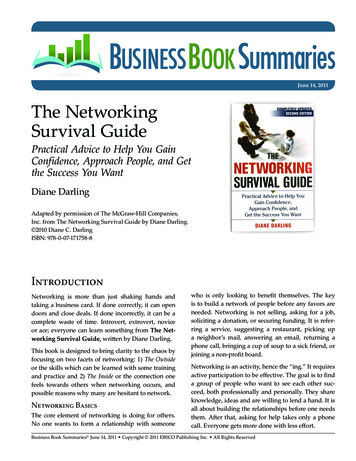
Earnings Impact From purchasing 30 Year Jumbo MBSFunded With 1 Year Wholesale FundingBase Simulation as of 5/31/2019Earnings Impact of Maintaining FHLB and MBSNet Interest Income ( 000)Net Interest Income ( 7,8757,8756,400Q1Q2Q3Q4BaseQ1Q2Q3Steep Down 200BPQ4Q1Q2Q3Q4Down 200BPQ1Q2Q3Q4Q1Q2Down 100BPQ3Q46,400Q1Up 200BPQ2Q3Q4BaseQ1Q2Q3Q4Q1Steep Down 200BPNII SUMMARYSteep Down 200BPQ2Q3Q4Down 200BPQ1Q2Q3Q4Down 100BPQ1Q2Q3Q4Up 200BPNII SUMMARYDown 200BPDown 100BPBaseUp 200BPSteep Down 200BPDown 200BPDown 100BPBaseUp 200BPYear-1 NII41,03340,01540,37940,57139,621Year-1 NII41,73540,66141,00441,17640,266Year-2 NII44,22838,02740,53142,11541,493Year-2 NII45,90239,84741,77042,70841,008Year-3 NII45,37134,52639,21842,71045,226Year-3 NII47,05736,22540,36843,27444,919Year-4 NII45,58632,22038,03442,85347,817Year-4 NII47,24533,75239,07243,40447,734Year-5 NII45,68230,91437,30642,92949,499Year-5 NII47,31832,31738,25643,47449,579CHANGE / DIFFERENCE IN RESULTSSteep Down 200BPDown 200BPDown 100BPBaseYear-1 NII702646624605Up 200BP645Year-2 NII1,6741,8201,239593-485Year-3 NII1,6861,6991,150564-307Year-4 NII1,6591,5321,038552-84Year-5 NII1,6361,40395054581Quantifies the impact of maintaining 73MM of 1 year FHLB borrowings @ 2.16% to support 30yr MBS @ 3.10%. 2019 Darling Consulting Group, Inc.Page 33
Rising Rates Still A Concern? Think Opposite!Don’t Become So Fixated on Rising Rates That You ForgetGreatest Risk to FIs Declining Rates 2019 Darling Consulting Group, Inc.Page 34
Strategy ConsiderationsLiability Sensitive IRR ProfileConsiderations: Balancing exposure to both rising and falling rates If extending: How far? How much of protection? Cost of insurance to rising? Free todayw/inversion Understand most effective options Should be able to extend assets Deposit strategy: New money (MCOF issue) Keep funding “short” or go longer? Swap? Mismatched leverage or growth Swaps/Caps (Last of layer approach) 2019 Darling Consulting Group, Inc.Page 35
Don’t Follow the Village Fool! 2019 Darling Consulting Group, Inc.Page 36
FHLB Des Moines Borrowing Costs with Dividend Adjustment 2019 Darling Consulting Group, Inc.Page 37
Marginal Cost Analysis: MMDA 2019 Darling Consulting Group, Inc.Page 38
Marginal Cost of Funds MMDAFirst Level 2019 Darling Consulting Group, Inc.Page 39
Derivative/Option PricingNOTE: Decline in 5 Year Rate 2.25% to 1.34% 2019 Darling Consulting Group, Inc.Page 40
NEV SUP Test With 20MM 5 Yr Pay Fixed Swap, Hedge 1 Mo. AdvancesNet Impact in 300bps Shock Is 2.617MM to EquityNCUA SUPERVISORY NEV TESTBook ValueASSETSInvestments-200BP-100BP0 ShockNet Economic Value ( 000s) 100BP 200BP 300BP 18%40,00035,00030,000Loans25,000Other Assets20,000TOTAL ASSETS (EVA)% Chg from 0 Shock15,00010,0005,000LIABILITIESNon Maturity 109,842108,697Time .1%-27.0%-42.6%-57.3%BorrowingsOther Liabilities0NEV ( ) - Pct. Chg from 0 Shock20.0%TOTAL LIABILITIES (EVL)% Chg from 0 Shock10.0%0.0%-10.0%NET ECONOMICVALUE (NEV)% Chg from 0 Shock16.2%10.3%-20.0%-30.0%-40.0%-50.0%NEV Ratio (NEV/EVA)9.26%BP Chg from 0 -220-362-502-60.0%-70.0%NEV Ratio (NEV/EVA)NCUA Supervisory Test Thresholds 300 Shock ScenarioRisk LevelPost-Shock NEVNEV Sensitivity (%) 7% 40%Moderate4% up to 7%40% to 65%High2% up to 4%65% to 85% 2% 85%Low12.0%10.0%8.0%ExtremeNMD pricing for 0 shock and 300 based on NCUA guidance and all other scenarios are interpolated. NEV calculations are provided for informational purposes only.Falling Rate Shock Scenarios Book Value0 Shock Scenario 1% Premium from Book Value 100 Shock Scenario 2% Premium from 0 Shock (interpolated from NCUA guidance) 200 Shock Scenario 3% Premium from 0 Shock (interpolated from NCUA guidance) 300 Shock Scenario 4% Premium from 0 Shock 400 Shock Scenario 5% Premium from 0 Shock (interpolated from NCUA guidance) 2019 Darling Consulting Group, Inc.6.0%4.0%2.0%0.0%Page 41
Pay Fixed Swap 3 Years at 1.88%, Receive 3mo Libor at 2.50% 0 Cost of Insurance to Flat & Rising Rates (Think Opposite) Danger Ahead!Base Simulation as of 04/30/2019 50MM Interest Rate SwapNet Interest Income ( 000)Net Interest Income ( 0010,50010,5008,500Q1Q2Q3BaseQ4Q1Q2Q3Down 200BPQ4Q1Q2Q3Q4Q1Down 100BPQ2Q3Up 200BPQ4Q1Q2Q3Q48,500Q1Up 400BP 24MQ2Q3Q4BaseQ1Q2Q3Q4Down 200BPQ1Q2Q3Down 100BPNII SUMMARYQ4Q1Q2Q3Q4Up 200BPQ1Q2Q3Q4Up 400BP 24MNII SUMMARYDown 200BPDown 100BPBaseUp 200BPUp 400BP 24MDown 200BPDown 100BPYear-1 NII53,83354,52354,27551,00151,017BaseUp 200BPUp 400BP 24MYear-1 NII53,74254,64354,60651,754Year-2 NII49,54654,01355,65451,15651,77047,547Year-2 NII48,86053,83355,98252,498Year-3 NII45,30452,74856,86049,30855,86051,226Year-3 NII44,61852,56957,18857,201Year-4 NII43,02652,11953,58157,99660,05358,716Year-4 NII43,02652,11957,99660,053Year-5 NII41,45851,64058,71658,85463,66465,440Year-5 NII41,45851,64058,85463,66465,440Down 200BPDown 100BPBaseUp 200BPYear-1 NII-91120331753753Year-2 NII-687-1803271,3411,761Year-3 NII-687-1803271,3412,355Year-4 NII00000Year-5 NII00000CHANGE / DIFFERENCE IN RESULTSUp 400BP 24M 50MM 3 year Swap: Paying 1.88% and receiving 3M LIBOR (currently @ 2.50%). 2019 Darling Consulting Group, Inc.Page 42
Roll Funding Short and BUY an Interest Rate Cap3 Year Cap @2.50% Strike 24BPS (8BPS/Year) 50MM Interest Rate CapBase Simulation as of 04/30/2019Net Interest Income ( 000)Net Interest Income ( 0010,50010,5008,500Q1Q2Q3Q4BaseQ1Q2Q3Down 200BPQ4Q1Q2Q3Q4Down 100BPQ1Q3Q2Up 200BPQ4Q1Q3Q2Q48,500Q1Up 400BP 24MQ2Q3Q4Q1Q2Q3Q4Q1Q2Q3Down 100BPDown 200BPBaseQ4Q1Q2Q3Q4Up 200BPQ1Q2Q3Q4Up 400BP 24MNII SUMMARYNII SUMMARYDown 200BPDown 100BPBaseUp 200BPUp 400BP 24MYear-1 NII53,79254,48254,24451,39351,40947,547Year-2 3 6Year-4 0Year-5 NII41,45851,64058,85463,66465,440Down 200BPDown 100BPBaseUp 200BPYear-1 NII-41-41-31391391Year-2 NII-41-41-289861,406Year-3 NII-41-41-289862,000Year-4 NII00000Year-5 NII00000Down 200BPDown 100BPBaseUp 200BPUp 400BP 24MYear-1 NII53,83354,52354,27551,00151,017Year-2 NII49,54654,01355,65451,156Year-3 NII45,30452,74856,860Year-4 NII43,02652,119Year-5 NII41,45851,640CHANGE / DIFFERENCE IN RESULTSUp 400BP 24M 50MM 3 year Cap on 3M LIBOR @ 24bps up-front; Strike rate at 3M LIBOR (currently 2.50%). 2019 Darling Consulting Group, Inc.Page 43
SELL Callable Bonds & Buy MBS (Or Pre-invest)(And, NEVER Buy Callable Bonds Ever Again!)Base as of 3/31/2019Bond Portfolio Restructure - Sell AgenciesNet Interest Income ( 000)Net Interest Income ( ,8254,225Q1Q2Q3BaseQ4Q1Q2Q3Steep Down 200BPQ4Q1Q2Q3Q4Down 100BPQ1Q2Q3Q4Yield Curve TwistQ1Q2Q3Q44,225Q1Up 400BP 24MQ2Q3BaseQ4Q1Q2Q3Q4Steep Down 200BPQ2Q3Down 100BPNII SUMMARYSteep Down 200BPQ1Q4Q1Q2Q3Q4Yield Curve TwistQ1Q2Q3Q4Up 400BP 24MNII SUMMARYDown 100BPBaseYield Curve TwistUp 400BP 24MSteep Down 200BPDown 100BPBaseYield Curve TwistUp 400BP 24MYear-1 NII20,89720,88521,03721,13221,009Year-1 NII20,98820,99421,15121,25521,142Year-2 NII20,73520,32121,00221,15720,810Year-2 NII20,80220,43121,10521,26820,929Year-3 NII20,88319,98121,12021,37121,175Year-3 NII20,94220,07021,19321,42621,212Year-4 NII20,71119,58221,42322,72223,591Year-4 NII20,76219,65621,45022,68123,483Year-5 NII20,40819,13721,58624,17126,255Year-5 NII20,45419,20121,60724,13626,164CHANGE / DIFFERENCE IN RESULTSSteep Down 200BPDown 100BPBaseYield Curve TwistUp 400BP 24MYear-1 NII91109114123132Year-2 NII66110103111119Year-3 NII5889735537Year-4 NII527427-41-109Year-5 NII456420-35-91This simulation assumes the Bank sells 10.5MM of callable Agency bonds and uses those funds to purchase 20Y MBS bonds @ 3.05%Income numbers do not reflect estimated loss of 100K- 125K. 2019 Darling Consulting Group, Inc.Page 44
HOLD 30 Year Mortgages 4.25% Funded With Short AdvancesBase as of 3/31/2019 10MM Loan Growth - 30Y Residential MortgagesNet Interest Income ( 000)Net Interest Income ( ,8254,225Q1Q2Q3BaseQ4Q1Q2Q3Steep Down 200BPQ4Q1Q2Q3Q4Down 100BPQ1Q2Q3Q4Yield Curve TwistQ1Q2Q3Q44,225Q1Up 400BP 24MQ2Q3BaseQ4Q1Q2Q3Q4Steep Down 200BPQ2Q3Down 100BPNII SUMMARYSteep Down 200BPQ1Q4Q1Q2Q3Q4Yield Curve TwistQ1Q2Q3Q4Up 400BP 24MNII SUMMARYDown 100BPBaseYield Curve TwistUp 400BP 24MSteep Down 200BPDown 100BPBaseYield Curve TwistUp 400BP 24MYear-1 NII20,89720,88521,03721,13221,009Year-1 NII21,14621,07121,18621,28121,086Year-2 NII20,73520,32121,00221,15720,810Year-2 NII21,10420,55321,15321,20720,708Year-3 NII20,88319,98121,12021,37121,175Year-3 NII21,25320,20721,27521,37321,010Year-4 NII20,71119,58221,42322,72223,591Year-4 NII21,07719,79921,57722,74223,463Year-5 NII20,40819,13721,58624,17126,255Year-5 NII20,77119,34721,74024,20626,158CHANGE / DIFFERENCE IN RESULTSSteep Down 200BPDown 100BPBaseYield Curve TwistYear-1 NII249186149149Up 400BP 24M77Year-2 NII36923215050-102Year-3 NII3692261552-165Year-4 NII36621815520-128Year-5 NII36321015434-98This simulation assumes the Bank funds 10MM of 30Y Residential mortgages @ 4.25% with 3 month FHLB advances @ 2.73%. 2019 Darling Consulting Group, Inc.Page 45
Strategy ConsiderationsAsset Sensitive IRR ProfileConsiderations: Extend cash/pre-invest (MBS, DUS, Trsy) Consider buying call protection Mismatched leverage Understand capacity to extend assets(“core funding” utilization next page) Flexibility with commercial deals andstructures; front run repricing deals Hold portion of fixed rate mortgages Positioning of wholesale funding anddeposit specials ”short” Understand role of derivatives (floors,receive fixed swaps, sell caps, etc.) 2019 Darling Consulting Group, Inc.Page 46
Core Funding UtilizationQuantifying Capacity for Added Asset DurationINTEREST RATE SCENARIOSBaseUp 200BP270,678Up 400BP 24MAssets ( 60 Months)449,619Core Liabilities ( 60 67836,67836,67836,678Other 853,8344845,108SavingsOther Deposits% Utilization 2019 Darling Consulting Group, Inc.Down %39.0%39.6%HISTORICAL ASSESSMENTPage 47
Investment Strategy Then: Now Requires Loans For Same Yield4.12% YIELD @ 96 MBS Funded With 1 Month Advances 2019 Darling Consulting Group, Inc.Year-200 bps-200StpnBase 200 bps1 181 222 237 2442 258 391 313 1433 474 670 394 20Total 913 1,283 944 407Page 48
Asset Sensitive: Fixed Rate CRE Funded ShortHigher Earnings,Retain Asset Sensitivity&Never Make Less Than TodaySimulate a “Big ” to Make a Point Then Scale Back 2019 Darling Consulting Group, Inc.Page 49
150MM 5 Year Receive Fixed/Pay Floating Swap ( 9/30/18)(Spread TOO THIN?.Best Opportunities When Tight!!)BASE SIMULATION AS OF 3/31/2019 150MM Swap (Pricing as of 9/30/2018)Net Interest Income ( 000)Net Interest Income ( 7514,12514,1259,675Q1Q2Q3BaseQ4Q1Q2Q3Q4Down 200BPQ1Q2Q3Q4Steep Down 200BPQ1Q2Q3Q4Down 100BPQ1Q2Q3Q49,675Q1Up 200BPQ2Q3Q4BaseQ1Q2Q3Q4Down 200BPQ1Q2Q3Q4Steep Down 200BPNII SUMMARYQ1Q2Q3Q4Down 100BPQ1Q2Q3Q4Up 200BPNII SUMMARYDown 200BPSteep Down 200BPDown 100BPBaseUp 200BPDown 200BPSteep Down 200BPYear-1 NII79,13580,23282,73383,57991,232Down 100BPBaseUp 200BPYear-1 NII81,74582,84284,59384,689Year-2 NII66,34972,59778,75184,73190,842101,219Year-2 NII70,45976,70781,36185,841Year-3 NII60,61871,29976,41099,32985,453105,136Year-3 NII64,72875,40979,02086,563103,246Year-4 NII57,09370,555Year-5 NII54,56870,02474,60486,177108,445Year-4 207Year-5 NII58,67874,13475,67788,351110,317Receive Fixed @5.74%Pay Floating Prime@5.50%5 year Term InsurancePolicyCHANGE / DIFFERENCE IN RESULTSDown 200BPSteep Down 200BPDown 100BPBaseYear-1 NII2,6102,6101,8601,110Up 200BP-390Year-2 NII4,1104,1102,6101,110-1,890Year-3 NII4,1104,1102,6101,110-1,890Year-4 NII4,1104,1102,6101,110-1,890Year-5 NII4,1104,1102,6101,110-1,890The simulation assumes the execution of a 150MM swap.The Bank receives a fixed rate of 5.74% and pays Prime (5.00%). 2019 Darling Consulting Group, Inc.Page 50
150MM 5 Year Receive Fixed/Pay Floating Swap(Current Pricing Why Did I Wait!?)BASE SIMULATION AS OF 3/31/2019 150MM Swap (Current Pricing)Net Interest Income ( 000)Net Interest Income ( 7514,12514,1259,675Q1Q2Q3BaseQ4Q1Q2Q3Q4Down 200BPQ1Q2Q3Q4Steep Down 200BPQ1Q2Q3Q4Down 100BPQ1Q2Q3Q49,675Q1Up 200BPQ2Q3Q4BaseQ1Q2Q3Q4Down 200BPQ1Q2Q3Q4Steep Down 200BPNII SUMMARYQ1Q2Q3Q4Down 100BPQ1Q2Q3Q4Up 200BPNII SUMMARYDown 200BPSteep Down 200BPDown 100BPBaseUp 200BPDown 200BPSteep Down 200BPYear-1 NII79,13580,23282,73383,57991,232Down 100BPBaseUp 200BPYear-1 NII79,97581,07282,82382,919Year-2 NII66,34972,59778,75184,73189,072101,219Year-2 NII68,68974,93779,59184,071Year-3 NII60,61871,29976,41097,55985,453105,136Year-3 NII62,95873,63977,25084,793101,476Year-4 NII57,09370,555Year-5 NII54,56870,02474,60486,177108,445Year-4 207Year-5 NII56,90872,36473,90786,581108,547CHANGE / DIFFERENCE IN RESULTS 2019 Darling Consulting Group, Inc.The simulation assumes the execution of a 150MM swap.The Bank receives a fixed rate of 5.06% and pays Prime (5.50%).Down 200BPSteep Down 200BPDown 100BPBaseUp 200BPYear-1 NII84084090-660-2,160Year-2 NII2,3402,340840-660-3,660Year-3 NII2,3402,340840-660-3,660Year-4 NII2,3402,340840-660-3,660Year-5 NII2,3402,340840-660-3,660Insurance PolicyWe DO NOT NecessarilyWant This To Look Good!!!Page 51
Current Lending Market Observations Flat Yield Curve & Lower Term Rates Loan pricing under downward pressure (25-50BP at minimum) Elevated “non-rate” based competition: Terms & conditions remain ALCOs questioning growing loans at thinner spreads 2019 Loan Growth Outlook Facing “Headwinds” Prepayments/Refis a BIG issue Treadmill speeding up (net/gross loans becoming a real challenge) Concentrations becoming more of an issue Credit concerns? 2019 Darling Consulting Group, Inc.Page 52
Lending Discussion Items Fixed Rate Lending: “What’s the Buzz”The “Matched Funding” MythPressures to Extend? Some Negotiation StrategiesRevisiting Adjustable CRE Repricing Terms/ConditionsFront Running Refinancing RiskPrepayment Penalties: “The Great Giveaway”Credit Lines: Fixed vs. FloatingRelationship Managers vs. Lenders: What’s in a Name?Loan Pricing ModelsTax law Changes: Credit Stress Testing/Capital PlanningWhy Changes in Derivatives Accounting MatterSome Comments on Residential/Consumer Lending 2019 Darling Consulting Group, Inc.Page 53
A Top of the List ALCO Issue(And Why Not? What Is the Issue? FHLB Your Best Friend to Manage Risk)Fixed Rate Lending: “Just Say No”? 2019 Darling Consulting Group, Inc.Page 54
Get Ahead of Upcoming Maturities/Re-pricingsWhat About Forward Rate Locks on Advances? Swaps? 2019 Darling Consulting Group, Inc.Page 55
CRE RepricingsMerit to Pro-Actively Renegotiating Prior to Contractual Reset? Could any of these loans go elsewhere at reset? Can we pro-actively lock in at a higher rate (albeit lower than contractualreset) and recast prepayment penalties/additional fees? 2019 Darling Consulting Group, Inc.Page 56
Derivative/Option PricingNOTE: Decline in 5 Year Rate 2.25% to 1.34% 2019 Darling Consulting Group, Inc.Page 57
2019 Darling Consulting Group, Inc.Page 58
Strategies for the Current EnvironmentManaging Trade-OffsEarnings and Interest Rate Risk (Asset Sensitive)Common Strategy Issues/Challenges: Strong bias for rising rates, but worstcase exposure is falling ratesBest timing for “buying” protection?Capacity to tolerate asset duration, butculturally conditioned to avoid assetdurationShort term funding “fits” my balancesheet, but Fed and market signally morerate hikesDo the Right Thing! No Gambling 2019 Darling Consulting Group, Inc.Strategy Considerations: Extend cashUnderstand tolerance for added duration(how much? how far? What asset classes?)Hold portion of fixed rate mortgagesFlexibility with commercial deals andstructuresMismatched leveragePrioritize call and prepay protectionInterest rate swaps/ floors (New acct’g rules)Page 59
Strategies for the Current EnvironmentManaging Trade-OffsEarnings and Interest Rate Risk (Liability Sensitive)Common Strategy Issues/Challenges: Degree and timing of deposit cost pressuresunknown variableCost of maturity extensions is expensive,especially to incremental asset yields (howfar should we go?)Limited wholesale funding limitedopportunity/control for maturity extensionLending landscape is predominately “fixed”ratesReducing IRR will cause reduction in income(at time when growth is slowing)Don’t over hedge and create risk to fallingrates 2019 Darling Consulting Group, Inc.Strategy Considerations:PAY NOW Today’s Deposit Premium May beTomorrow’s Cheap Cost of Funds Limit growth in “long” assets to growth in“long” funds Increase emphasis on acquisition of newchecking relationships (shift in incentive plans) Replace duration in bond portfolio withduration in loan portfolio Increase education on using yield curve in loannegotiations Increase usage of wholesale funding (marginalcosts and control over maturities) Loan Level Back to Back Swaps Macro level Hedges (swaps and caps) Page 60
7 Great Reasons to Use Wholesale FundingMirror, Mirror On the Wall, What’s the Smartest Decision of All
FHLB Des Moines and Darling Consulting Group Current Issues in Liquidity Management Thursday, August 8th 3:00 PM CT Examine key business issues and trends to help defend your liquidity position, understand key requirements of a comprehensive liquidity management system and learn why your management strategy and philosophy are crucial.