Transcription
Advances in Economics, Business and Management Research, volume 160Proceedings of the International Conference on Business and Management Research (ICBMR 2020)Strategies to Revitalize Garuda Indonesia RouteProfitability to Improve Financial PerformanceLidia Monika1,* Kinsenary Tjendrasa11*School of Business and Management, Institut Teknologi Bandung, IndonesiaCorresponding author. Email: lidia monika@sbm-itb.ac.idABSTRACTPT Garuda Indonesia (Persero) Tbk ("Garuda Indonesia") is the Indonesian flag carrier. In 2011, Garuda Indonesiaissued a long term plan: The Strategic Milestones Quantum Leap 2011-2015. The strategy map aims to expand thebusiness massively, including the number of aircrafts in service. However, the world economy slowed down, and theovercapacity market directly impacted the massive expansion of the airline. The company reported losses in 2014.Since then, the company is struggling with fluctuated operating income. This research conducted a Root CauseAnalysis for the business problems using 5 Whys. The first result of the analysis is the situation where the number ofpassengers is reaching saturation point while the regional airline fleet is still expanding, which has caused intenseprice competition among airlines. The situation forces Garuda Indonesia to keep offering low Passenger Yield inInternational routes. The second result is the oversupply condition where the available seat capacity is bigger than themarket size. These factors impact two out of three main aircraft types operating in the domestic area. The productionis declining, and aircraft utilization is low, resulting in negative performance. This research aims to find solutions tothese issues by proposing the most suitable alternative scenario to reduce the impact of overcapacity on the financialcondition using the Route Profitability (“RP”) Model. Calculation of the RP model has considered the effect of theCOVID 19 pandemic on the aviation industry.Keywords: Airline, Fleet Utilization, RP Model, COVID 19.1. INTRODUCTIONCommercial airlines provide air transport servicesto carry passengers, cargo, and mail to destinations.Commercial airlines usually provide scheduled and/ornon-scheduled commercial air transport services. Mostof the commercial airlines provide scheduled routeswith a regular route and scheduled time of departure.The non-scheduled flight offers air transport forpassengers, cargo, or other special purposes flight.The non-scheduled flight includes charter flight andhajj flight.Scheduled airlines develop routes to provide airtransport to its customers. It utilizes aircrafts, sets slottime, and service standards to meet its customer needs.A combination of those factors affects the airline'saircraft specification. The airline needs to assign theright type of aircraft to each route to optimize fleetoperational.The size of airline capacity is usually explainedwith Available Seat-Kilometer measurement. TheAvailable seat-kilometre ("ASK") is the number ofpassenger seats offered by the airlines multiplied bykilometres flown. Since not all of the seats offered arefilled with passengers, the airline industry measuresthe amount of capacity filled with Revenue PassengerThis research relies only on secondary data byapplying specific rates for each revenue and costcomponent in the RP Model based on an annualreport, published rate, published data, modification ofinternal data and other sources. This research wasprepared based on numerous assumptions that weredone before or during the COVID-19 pandemic. Thecalculations and recommendations are subject touncertainties, risks and other factors that can cause theactual results to differ materially from the expectedresults.Copyright 2020 The Authors. Published by Atlantis Press SARL.This is an open access article distributed under the CC BY-NC 4.0 license 4
Advances in Economics, Business and Management Research, volume 1602. LITERATURE REVIEWthe value of the future lease payments under the lease[2].Commercial airlines provide air transport servicesto carry passengers, cargo, and mail to destinations.Commercial airlines usually provide scheduled and/ornon-scheduled commercial air transport services. Mostof the commercial airlines provide scheduled routeswith a regular route and scheduled time of departure.The non-scheduled flights offer air transport forpassengers, cargo, or other special purposes flights.The non-scheduled flights include chartered flightsand hajj flights.2.1. Relation of Airlines Cost and AircraftUtilizationCost levels are directly related to the number andtype of aircraft in a given fleet. An airline with asmall fleet will proportionally incur higher costs incertain areas, in terms of spares and crew, than anairline with a larger fleet. Also, an airline’s abilityto maximize its fleet utilization is inhibited bycertain commercial factors [1].2.2. Operating LeaseThe most interesting feature of an operating leaseis the cancellation option. This option gives the lesseethe right to cancel the lease contract before theexpiration date. If the option to cancel is exercised, thelessee must return the equipment to the lessor. Thevalue of a cancellation clause depends on whetherfuture technological or economic conditions are likelyto make the value of the asset to the lessee less than3. RESEARCH METHODOLOGYThis research conducts external analysis usingPESTEL and Porter’s 5 Forces analysis, and it can beconcluded that the aviation market has become a verycompetitive industry in a price-sensitive market. Thegovernment’s program to attract 20 millioninternational tourists per year and build 5 SuperPriority Destinations gives an opportunity for GarudaIndonesia to grab new markets. It is importantconsidering the impact of Covid-19 pandemic on theairline industry. Airline production is estimated toreduce by 50% in 2020 and will not recover until2023.This research also conducts internal analysis ofGaruda Indonesia by comparing its revenue and costperformance to other airlines. In general, GarudaIndonesia’s Passenger Yield ratio is below otherairlines. Garuda Indonesia’s ratio of Revenue per ASKand Cost per ASK is also lower compared to otherairlines.This research determines the most suitable strategyby comparing future aircraft profitability from severalscenarios using the RP Model approach. The RPModel is one management approach that provides thefinancial position on a specific flight. It allocates costand revenues incurred on every flight and provides aprofitability position for a particular flight.Table 1 shows the comparison of the concept ofTable 1. Concept Comparison of the RP Model and profit Loss.RevenueCostResultAircraft Profitability – The RP modelAircraft RevenueConsist of all revenue generated from a scheduledflight may consist of revenue from the passenger,cargo, and ancillary.Aircraft CostConsist of all cost occurred in a flight, mayconsist of the cost related to the fleet, flight, crew,and overhead.Aircraft ProfitabilityThe result of Aircraft Revenue – Aircraft CostOperating Income – Financial StatementOperating RevenueConsists of revenue generated from the scheduledflight, non-scheduled flight, and other operating.Operating CostConsists of related and unrelated scheduled flight costs.May consist of cost to operate the airline's route orother unrelated costs such as charter cost, otheroperating costs such as loss exchange.Operating IncomeThe operating result from operating activities, from thescheduled and non-scheduled flight.Table 2. List of Revenue Component of The RP Model.Revenue ComponentPassenger (Pax) RevenueFreight RevenueMail RevenueOther RevenueAllocation BasedPax Yield x RPKCargo Yield x RPKbase on %-age of Net Pax, Freight & Mail Revenue185
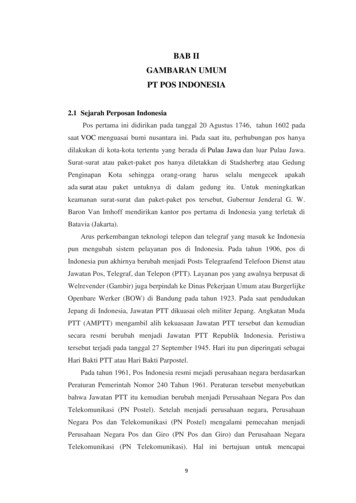
Advances in Economics, Business and Management Research, volume 160Table 3. List of Cost Component of The RP ModelCost ComponentFix/VariableAdministration – HO & BO- FixedAir Traffic Control - Route ChargeAir Traffic ControlNavigation ChargeAircraft LeaseAircraft Maintenance*Cabin Crew PersonCabin Crew TravelCockpit Crew PersonCost PostingA/CNon-A/CtypetypeTerminalAllocation BasedNet Pax Revenue, Freight & MailVariable Flight DistanceVariable Number of LandingFixedFixedFixedVariableFixed Per AircraftFlight HoursNumber of PersonnelBlock HourNumber of Personnel Fixed - Variable Block Hour with minimumCredit Card CommissionVariable Net Pax Revenue, Freight & MailFreight CommissionVariable Aircraft TypeFuel AircraftHandlingInsuranceVariableVariableFixed Net Freight & MailBlock HourNumber Of LandingLandingVariable Per Aircraft TypeFixed Number of LandingParking FeeVariable MarketingOn-Board ServicePassenger CommissionFixedVariableVariableReservationSales OrganizationVariableFixedCockpit Crew TravelLoan PaymentStationParking hourNet Pax Revenue, Freight & MailNumber of Pax Carried Net Passenger RevenueNumber of Passenger Carried Net Pax Revenue, Freight & Mail FixedVariable Net Pax Revenue, Freight & MailFixed - Variable Aircraft TypeStoring FeeVariable MaintenancePer Aircraft Route Profitability and Operating income in FinancialStatement. Table 2 and 3 are the list of revenue andcost components in the RP Model that are directly/notdirectly related to certain aircraft types. The list alsoprovides the allocation method used in this research.4. RESULTS4.1 Operating Revenue ComparisonSince each airline has a different number ofproduction and capacity, the airline's industry usuallyuses "Passenger Yield" and Revenue Available SeatKilometer (“RASK”) to compare revenue performanceamong airlines.Figure 1 shows a comparison of Garuda Indonesiapassenger yield with other airlines. It is present inUSc. In general, Garuda Indonesia’s Passenger Yieldis still below the average data. The Passenger Yieldfor the domestic route is above other non-Japan homebased airlines but below airlines with a home base inJapan. This trend indicates good revenue managementFigure 2 shows a RASK comparison of GarudaIndonesia and other benchmarked airlines. From thisfigure, it can be seen that in general RASK of GarudaIndonesia is below other airlines. In 2019, the RASKof the domestic route increased significantly from theprevious year.4.2 Operating cost ComparisonIn line with operating revenue comparison, it isalso challenging to directly compare costs amongairlines. The airline industry usually uses cost ratiomeasurement known as Cost per Available SeatKilometre (CASK).Figure 3 shows comparison of Garuda Indonesia’sCASK and other airlines. It can be concluded that theCASK of Garuda Indonesia’s airlines is below otherairlines that indicates a good cost-efficiency.186
Advances in Economics, Business and Management Research, volume 160Figure 1 Comparison of Passenger Yield between Benchmarked Airlines [2-6]Figure 2 Comparison Garuda Indonesia RASK Vs. Benchmarked Airlines [2-6]Figure 3 Comparison Garuda Indonesia CASK Vs. Benchmarked Airlines [2-6]4.3 Finding from Root Cause AnalysisFrom the root cause analysis above, it can beconcluded that Garuda Indonesia’s income statementfluctuates throughout the year because the mainproduct of Garuda Indonesia, which is passengerticket, has RASK CASK. There are two root causesof this issue: (1) The situation in international routeswhere the market faces overcapacity and the consumeris price sensitive. This situation has caused intenseprice competition among airlines in a price-sensitivemarket. This situation forces Garuda Indonesia to keepoffering low price tickets with no guarantee of fullpassenger load factor. (2) Oversupply of GarudaIndonesia aircraft in domestic routes cause theavailable seat capacity becoming bigger than themarket size. This situation results with two out ofthree aircraft types operating in domestic routeshaving low utilization and contributes to losses.5. DISCUSSIONThis research proposes strategies as follow: (1)Propose to cooperate with the government to bring in20 million international tourists to the nearest HUB ordirectly to the nearest airport of the Five SuperPriority Destinations and implement cost-sharingcooperation with the scheme to reduce the risk of lossfrom the additional capacity to bring 20 millioninternational tourists to Indonesia. (2) Collaborate todevelop a marketing campaign, especially tointernational tourists to promote Indonesia and GarudaIndonesia. The target is to put Garuda Indonesia as the187
Advances in Economics, Business and Management Research, volume 160Table 4. Profitability Comparison of aircraft #12020202120222023202420252026202720282029Scenario I-Scenario II-1%1%9%18%29%47%81%159%404%403%20%Scenario III-12%24%35%42%52%68%97%164%472%630%35%Scenario IV0%0%0%0%27%9%-22%-94%-428%-757%0%Scenario 1174.2%-1692%-51%Scenario III0%0%0%-41%1732%18%-10%-17%0%0%10%Scenario -348%Scenario V-590%82%139%301%2324%51%1%-11%0%0%-129%Scenario ble 5. Profitability Comparison of aircraft #22020202120222023202420252026202720282029Scenario I0%0%0%0%0%0%0%0%0%0%0%Scenario II0%0%0%0%-96%9%8%3%0%0%6%top of mind for travellers to Indonesia. (3) Increaseaircraft utilization that mainly operates in theDomestic Market and minimizes the impact onfinancial performance. This research proposes themost suitable strategies by calculating future aircraftprofitability using the RP Model. Results are shownon Table 4 and Table 5.6. CONCLUSIONThis research proposes revitalization strategies forGaruda Indonesia to strengthen its financialperformance as follow: (1) Propose to cooperate withthe government to bring in 20 million internationaltourists to the nearest hub or directly to the nearestairport of the Five Super Priority Destinations andimplement cost-sharing cooperation with the schemeto reduce the risk of loss from the additional capacityto bring 20 million international tourists to Indonesia.(2) Collaborate to develop a marketing campaign,especially to international tourists to promoteIndonesia and Garuda Indonesia. The target is to putGaruda Indonesia as the top of mind for travellers toIndonesia. (3) Strategies to increase aircraft utilizationthat mainly operates in the domestic market andminimize the impact on financial performance.Using the RP Method, this research proposes themost suitable strategies to increase aircraft utilizationthat mainly operates in the domestic market andminimize the impact on financial performance, asfollow: (1) To transfer the aircraft #1 to the LCCsubsidiary by the end of 2020. This research predictsthere will be an improvement in financialperformance. The loss will reduce gradually in theperiod of 2021-2026, and the aircraft is predicted to beprofitable in 2027. The aircraft utilization is predictedto be improved from 1:48 hours per day to 5:37 hoursper day. (2) The most suitable alternative scenario toincrease utilization and reduce the loss for aircraft #2:(a) With a realistic assumption, this final projectpredicts that the best scenario is for Garuda Indonesiato sublease one aircraft to another company and beprofitable in 2025. This scenario will improve aircraftutilization from 3:31 to 8:07 hours per day. (b) Withan optimistic assumption, It assumed that GarudaIndonesia could sublease six aircraft to othercompanies by the end of 2023. This final projectpredicts that with this scenario, the aircraft#2 will beprofitable in 2024. This scenario will improve aircraftutilization from 3:31 to 8:07 hours per day. This timethe airlines experienced turbulence due toovercapacity, a price-sensitive market, and theCOVID-19 pandemic. The airline needs to adopt asurvival strategy to reduce costs and maintain ahealthy cash flow.This research can be developed for furtherresearch, especially for a more detailed strategy inimproving international routes. In the case of the nextresearch, which also assumes collaboration using a188
Advances in Economics, Business and Management Research, volume 160cost sharing scheme with the government, it isnecessary to identify the origin country of the targetedtourists. Therefore, the next research will be able tocalculate it in detail.REFERENCES[1] M. A. Camilleri, Aircraft Operating Costs andProfitability. In Travel Marketing, TourismEconomics and the Airline Product. Switzerland:Springer Nature, 2018.[2] All Nippon Airways Co., Ltd, “Annual Report,”All Nippon Airways Co., Ltd, 2014 – stors/irdata/annual/ [Accessed: 13 April report [Accesed: 12 April 2020].[4] Japan Airlines Co., Ltd., “Annual Report,” JapanAirlines Co., Ltd., 2014 – 2018. finance/[Accessed: 13 April 2020].[5] Singapore Airlines., “Annual Report,” ww.singaporeair.com/en ort/[Accessed: 10 April 2020].[6] Garuda Indonesia, “Annual Report,” GarudaIndonesia, 2015 – 2020. Available: www.garudaindonesia.com [Accessed: 10 April 2020].[3] China Airlines, “Annual Report,” China Airlines,2015 – 2020. Available: https://www.china-189
In general, Garuda Indonesia's Passenger Yield is still below the average data. The Passenger Yield for the domestic route is above other non-Japan home based airlines but below airlines with a home base in Japan. This trend indicates good revenue management Figure 2 shows a RASK comparison of Garuda Indonesia and other benchmarked airlines.

![JMK-nas-8a- [20-1-2018] revision Purwanto - Universitas WR Supratman](/img/15/cekplagiasi-plagiasi-20marketing-20politik.jpg)