Transcription
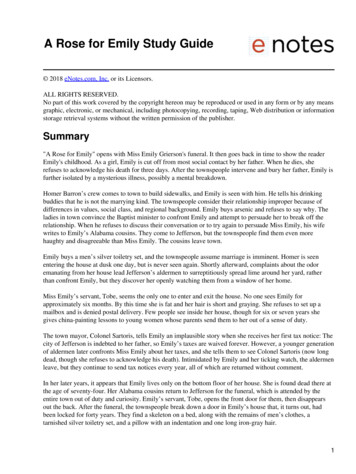
Research BriefDecember 2019State and County Population Estimates for Utah: 2019Emily Harris, Demographer, Kem C. Gardner Policy InstituteTable of ContentsFigure 1: County Population Estimates, 2019Overview. . . . . . . . . . . . . . . . . . . . . . . . . . . . . . . . . . . . . . . . . . . . . . . . . . .Overall Population Change. . . . . . . . . . . . . . . . . . . . . . . . . . . . . . . . . .Natural Increase . . . . . . . . . . . . . . . . . . . . . . . . . . . . . . . . . . . . . . . . . . . .Net Migration. . . . . . . . . . . . . . . . . . . . . . . . . . . . . . . . . . . . . . . . . . . . . . .Conclusion . . . . . . . . . . . . . . . . . . . . . . . . . . . . . . . . . . . . . . . . . . . . . . . . .About the Utah Population Committee (UPC). . . . . . . . . . . . . . . .Endnotes. . . . . . . . . . . . . . . . . . . . . . . . . . . . . . . . . . . . . . . . . . . . . . . . . . .Appendix. . . . . . . . . . . . . . . . . . . . . . . . . . . . . . . . . . . . . . . . . . . . . . . . . . .13445556Box Elder56,329The Utah Population Committee (UPC), chaired by the KemC. Gardner Policy Institute, produced Utah’s state and countypopulation estimates for July 1, 2019. The 2019 estimatesare based on the most recent Decennial Census (2010). Eachsubsequent year since 2010 the UPC estimation processbecomes more challenging and uncertain. The upcoming2020 Decennial Census will serve as the baseline for populationestimates moving forward.Over the last decade, a series of exceptional events havereshaped population dynamics as well as the source dataand associated assumptions implicit in the UPC estimationmethodologies. Among these: the Great Recession (20082011), the Church of Jesus Christ of Latter-day Saints missionaryage change policy (2013-2015), declining fertility rates coupledwith an aging population, and federal tax reform (2017). Thelong-run demographic trends of declining fertility, the agingpopulation, and shifting migration cumulated over the decade.Utah has subsequently experienced a shift in the source ofpopulation growth, with more net migration and declinesin natural increase. Southwestern Utah continues its rapidpopulation growth while urban growth continues to shiftsouthward along the Wasatch Front.These estimates indicate that the state added approximately456,000 people since April 1, 2010, reaching an estimated3,220,262 Utahns. From 2018 to 2019, the population grew by53,596 people. This annual growth rate of 1.7% matches theKem C. Gardner Policy InstituteIWeber 253,455Davis Morgan356,964 12,189Summit 41,824 Daggett 1,073Salt Lake1,152,960Wasatch32,866 verview1,073 - 50,00050,001 - 100,000100,001 - 350,000350,001 - 600,000600,001 - 754Garfield5,226San Juan16,680Kane7,716Washington180,550Source: Utah Population Committee, Kem C. Gardner Policy Instituteprevious year’s percent growth. The 2019 estimates indicatethat Utah’s rapid growth is moderating. Utah’s total absolutegrowth increased slightly by 913 compared to last year.National and Utah births have declined annually since 2008.Utah’s 46,990 births in fiscal year 2019 are at the lowest levelsince 2000. Utah maintains one of the highest fertility rates inthe nation. However, Utah’s total fertility rate (2.026 in 2018)is currently fourth to South Dakota (2.154), North Dakota(2.033), and Nebraska (2.031).1 After decreasing last year, Utah’snet migration increased in 2019 to 24,987, above last year’sestimate by 1,787 or 7.7%. Net migration contributed 33% ofUtah’s population growth since 2010.411 East South Temple Street, Salt Lake City, Utah 84111I801-585-5618Igardner.utah.edu
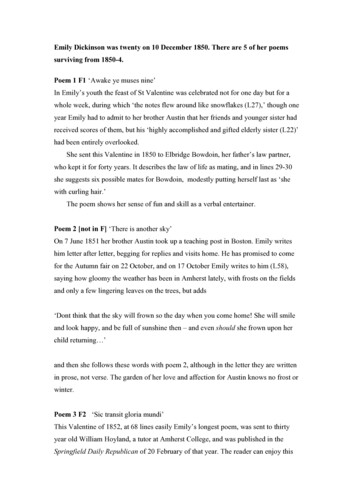
Figure 2: Utah’s Population and Annual Growth Rates, 3%1.92%1.89%1.74%1.8%1.69%1.6%1.69%1.56%1.46%% Population Growth3,100,000Total State Population Estimate201720182019% Annual GrowthSource: Utah Population Committee, Kem C. Gardner Policy InstituteTable 1: UPC Population Estimates- State and Counties, 899April1, 2010CensusCumulative 1020196,976Absolute 6210,117Increase52,27849,412 194201320149,5299,5539,631Births alt ,62938,59749,9756,35412.7%18,731 16.6%28,6090.4%79141.3%18,38150,485 16.5%1,029,655 1,031,697 1,046,461 1,060,336 1,070,815 1,080,905 1,094,681 1,108,910 1,128,271 1,142,081 1,152,960 123,30512.0%40,000San ion 147,061 NaturalIncrease138,115138,579141,797Net 17,735633,582651,409 134,845 8669,336 39.7%Population165,592Change 171,042 180,550 42,435 253,45522,2199.6%2,763,885 2,772,371 2,820,613 2,864,744 2,902,179 2,941,964 2,997,584 3,054,994 3,113,983 3,166,666 3,220,262456,37716.5%State-0.9%* Change calculated from April 1, 2010 Census Decennial Count to July 1, 2019 UPC EstimateNotes: All UPC data are dated July 1 of the calendar year. 2018 revisions occurred due to updated vital records dataSources: U.S. Census Bureau (April 1, 2010); Utah Population Committee, Kem C. Gardner Policy Institute (2010-2019)December 2019Igardner.utah.edu2I N F O R M E D D E C I S I O N S TM
Utah County experienced the highest numeric annual increasethis year with 17,827 new residents or 2.8% growth. This is thesecond highest annual growth for Utah County this decade,only surpassed in 2015 with 18,500 in population growth.This increase is 6,948 higher than Salt Lake County’s 10,879population increase (or 1.0% growth), which is down from lastyear’s 13,810 annual growth. Figure 1 displays the 2019 countypopulation estimates.Certain Wasatch Front counties, Tooele, Wasatch, and Juab,and the two main southwestern counties, Washington andIron counties, experienced the fastest growth this year.Approximately one-third of Utah’s counties had higher naturalincrease this year compared to last year.Several counties are experiencing significant growth. Theseinclude Tooele County, at 3.0% and the second fastest growth inthe state, and Utah County at 2.8%. However, Washington Countyexperienced the highest population percentage increase in thestate at 5.6%, with Iron County being the other southwesternstate with fast growth at 2.3% (see Figure 3).Net migration is the main source of population increase inthese high growth counties. Historically, the majority of UtahCounty’s growth is due to natural increase. However, this is thefirst year in this decade that net migration has been its majorsource of population growth.These trends are consistent with the Census Bureau’s countyand metropolitan estimates from 2019 when Wasatch Countywas third in the nation for fastest cumulative growth since 2010.St. George was ranked as the third fastest growing metropolitanarea in the country, Provo-Orem metropolitan area was rankedtenth, and the Heber and Cedar City micropolitan areas werenationally ranked third and fourth respectively.2Six counties have estimated population loss: Duchesne,Emery, Garfield, Grand, Kane, and Rich counties. Grand Countyis the only of those counties to have natural decrease (moredeaths than births), though it also has net out-migration. Allother counties with annual population decline have morepeople migrating out of, rather than into, the county.Overall Population ChangeUtah continues to experience strong population growth,similar to last year, albeit at a slightly lower rate than 2015through 2017 (see Figure 2). Historically, natural increasedominated the state’s total population growth. In 2019, positivenet migration contributed a larger than normal share of thestate’s population growth, 47%, as natural increase continuesto decline for the sixth year in a row.Figure 3: Absolute and Percentage Changes in County Population, 2018-2019Cache2,500Box Elder643Rich-30Weber 1,884Davis Morgan4,159 226 Summit539Salt Washington9,508Rich-1.2%Weber 0.8%Davis Morgan1.2% 1.9% Summit1.3%Salt LakeDaggett n lard1.2%Beaver0.9%Daggett 45 00.1% to 0.4%0.5% to 1.4%1.5% to 3.0%3.1% to 5.6%0.9%Tooele3.0%Wayne2Garfield-3Cache1.9%Box Elder1.2%Carbon86Millard157Beaver66 01 - 500501 - 1,5001,501 - 5,000 5,000Grand-1.4%Wayne0.1%Piute2.9%Garfield-0.1%San Juan1.1%Kane0.0%Source: Utah Population Committee, Kem C. Gardner Policy InstituteI N F O R M E D D E C I S I O N S TM3gardner.utah.eduIDecember 2019
Natural IncreaseMost Utah counties are also experiencing decliningnatural increase. Of Utah’s 29 counties, only two have seen acumulative increase in births since 2010: Wasatch and Juab.Conversely, 27 of the 29 counties have experienced an increasein deaths since 2010 (only Beaver and Carbon counties havenot). Demographers expect this trend to 3,220,262continue, though2.6%3,220,2623,166,666age waves introduced by surgesof in-migrationof 2.6%young3,166,6663,113,9832.4%adults may 3,054,994mitigate theextent of declining natural thefuture.2,997,584% Population% onNatural increase is the number of annual births minus annualdeaths. Since July 1, 2010, Utah has experienced an annualdecline in natural increase, a result of annual births decliningwhile3,300,000annual deaths increasing. Overall national trends during3,300,000this 3,200,000same period depict a declining fertility rate significantly3,200,000impactedby the Great Recession (see Figure 4). Utah’s total3,100,0003,100,000fertility rate has fallen from 2.45 in 2010 to below 03) in 2018. 3 Both national and state total 0002,864,744increasingas median 1.8%2,772,371 increase accounts for 72,3712,800,000two-thirds of Utah’s population1.74%increase since 1990. However,1.6%1.69%1.69%1.56%2,700,000Net migration is gross in-migration (people moving into1.4% thesince2,700,0002013, lemoving1.37%1.46% Currently, natural increase1.31%2,600,000 growth.of populationaccounts1.37%for1.2%1.31%2,600,000out of the state or a county). Migration is historically1.2%more53%2,500,000of annual population growth in Utah, down from 77% 182019annualgrowth 2010in 2011. ions,2019 particularly inanindicator2016of favorableNet MigrationState Population EstimateState Population Estimate% Annual Growth% Annual GrowthFigure 4: State Vital Records, 00000201020102011201120122012Source: Utah Department of 201520162016Natural IncreaseNatural Increase201720172018201820192019Figure 5: State Components of Change, 9961998200019982000Net MigrationNet Migration200220042006200220042006Natural IncreaseNatural Increase200820102012200820102012Population ChangePopulation Change201420142016201620182018Sources: Utah Population Committee, Kem C. Gardner Policy Institute (2010-2019); Utah Population Estimates Committee (1990-2009)December 2019Igardner.utah.edu4I N F O R M E D D E C I S I O N S TM
Conclusionthe country’s western states.5 The other source of populationgrowth, natural increase, is more stable from year to year.Net migration contributed 47% of Utah’s population growthover the past year, up from 43% of state growth the year before.Utah’s net migration for 2019, 24,987, is 1,787 more than lastyear’s estimate. This is a rebound from last year’s net migrationdecline after a five-year run of increasing net migration.County net migration levels vary according to economicconditions and amenities of each county. Net in-migrationprovides over half of the population growth in the majority ofUtah’s counties. Statewide total net in-migration is greatest inUtah (the highest net in-migration in the state), Washington(only 169 less than Utah County), Salt Lake, Tooele, andCache counties (see Table 5 in the Appendix). Seven countiesexperienced net out-migration in the past year: Kane, Emery,Garfield, Rich, Grand, Uintah, and Duchesne.Utah has strong population growth, especially since 2013,although this growth has stabilized compared to last year. TheWasatch Front and southwestern Utah continue to expand andbring migrants from other regions. Natural increase remainspositive but continues to decline across the state and nation.As the last census count is farther away, and the next censusapproaches, population estimation is more challenging. TheCensus 2020 will provide more definitive insights into Utah’sdemographics.About the Utah Population Committee (UPC)The Utah Population Committee (UPC) prepares state andcounty-level estimates of the usual, resident population forthe state of Utah. State statute determines UPC membershipcomposition and utilization of the committee producedpopulation estimates. The Kem C. Gardner Policy Institute chairsand provides technical staff for the committee. The U.S. CensusBureau produces national, state, and county-level estimatesannually, but their methods lack a contextual understandingof each state. This motivates many states, including Utah, tocalculate their own set of estimates in order to create a moreprecise view and explanation of population change eachyear. For more information about UPC’s population estimatesmethodology, please reference UPC’s separate estimatesmethodology document.6Utah Population Committee (UPC) MembersPamela Perlich, UPC Chair, Kem C. Gardner Policy InstituteEvan Curtis, Governor’s Office of Management and BudgetDavid Landward, Dominion EnergyJacoba Larsen, Utah State Tax CommissionCarrie Mayne, Utah System of Higher EducationCollin Peterson, Department of Workforce ServicesJohn Sagers, Church of Jesus Christ of Latter-day SaintsAaron Brough, Utah State Board of EducationAndrea Wilko, Office of the Legislative Fiscal AnalystLinda Wininger, Utah Department of HealthAbout the Kem C. Gardner Policy InstituteThe Kem C. Gardner Policy Institute at the University of Utahenhances Utah’s economy by placing data-driven research intothe hands of decision makers. Its mission is to develop and shareeconomic, demographic, and public policy data and researchthat help community leaders make informed decisions. Learnmore at gardner.utah.edu or by calling 801-587-3717.Endnotes123456Martin JA, Hamilton BE, Osterman MJK, Driscoll AK. Births: Final data for 2018. National Vital Statistics Reports; vol 68, no 13. Hyattsville, MD: National Center for Health Statistics. 2019.Vintage 2018 Population Estimates, July 1, 2017 to July 1, 2018. United States Census Bureau.Martin JA, Hamilton BE, Osterman MJK, Driscoll AK. Births: Final data for 2018. National Vital Statistics Reports; vol 68, no 13. Hyattsville, MD: National Center for Health Statistics. 2019.Kem C. Gardner Policy Institute. (2016). Utah Demographics Fact Sheet: 6/02/Fact-Sheet.pdf.Li, W.L. 1976. A Note on Migration and Employment. Demography 13(4): 565-570.Kem C. Gardner Policy Institute. (2016). Utah Population Committee Methodology. Salt Lake City, UT: Kem C. Gardner Policy Institute, University of Utah: hodology.pdfI N F O R M E D D E C I S I O N S TM5gardner.utah.eduIDecember 2019
AppendixTable 2: Annual Births- State and Counties, 8Total 51061,112Box 26323333313627337Salt 17,21416,21615,971174,658San 0751,02450,70449,49447,62846,990503,571*Annual births are the previous fiscal year total (i.e. 2010 total births equals births occuring from July 1, 2009 through June 30, 2010).Notes: All UPC data are dated July 1 of the calendar year. 2018 revisions occurred due to updated vital records data. Counties may not sum to state due to birthsthat aren’t assigned to a specific countySource: Utah Department of HealthDecember 2019Igardner.utah.edu6I N F O R M E D D E C I S I O N S TM
Table 3: Annual Deaths- State and Counties, 0172018Total Deaths:2010-2019201970544460606960615859595Box alt ,79762,281San 381165,096*Annual deaths are the previous fiscal year total (i.e. 2010 total deaths equals deaths occuring from July 1, 2009 through June 30, 2010).Notes: All UPC data are dated July 1 of the calendar year. 2018 revisions occurred due to updated vital records data. Counties may not sum to state due to deathsthat aren’t assigned to a specific countySource: Utah Department of HealthI N F O R M E D D E C I S I O N S TM7gardner.utah.eduIDecember 2019
Table 4: Annual Natural Increase- State and Counties, 2010-2019County2010BeaverBox ElderCache20112012201320142015201620172018Total 258196Salt 069,5949,174112,377San 38,475*Annual Natural Increase is the previous fiscal year total (i.e. 2010 total natural increase equals births minus deaths occuring from July 1, 2009 through June 30, 2010).Notes: All UPC data are dated July 1 of the calendar year. 2018 revisions occurred due to updated vital records data. Counties may not sum to state due to vital records that aren’t assignedto a specific countySource: Utah Department of HealthDecember 2019Igardner.utah.edu8I N F O R M E D D E C I S I O N S TM
Table 5: Annual Net Migration- State and Counties, 8Total 102819-133Box 1136-2196355186Rich11-5-484517-20232-38-40Salt 281,70520,498San State* Due to the residual calculation of net migration, estimated net migration in 2010 is from the April 1, 2010 Census Decennial Count through July 1, 2010.Notes: All UPC data are dated July 1 of the calendar year. 2018 revisions occurred due to updated vital records data. County values may not sum to state due to net migration that isn’tassigned to a specific county.Source: Utah Population Committee, Kem C. Gardner Policy InstituteI N F O R M E D D E C I S I O N S TM9gardner.utah.eduIDecember 2019
Table 6: Annual Change- State and Counties, 2010-2019County2010Beaver2011105Box 1620174972201862Total 35549154Rich2713-1423243121457-30147Salt 6013,81010,879133,386San 459Notes: All UPC data are dated July 1 of the calendar year. 2018 revisions occurred due to updated vital records dataSource: Utah Population Committee, Kem C. Gardner Policy InstituteDecember 2019Igardner.utah.edu10I N F O R M E D D E C I S I O N S TM
Table 7: Annual Percent Change- State and Counties, 1%0.98%0.95%Box %0.58%2.42%-1.23%Salt .95%San 37%1.89%1.92%1.93%1.69%1.69%Notes: All UPC data are dated July 1 of the calendar year. 2018 revisions occurred due to updated vital records dataSource: Utah Population Commit
Gardner Policy Institute (2010-2019) Source: Utah Population Committee, Kem C . Gardner Policy Institute. Box Elder 643 Dagget t 12 Carbon 86 Beaver 66 Salt Lake 10,879 Washington 9,508 Cache 2,500 Juab 278 Millard 157 Weber 1,884 Uint ah 52 Sevier 292 Wasatch 729 Grand-145 Kane-2 Iron 1,249 Su mi 539 Duchesne-4 Piut e 4 9 Wayne 2 Davis 4,159 .