Transcription
Hispanic Health ProfileHouston/Harris CountyPopulation Growth, Demographics, Chronic Disease and Health DisparitiesCITY OF HOUSTONDepartment of Health and Human ServicesandHispanic Health Coalition2013
Letter from Houston Department of Health and Human ServicesLetter from Hispanic Health CoalitionJanuary 2, 2013January 2, 2013This health profile highlights the important health issues amongOn behalf of the Hispanic Health Coalition, we arethe Hispanic population in Harris County. This profile alsopleased to be a part of this collaborative to producehelps identify priority areas to promote health equity among thea Hispanic Health Profile of Harris County, Texas that depicts the key healthresidents of our growing, culturally, and ethnically diverse county.issues faced by Hispanics in Harris County.Hispanics is the largest and fastest growing population group in the nation. InGiven the lack of comprehensive information about the overall health status ofHarris County, per the U.S. Census 2010, the Hispanic population constitutedHispanics in Harris County, we have relied on national and state level data to41 percent of the population. Given the continuous growth and diversity of themake decisions. With this profile, we will have important baseline informationHispanics in our communities, it is the intention of the Houston Departmenton the health status of Hispanics, and a valuable resource to prioritize our nextof Health and Human Services (HDHHS), to promote a better understandingsteps. We hope that this profile will help initiate a dialogue among stakeholders inamong local residents, community-based organizations, community leaders,terms leveraging available resources, developing partnerships, and identifyingmedical providers, and the public health community of the unique characterpotential strategies to address the health issues among Hispanics.and circumstances of Hispanic communities. This profile also aims to drawAs a coalition of leaders from health care, education, social service, faith-attention to those issues that contribute to health disparities among theHispanic population.based, business, community and government organizations with experienceworking with the Hispanic population, we are committed to improve the healthThis profile also represents an effort on the part of HDHHS to provide aof our community as our mission.“baseline” of indicators of health in Hispanic communities, against which futureI would like to express my gratitude to Mr. Stephen L. Williams and his team attrends in conditions can be measured and monitored, and appropriate publichealth actions taken.Houston Department of Health and Human Services for their expert contributionin developing, synthesizing, and publishing this timely profile.We hope that this health profile will support these efforts in City of Houston andacross Harris County.Finally, I hope Hispanics living in Houston / Harris County, all the stakeholdersand policy makers will find this profile useful in understanding and examiningSincerely,the health disparities and in advocating for health equity.Thank you,Stephen L. Williams, M. Ed., M.P.A.DirectorHouston Department of Health and Human ServicesNorma Olvera, PhDPresidentHispanic Health Coalition, Houston, TexasHouston Department of Health and Human Services Hispanic Health Profile: Houston/Harris County 20131
Goals of this profile:u Depict the health of Hispanics living in Houston / Harris County.u Present information on current demographics, selected health conditions, healthbehaviors, and quality of life.u Highlight health disparities and identify priority areas to promote health equity.u Inform public health interventions and programs to reduce disease burdenamong Hispanics.u Provide information to policy makers and community leaders for decision making.Project DirectorFaith ForemanAssistant Director, Office of Health Planning, Evaluation & Program DevelopmentProject Oversight and EditingDeborah BanerjeeReport ContributorsVishnu Nepal, Priyanka Acharya, Monica Slentz,Misael Obregon, Patsy CanoAcknowledgementWe would like to extend our warmest gratitude to Brenda Reyes, Beverly Nichols,Johanna DeYoung, Norma Olvera, Solly Diaz, Benjamin Hernandez and LisandraLamboy for their valuable comments and for reviewing this profile.2Table of ContentsIntroduction . 3Socioeconomic, Cultural and Environmental ConditionsDemographics . 6Language Issues . 12Household Characteristics. 13Poverty. 15Education. 17Occupation . 18Insurance . 19Other Issues Impacting Health. 20Summary and Recommendations. 22Health Conditions and Quality of LifeStroke . 24Diabetes. 25Cancer . 28Overweight/Obesity. 29High Blood Pressure and High Cholesterol. 31Mental Health. 32Quality of Life. 34Summary and Recommendations. 36Health BehaviorsAlcohol Consumption . 38Smoking. 39Cancer Screening . 40Fruit/Vegetable Consumption and Physical Activity. 41Summary and Recommendations. 42Other Health ConcernsTeen Pregnancy. 44Prenatal Care. 45HIV . 46Summary and Recommendations. 47References . 48Houston Department of Health and Human Services Hispanic Health Profile: Houston/Harris County 2013
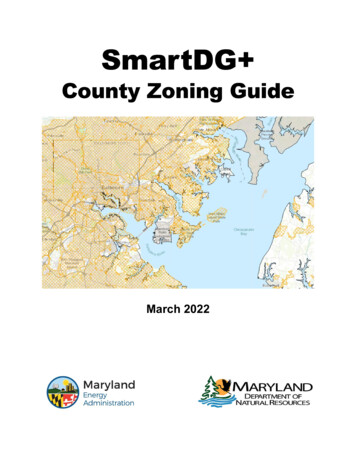
IntroductionThe Houston Department of Health and Human Services (HDHHS) has developedbaseline neighborhood health profiles in the past, which highlighted importanthealth issues facing residents. More recently, there is a growing interest in healthprofiles for population subgroups, such as by race/ethnicity, and to documentand monitor the health status of these sub-populations. Following this trend,this document presents a snapshot of information on health issues affectingHispanics/Latinos living in Harris County.conditions are exacerbated by socioeconomic factors such as low educationalattainment, language/cultural barriers, lack of access to health care, lack ofhealth insurance, and immigration status.The health of Hispanics in the U.S. is shaped by demography, disease trends, andsocial forces (Vega, Rodriguez & Gruskin, 2009).Contextual Factors that Impact HealthTremendous growth in the Hispanic population across the U.S. has been attributedto higher fertility rates and a large influx of new immigrants. Texas has a largepopulation of Hispanics and Harris County, in particular, has experienced a hugegrowth in this population.This profile uses the term “Hispanic” to refer to any person of Cuban, Mexican,Puerto Rican, South or Central American or other Spanish culture or origin,regardless of race as indicated in the Standards for the Classification of FederalData on Race and Ethnicity (Humes, Jones, & Ramirez, 2011). However, it isimportant to recognize the extensive diversity among those with Hispanic ethnicitysince cultural norms, social status and socio-demographic factors can be vastlydifferent depending in part on the region from which they originate. Hispanics canself-identify with any of the race groups.While Hispanics play a significant role in the economic, social, and culturalprogress of our county, they also face tremendous health disparities. The Centersfor Disease Control and Prevention (CDC) has listed heart disease, cancer,unintentional injuries, stroke, and diabetes as some of the leading causes of illnessand death among Hispanics. Other conditions and risk factors that significantlyaffect Hispanics include asthma, HIV/AIDS, obesity, liver disease and chronicobstructive pulmonary disease (COPD) (CDC, 2012).We have aligned the contentareas with the nationally identified health concerns of Hispanics. Some priorityissues among Hispanics, for example unintentional injuries, were not includedin the profile because either the data were not available at the local level or theburden of condition did not seem alarming in Harris County. Many of these healthSource: Dahlgren and Whitehead (1991)This profile will present information on some of the factors based on the socioecological framework depicted in the Dahlgren and Whitehead framework asshown above.According to Dahlgren and Whitehead (1991), health is impacted by many factors.These can be at the individual level (age, sex, hereditary factors, and individuallifestyle factors); at the community level (social and community networks) and ata broader level encompassing general socioeconomic, cultural and environmentalconditions (agriculture and food production, education, work environment, livingand working conditions, unemployment, health care services and housing).Changes in any or a combination of any of the above factors can have a profoundimpact on the health of a community.(Continued on next page)Houston Department of Health and Human Services Hispanic Health Profile: Houston/Harris County 20133
(Introduction continued)The profile begins with information on the broader macro-level factorsthat impact the health of Hispanics in Harris County. These are followedby factors at the community level such as social and communityin Harris County. Finally, factors related to individual and lifestyleKey Findingsbehaviors are presented.u O verall socioeconomic status (primary indicatorsnetworks and a brief discussion on other health concerns of HispanicsWherever possible, data on Hispanics in Harris County are compared withthe non-Hispanic White population, henceforth referred as to “Whites”.In some cases, data on Hispanics are unavailable at the county level,where state and national level data are presented instead. This bringsto focus the gaps in available data, the need to collect detailed healthdata at a subgroup level due to the diverse backgrounds and countryof origin of Hispanics that live in Harris County, issues in accuracy ofmortality data, underestimation and classification of Hispanic groupsin the U.S. Census present challenges in accessing accurate data tomonitor, track trends and quantify health disparities among Hispanics.The CDC’s Healthy People 2020 goals strive to achieve health equity,eliminate disparities, and improve the health of all groups by 2020(Katzmarzyk & Staiano, 2012). It is hoped that community basedorganizations, government agencies, policy makers and communitymembers will use this profile to initiate a dialogue to inform and discussbeing education, income, and occupation) ofHispanics living in Houston / Harris County is farlower than that of Whites.u H ealth conditions that need to be addressed amongHispanics include overweight/obesity and diabetesamong younger age group ( 40 years).u B ehavioral risk factors include lack of physicalactivity, unhealthy eating behaviors, binge drinking,and lack of adherence to screening behaviors.u H igh uninsurance rates result in poor healthoutcomes due to lack of access to care.u S ome quality of life indicators are also pooreramong Hispanics compared to Whites.the current health status of Hispanics in Harris County and developstrategies to address disparities. Thus, a set of recommendations ispresented at the end of each section for specific action items relevantfor individuals, organizations, and communities.4Houston Department of Health and Human Services Hispanic Health Profile: Houston/Harris County 2013
Socioeconomic, Cultural and Environmental Conditionsu Demographicsu Language Issuesu Household Characteristicsu Povertyu Educationu Occupationu Insuranceu Summary and RecommendationsHouston Department of Health and Human Services Hispanic Health Profile: Houston/Harris County 20135
Hispanic Population Growth in the U.S.U.S. Hispanics by Age and Generationin thousands he Hispanic population in the U.S. grew fromTapproximately 35.2 million people in 2000 to 50.7 millionin 2010—a 44 percent increase.Pew Hispanic Center, released June 27, 2012.The projected Hispanic population of the United States on July 1, 2050 will beSince 2000, among Hispanics, the foreign-born share of each major Hispanic132.8 million. According to this projection, Hispanics will constitute 30 percentorigin group has declined. Overall, the share of Hispanics that is foreign bornof the nation’s population by 2050.decreased from 40 percent in 2000 to 37 percent in 2010. The largest declineSource: Population projections opulation/cb08-123.html accessed on 10/10/2012.The largest single Hispanic subpopulation by origin in a state is Mexican—13 percentage points—was among Salvadorians (from 76% to 62%).Source: Pew Hispanic Center, Tabulation of 2010 ACS and 2000 Census, released June 27,2012. www.pewhispanic.orgin California at 11.8 million people. Texas is home to another 8.4 millionMexicans. Together, these two states make 61 percent of the total Mexicanpopulation in the U.S.Source: Pew Hispanic Center, re-leased June 27, 2012. www.pewhispanic.org6Houston Department of Health and Human Services Hispanic Health Profile: Houston/Harris County 2013
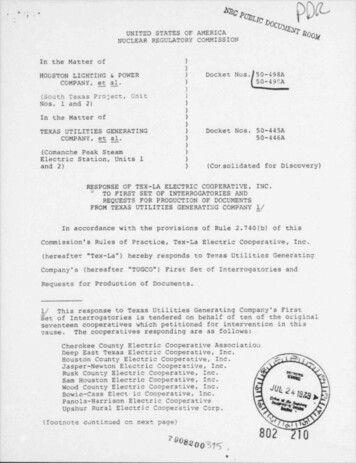
Demographic Transformation of Harris County(U.S. Census, 1960-2010)Census data show consistent growth in the Hispanic population in Harris County from 1960 to %42.5%33.4%73.9%Source: “THE CHANGING FACE OF HOUSTON: Tracking the Economic and Demographic Transformations Through 31 Years of Surveys” pg. 25.Stephen L. Klineberg. The Complete Presentation on the Survey Findings (Year 2012). Rice University Kinder Institute for Urban Research.Houston Department of Health and Human Services Hispanic Health Profile: Houston/Harris County 20137
Hispanics in Harris CountyRace and Ethnicity* in Harris CountyHispanics by Country of OriginSource: American Community Survey (ACS) 2006-2010Nationally, in 2008, 46.6 percent of the foreign-born population inHispanics constituted almost 41 percentthe U.S. was Hispanic.(1,671,540) of the population in HarrisSource: 2010 American Community Survey. http://www.census.gov/acs/County (per U.S. Census 2010) comparedto 38.1 percent of Hispanics in Texas.*Race/ethnicity is described here using datafrom the U.S. Census 2010.A majority of Hispanics living in Harris county are of Mexican origin.Central Americans make the second largest group of Hispanics inHarris County. Others come from Puerto Rico, Cuba, the DominicanRepublic, South America and other Spanish speaking regions.8Houston Department of Health and Human Services Hispanic Health Profile: Houston/Harris County 2013
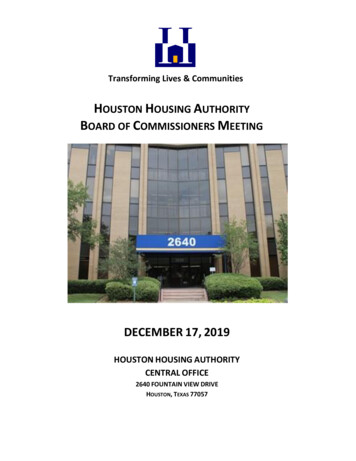
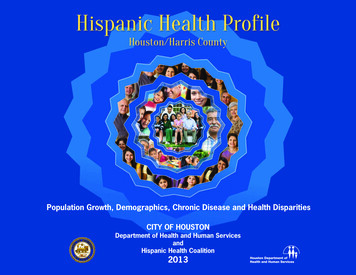
Population PyramidHispanics (Shaded) and WhitesAging AdultsThe Hispanic population isgenerally considered youngerat age and Harris County bearsthis out, with only 4 percent ofHispanics currently being 65 andover. Nevertheless, the populationof elderly Hispanics is expectedto significantly increase in thecoming decades. On average,Hispanics aged 65 and above inthe U.S. are poorer, less educatedand have higher rates of manychronic diseases than their nonHispanic counterparts. HarrisCounty does not seem to be anexception to this.Harris County Population Pyramid – U.S. Census 2010A large proportion of Hispanics in Harris County are younger in age while the White population is more mature as seen in the bulge in the shaded pyramid in the 40and younger age groups.Houston Department of Health and Human Services Hispanic Health Profile: Houston/Harris County 20139
Proportion of Hispanic Population by Census TractAll Hispanicsup to 20%Hispanics of Mexican Origin20.1% - 40%40.1% - 60%60.1% - 80%80.1% - 100%A majority of Hispanics according toa Pew study (51%), say they mostoften identify themselves by theirfamily’s country of origin; just 24%say they prefer a pan-ethnic label.Source: Pew Research tity/Source: ACS, 2006-2010Census tracts located to the north and southeast of downtown Houston have large proportions of Hispanics. Hispanics of Mexican origin mirror the same patternas that of overall Hispanics, as they comprise the majority (close to 80%) of Hispanics in Harris County.Extensive literature exists on relationships between neighborhood resources suchas social cohesion and social networks and many health outcomes. Large studiessuch as the Hispanic-Established Populations for Epidemiologic studies of the Elderly(H-EPESE) found that a concentration of certain Hispanic groups (Mexican Americans)in neighborhoods sometimes buffer the negative effects of poverty on health.Social networks promote mutual trust and norms of reciprocity that result in greatersocial cohesion. This explanation, although widely accepted, has not been conclusivelyproven. Hispanics, particularly Mexican Americans, report having a wider and deepersocial networks and more social ties than other ethnic groups. This wider socialnetwork is hypothesized to engender greater social cohesion among this group.However, in high poverty neighborhoods, it is possible that social and economicfactors overshadow the positive effects of social cohesion.10Houston Department of Health and Human Services Hispanic Health Profile: Houston/Harris County 2013
Diversity by Region of OriginHispanic Population of Central American OriginHispanic Population of South American OriginCount by Census Tract (ACS estimates 2006-2010)Count by Census Tract (ACS estimates 2006-2010)0 -1530 - 34154 - 423424 - 791792 - 14211422 - 298235 - 108109 - 210211 - 399400 - 672Source: ACS, 2006-2010Mexicans, Central Americans and South Americans are the largest Hispanic sub-populations in Harris County. More Hispanics of South American origin live in farwest Harris County than those of Central American origin; the patterns of residence based on census data indicate that these Hispanic groups are more dispersedthrough the county than are Mexican Hispanics.Houston Department of Health and Human Services Hispanic Health Profile: Houston/Harris County 201311
Spanish Speakers with Limited English Proficiency by Census TractTwenty-one percent of theHispanic population in HarrisCounty does not speak Englishwell and 12 percent do not speakEnglish at all.Language issues place Hispanicsat a disadvantage in accessingservices, employment andeducation.A Pew Hispanic Center national surveyreports that Hispanics express astrong, shared connection to theSpanish language. More than eight-inten (82%) Latino adults say they speakCount by Census Tract(Quintile Classification)Spanish, and nearly all (95%) say itis important for future generations to0 - 47continue to do so.48 - 192193 - 463464 - 926927 - 3,202Source: Pew Hispanic Center, ce: ACS, 2006-2010Limited English Proficient is defined as “individuals who do not speak English as their primary language and who have a limited ability to read, speak, write orunderstand English” .12Houston Department of Health and Human Services Hispanic Health Profile: Houston/Harris County 2013
Household TypeHispanics by Household TypeWhites by Household Typen Married-couple familyn Male Householdern Female householdern Nonfamily householdsSource: ACS, 2006-2010Smaller proportions of Hispanics live in non-family households compared to Whites in Harris County. Theproportion of female-headed households is higher among Hispanics. According to the National PovertyCenter, nationwide poverty rates are highest for families headed by single women, particularly if they areOther household information:u 5 1 percent of Hispanic households areBlack or Hispanic. In 2010, 31.6 percent of households headed by single women were poor, while 15.8“owner-occupied” compared topercent of households headed by single men and 6.2 percent of married-couple households lived in poverty.69 percent of White households(National Poverty Center, University of Michigan, http://npc.umich.edu/poverty/).u 1 6 percent of Hispanic households areCompared to Whites, fewer Hispanics own the homes they live in (Williams & Collins, 2001). Home ownershipconsidered “overcrowded” comparedis a crucial factor in wealth building and has an indirect influence on health (Cairney & Boyle, 2004).to 1 percent of White householdsHouston Department of Health and Human Services Hispanic Health Profile: Houston/Harris County 201313
Overcrowding among HispanicsHispanic Overcrowding (Percent of Hispanic Households)Count by Census Tract (ACS estimates 2006-2010)“Overcrowding” is defined by theCensus as more than one personper room in a household.According to the World HealthOrganization, overcrowding maybe a factor in poorer healthoutcomes due to greater likelihoodof transmission of infectiousdisease, increased stress, andmore respiratory diseases.Hispanic Overcrowding Relativeto that of Harris County Overall*similar to or less than Harris Countyup to 25% above Harris Countyup to 50% above Harris Countyup to 75% above Harris Countymore than 75% above Harris County* Approximately 6.6% of all occupied housingunits in Harris County are overcrowded.The majority of census tracts in Harris County reflect a high proportion of overcrowding among Hispanic households.Source: http://www.tdhca.state.tx.us/glossary.htm14Houston Department of Health and Human Services Hispanic Health Profile: Houston/Harris County 2013
Poverty by Race/EthnicityHispanics: Poverty by AgeWhites: Poverty by Agen Under 12n 12-17 yearsn 18-34 yearsn 35-64 yearsn 65 and aboveSource: ACS, 2006-2010Poverty by Race/Ethnicity Forty-eight percent of Hispanics living in poverty in Harris County are childrenunder the age of 18 years compared to 21 percent among Whites.n Whiten BlackCompared to 7 percent among White, a larger proportion of the Hispanicpopulation (26%) had incomes below the poverty level. Overall, half of the impoverished population living in Harris County are Hispanicsn Asian and Otherscompared to 10 percent Whites.n HispanicSixteen percent of Hispanic households received food stamps or other socialassistance, compared to 4 percent of White households.Source: U.S. Census 2010Houston Department of Health and Human Services Hispanic Health Profile: Houston/Harris County 201315
Hispanic Population in Poverty by Census TractIn addition to the measure “living below poverty level”,another measure of poverty that is frequently used is “lowHispanics in Poverty (Percent of Total Population)By Census Tract (ACS estimates 2006-2010)income” families. Low income is defined as “living at orbelow 200% of poverty level”. Poverty is far higher amongup to 12%12.1% - 24%24.1% - 36%36.1% - 48%more than 48%immigrant families compared to native born families. Amongimmigrant families with children, almost two-thirds (63%) ofHispanic families were low income as compared to a quarterof immigrant White families.Source: Urban htmlMany health outcomes vary by neighborhood and are alsofound to be closely related to socioeconomic status. Urbancommunities with high rates of poverty suffer from poor healthand social outcomes such as mental illness, infant mortality,youth disenfranchisement and crime (Casselman, 2012).Hispanic ParadoxDespite low socio-economic status (SES), Hispanics have lower mortality and morbidity than other groups for many health outcomes such as infant mortality andfunctional status. It is hypothesized that Hispanics, particularly certain subgroups, benefit from strong social networks characteristic of their culture. This hasbeen termed as “Hispanic Health Paradox” (Morales et al., 2002 ). Despite an acute lack of resources and social and economic challenges, the greater emotionalsupport, deep cultural values and familial solidarity of Hispanics provide a protective influence on health. The Hispanic Health Paradox is most striking amongMexican Americans, who have the lowest socioeconomic status among all the Hispanic subgroups but also have the lowest mortality rate. The Cuban Americanmortality rate is greater than that of Mexican Americans and is similar to that of non-Hispanic Whites. Cuban-Americans also have the highest socioeconomic levelsamong Hispanics, although they are still disadvantaged relative to non-Hispanic Whites. Puerto Rican Americans, on the other hand, are less advantaged than nonHispanic Whites and have a higher all-cause mortality rate. Of these Hispanic subgroups, Puerto Rican Americans appear to least exhibit the health paradox (Vegaet al., 2009).16Houston Department of Health and Human Services Hispanic Health Profile: Houston/Harris County 2013
Educational Attainment(for the population 25 years and above)Disparities in health and educational achievement are closely linked. EpidemiologicalHispanicsevidence suggests that education can increase life expectancy, reduce morbidity, decreasebehaviors that place one’s health at risk and delay decreased functioning related to aging.In Harris County nearly half (46%) of Hispanics (age 25 and above) have not completedhigh school compared to 6 percent of Whites. Similarly, the proportion of those who havecompleted Bachelor’s degree or higher is 10 percent among Hispanics compared to 43percent among Whites.The overall dropout rate for Hispanic students in Houston Independent School District(school year 2011-12) was 13.8 percent compared with 5.2 percent among White students.n Less than high school diploma“Low education rates and inadequate income translate directly into premature death,more disease, and more money spent treating avoidable illnesses. Prioritizing educationand economic opportunity is an important strategy to save lives, improve health, andreduce spending on avoidable illnesses”.-Robert Wood Johnson FoundationHispanic Health Professionals:n High school graduate, GED, or alternativen Some college or associate’s degreen Bachelor’s degree or higherWhitesAs the fastest growing minority group in the U.S., the need for Hispanic health professionalshas never been greater. With a nationwide shortage of culturally and linguistically competenthealth care professionals to treat Hispanics, there is need to recruit and train newprofessionals to fill this gap. Furthermore, with a Hispanic population exceeding 40 percentof the total Harris County population (much higher than the national average), this need ismagnified locally.Source: ACS, 2006-2010Houston Department of Health and Human Services Hispanic Health Profile: Houston/Harris County 201317
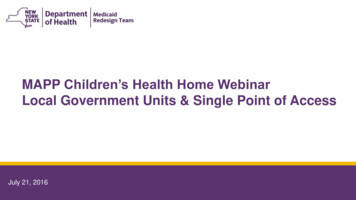
OccupationWhite by Type of OccupationHispanic by Type of Occupationn Management, business science and arts17%16%7%8%n Service occupationsn Sales and office occupations22%23%n Natural resources, construction, andmaintenance occupations22%50%26%n Production, transportation, andmaterial moving occupations9%Source: ACS, 2006-2010Only a small portion of Hispanics are employed in management, business, science and artsoccupations compared to Whites. Individuals belonging to these occupation categories aretypically better insured.Occupation is linked to life opportunities and health equity. Hispanics in Harris County represent the largest percentage of all race/ ethnicity groups that areuninsured (53%); 13 percent of Whites are uninsured. Some factors that explain the high level of uninsurance among Hispanics are working in the secondary labormarket, being economically disadvantaged, and relying on family for care especially among the elderly at later stages of life (Saenz and Rubio: 2007). Immigrantworkers, especially undocumented workers, are typically uninsured and employed among the lower rungs of occupations regardless of educational attainment fromthe home country.18Houston Department of Health and Human Services Hispanic Health Profile: Houston/Harris County 2013
Uninsured Hispanics in Harris CountyUninsured Hispanics by AgeUninsured Population by Race/EthnicityFifty-three percent of the Hispanics inHarris County had no health insurancen Under 18n 18 to 24 yearsn 25 to 34 yearsn 35 to 44 yearsn 45 to 54 yearsn 55 to 64 yearsn Whiten Blackn Asian and Othern Hispanicn 65 and Abovecoverage at the time of the 2010American Community S
2 Houston Department of Health and Human Services Hispanic Health Profile: Houston/Harris County 2013 Goals of this profile: u Depict the health of Hispanics living in Houston / Harris County. u Present information on current demographics, selected health conditions, health behaviors, and quality of life. u Highlight health disparities and identify priority areas to promote health equity.