Transcription
Bandari et al. Health and Quality of Life (2020) 18:277RESEARCHOpen AccessDevelopment and psychometric evaluationof the healthy lifestyle questionnaire forelderly (heal)Razieh Bandari1, Farahnaz Mohammadi Shahboulaghi2* and Ali Montazeri3,4*AbstractBackground: The present study was conducted to design and evaluate the psychometric properties of aquestionnaire for assessing the healthy lifestyle among older adults in Iran.Methods: First, items were generated based on a qualitative study, the literature review, and with help receivedfrom experts in gerontology and questionnaire design. Then, content validity was carried out. Accordingly, a crosssectional study was conducted to perform factor analysis and known groups comparison in order to examine theconstruct validity. Internal consistency was measured by the Cronbach’s alpha coefficient and the stability of thequestionnaire was evaluated by estimating interclass correlation coefficient (ICC).Results: In total 68 items was generated. Following development process 22 items were removed and a provisionalversion of the questionnaire with 46 items was subjected to psychometric evaluation. At this stage a sample of 390elderly people attending the community centers in Tehran, Iran were entered into the study and completed thequestionnaire. Most elderly were female (52.8%) and the mean age of participants was 67.97 (SD 7.77) years. Afterperforming factor analysis, overall 10 items were removed due to low loading and the questionnaire was reducedto 35 items tapping into eight factors, which explained a total of 57.1% of the variance. In addition, the resultsobtained from known groups comparison indicated that the questionnaire well differentiated among participantswho were differed in self-reported health condition. The Cronbach’s alpha coefficient showed excellent internalconsistency (alpha 0.89). The intraclass correlation coefficient also indicated a good stability for the questionnaire(ICC 0.94).Conclusion: The healthy lifestyle questionnaire for elderly (Heal) can be used as a simple and an easy-to-use validand reliable measure in determining healthy life style and the frequency of health-oriented activities among olderadults.Keywords: Elderly, Healthy lifestyle, Psychometric, Development, Validity, Reliability* Correspondence: mohammadifarahnaz@gmail.com; montazeri@acecr.ac.ir2Full Professor of Iranian Research Center on Aging, Nursing Department,University of Social Welfare and Rehabilitation Sciences, Tehran, Iran3Mental Health Research Group, Health Metrics Research Centre, IranianInstitute for Health Sciences Research, ACECR, Tehran, IranFull list of author information is available at the end of the article The Author(s). 2020 Open Access This article is licensed under a Creative Commons Attribution 4.0 International License,which permits use, sharing, adaptation, distribution and reproduction in any medium or format, as long as you giveappropriate credit to the original author(s) and the source, provide a link to the Creative Commons licence, and indicate ifchanges were made. The images or other third party material in this article are included in the article's Creative Commonslicence, unless indicated otherwise in a credit line to the material. If material is not included in the article's Creative Commonslicence and your intended use is not permitted by statutory regulation or exceeds the permitted use, you will need to obtainpermission directly from the copyright holder. To view a copy of this licence, visit http://creativecommons.org/licenses/by/4.0/.The Creative Commons Public Domain Dedication waiver ) applies to thedata made available in this article, unless otherwise stated in a credit line to the data.
Bandari et al. Health and Quality of Life Outcomes(2020) 18:277BackgroundSince the beginning of the twenty-first century, improved living conditions and life expectancy have resulted in an increase in the population of older adultsworldwide. For instance, it has been reported that between 2015 and 2030 the older population in lowermiddle income countries will increase by 66% and thatin low-income countries will grow up by 63% [1]. However, as far as it relates to Iran, the official statistics indicates that the population of older adults is increasingsteadily. At present about 10% of the population of Iranare aged 60 and over [2, 3].Owing to the accelerated phenomenon of populationaging in Iran as in other countries, demographic conditions are changing and moving toward aging and its resultant consequences [4]. These changes will most likelylead to important economic, health, and social challenges, and a growing prevalence of chronic conditionswill increase the need for health improvement interventions by healthcare providers as well as family membersand communities. It must be noted that modificationand improvement of lifestyle are important prerequisitesfor maintaining good health [5] Given the growth inchronic conditions and, based on the health promotionapproaches, people must be empowered to accept responsibility for their own health and adopt a healthy lifestyle [6].A healthy lifestyle with the multidimensional nature iscrucial, as it can influence the quality of life, illness management, and prevent diseases [7]. A healthy lifestylemeans having a balanced life in which an individual consciously makes healthy choices and takes special measures such as following a healthy diet, striking a balanceamong sleep, activity, and exercise, controlling weightand stress, abstaining from smoking and consuming alcohol, and getting oneself immunized against diseases[8]. However, though lifestyle is formed by personalchoices and identities, it cannot be analyzed in isolationof its social and cultural contexts. It means the personal,biological and psychological characteristics of the individual, family, friends, and social community affect theindividual’s daily life and lifestyle [9].As there seems to be a triangular relationship betweenaging, chronic conditions, and healthy life style, the assessment of attitudes and behaviors of the elderly towarda certain lifestyle can offer information to healthcareproviders to evaluate elders’ way of living and accuratelydesign appropriate preventive interventions, enhance thecapabilities of the elderly, and modify their lifestyle in anacceptable manner if necessary.Assessment of the lifestyle of older people requires accurate tools for measuring health-related behaviors. Although there are numerous instruments for themeasurement of lifestyle in Western communities,Page 2 of 9differences in social and cultural contexts, especially theethnic backgrounds [9] and educational levels of olderadults [10], might cause some limitations to their use inother communities such as Iran, where more than twothirds of the elderly people are either illiterate or less educated [11]. Additionally some existing instruments onlymeasure special lifestyle aspects for example, stress management, nutrition or exercise and do not have comprehensive approach to measuring healthy lifestyles.Among existing instruments, the Health EnhancementLifestyle Profile (HELP II), as a common multidimensional tool, has been applied in most lifestyle studies [12,13]. The Iranian version of this questionnaire has beendeveloped and mainly is used for young people [5, 8,14–17].Considering the limitations of using the existing toolsin older adults, Eshaghi et al., in 2010, designed aHealthy Lifestyle Assessment Questionnaire for Iranianolder adults. This questionnaire was designed based on areview of available tools, relevant texts, and interviewswith Iranian elderly population. It includes 46 Likerttype questions, which are designed to assess physical activity, sport and recreation, healthy eating, stress management, and social and interpersonal relationships inolder adults [18]. This questionnaire is long and the response categories are very diverse and sometimes couldbe difficult to understand and respond to its items byelders.According to Haywood et al., despite the presence ofnumerous instruments, it still is necessary to design anddevelop appropriate specific tools for screening andmonitoring the health status and lifestyle of the elderlypopulation. They argue that such tools must be simple,comprehensible, and easily applicable especially in clinical settings. In addition, as they should be more acceptable for and focused on the status of the elderly, theyshould be able to monitor and evaluate the changes inthe elderly health status more precisely [18]. Spenceret al. believe that the evaluation of the health status ofthe elderly by the use of short questions and withoutclinical computation will facilitate the assessment oftheir health status and provide more valid and reliabledata not only for healthcare providers but also for researchers [19].Indeed, the nature of the aging process, some abilities,such as the loss of hearing, vision, concentration, andmemory decline in older adults, can lead to problems ineffective communication. Such problems make it difficult to use instruments with long and unclear statementsfor questioning older people. Given the lack of an appropriate tool to study the healthy lifestyle of the elderlypopulation, it seems necessary to design instruments ofacceptable validity and reliability that would be consistent with norms and social contexts, and be simple and
Bandari et al. Health and Quality of Life Outcomes(2020) 18:277Table 1 The characteristics of study participants (n 390)Number (%)GenderMale185 (47.4)Female205 (52.6)Age group (years)60–70271 (69.4)71–80103 (26.4)80 16 (4.2)Educationaleasily applicable, especially to illiterate elders. Accordingly, the present study was designed to develop a questionnaire to study healthy lifestyles among older adultsand evaluate its validity and reliability.MethodsThis was a methodological study. The study was carriedout in four phases. These are described as follows:Item generationIlliterate32 (8.2)Primary154 (39.4)Secondary116 (29.8)Higher88 (22.6)Marital statusMarried265 (68.0)Single10 (2.6)Widowed108 (27.6)Divorced7 (1.8))Employment statusHousewife137 (35.0)Employed27 (7.0)Retired226 (58.0)Number of children019 (4.8)1–3176 (45.2)4–6174 (44.6) 721 (5.4)Living conditionAlone80 (20.6)With spouse118 (30.2)With children46 (11.8)With family142 (36.4)Others4 (1.0)Economic statusPoor82 (27.0)Intermediate162 (41.6)Good146 (31.4)HousingOwnerPage 3 of 9310 (79.6)Tenant71 (18.20Children’s home5 (1.2)Relative’s home4 (1.0)Health statusIn order to generate items for the questionnaire a reviewof the literature, and a qualitative study was conductedto form the concept of a healthy lifestyle for elderly.1. Review of the literature: A purposeful electronicsearch was carried out using PubMed’ search engine andthe ‘Science Direct’ portal. Articles with keywords including psychometric evaluation, measurement, healthylifestyle, elderly, aging, old, and health behaviors wereretrieved in order to develop the concept and to generate items for the questionnaire.2. Qualitative study: Semi-structured interviews wereconducted to elucidate determinates of healthy life styleamong elderly as perceived by experts and elderly people.In doing so eleven experts (nurses, physiotherapists, occupational therapists, general practitioners, psychiatrists,psychologists and gerontologists) and sixteen older adults(8 men and 8 women) aged 60–75 shared and discussedtheir experiences on strategies to maintain and improvehealth among elderly seniors. Purposive sampling withmaximum variance (age, marital status, education, socioeconomic backgrounds and living conditions) was used tochoose elderly participants from members of elderlyhealth clubs affiliated to the Tehran municipality liveningin different districts of the city. Each interview lasted forabout 45 to 70 min and was recorded and immediatelytranscribed verbatim. The transcribed text was read several times, and the codes were extracted [20].3. Item pool: A total of 68 items were generated fromthe above-mentioned procedures. Of these, 21 itemswere derived from the literature review, 20 items derivedfrom expert interviews and 27 items extracted from interviews with older people.Item reductionPoor/Very poor153 (38.2)Fair174 (43.2)Very good/Good63 (15.6)History of the diseaseYes149 (49.8)No241 (50.2)At this stage the research team evaluated items andmerged the expressions with overlaps, and excluded thoseitems that seemed irrelevant to healthy life style. Thus theinitial version of the questionnaire with 55 items was subjected to the further item reduction process.Content validity: The objective of content validity wasto determine the degree to which the questionnaire wasable to measure the intended concept under evaluation[21]. To do so, we used both qualitative and quantitativemethods and asked 15 psychometrics, gerontology,
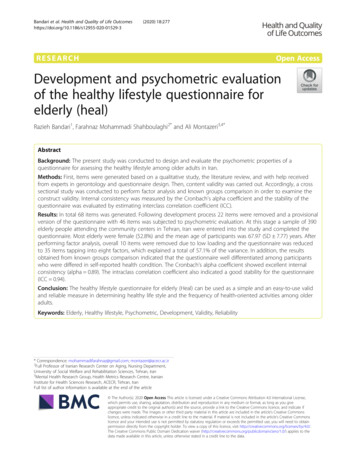
Bandari et al. Health and Quality of Life Outcomes(2020) 18:277Page 4 of 9Fig. 1 A scree plot illustrating the factor loading of the healthy lifestyle questionnaire for elderly (Heal)public health and geriatrics to evaluate the items. Firstthe experts were asked to assess the questionnaire basedon grammar, wording, the right placement of items, aswell as the right scoring, and provide the necessary feedback. Then, the quantitative content validity was performed by estimating the content validity ratio (CVR)and the content validity index (CVI). Regarding theCVR, the experts were asked about the necessity of eachitem, and a CVR value of 0.45 was considered acceptable [22]. Regarding the CVI, the criteria of relevance,clarity, and simplicity of the items were assessed and aCVI value of 0.79 was considered acceptable. As a result at this stage 9 items were removed and theprovisional version of the questionnaire with 46 itemsmade ready for pre-test evaluation without any prior assumptions or considering a theoretical model.Pre-testTo determine initial internal consistency, the Cronbach’salpha coefficient of the elderly healthy lifestylequestionnaires was calculated. As such a pilot sample of60 elderly people completed the questionnaire and theCronbach’s alpha coefficient was found to be 0.90. Thenanother sample of twelve elderly people completed thequestionnaire. They were asked to comment on comprehensibility, relevance, and ambiguity. They all receivedthe questionnaire well and indicated that it was easy tounderstand and they did not have any difficulties tocomplete the questionnaire.Psychometric evaluation1. Design and participants: A cross sectional study wasconducted in Tehran, Iran in order to evaluate the psychometric properties of the Healthy Life Style for Elderly(Heal) questionnaire. Using the random samplingmethod, a total of 390 eligible elderly people were selected from members of the elderly health clubs affiliatedto the Tehran municipality. For this purpose, Tehranwas divided into five regions: north, south, east, west,and the central part. Then, from each region two clubs
Bandari et al. Health and Quality of Life Outcomes(2020) 18:277Page 5 of 9Table 2 Exploratory factor analysis of the healthy lifestyle questionnaire for elderly (Heal)F1F2F3F4F5F6F7F81. How often do you spent time on personal hygiene activities such as brushing teeth, washinghands and face, trimming nail, etc.?0.72 0.32 0.22 0.20 0.410.35 0.49 0.142. How often do you take a bath or take a shower?0.78 0.16 0.12 0.25 0.340.49 0.21 0.493. How often do you buy the things you need, independently?0.34 0.51 0.19 0.32 0.040.03 0.21 0.024. How often do you cook or prepare a food to eat (Or help someone else to do this for you)?0.03 0.93 0.21 0.10 0.030.01 0.06 0.025. How often do you clean your home or give it a tidy?0.16 0.91 0.28 0.16 0.140.07 0.06 0.066. How often do you walk at least for 20–30 min per day?0.06 0.03 0.60 0.21 0.200.02 0.05 0.067. How often do you exercise or play sports other than walking?0.21 0.09 0.74 0.32 0.200.01 0.09 0.0129. How often do you eat white meat (poultry, fish, chicken, etc.)?0.03 0.09 0.11 0.68 0.160.02 0.08 0.1010. How often do you use liquid oils for cooking?0.06 0.10 0.12 0.51 0.160.02 0.12 0.1112. How often do you eat raw vegetables (vegetables, salad, lettuce, etc.) or cooked vegetables(squash, eggplant, etc.)?0.20 0.20 0.01 0.58 0.020.17 0.21 0.1213. How often do you eat fresh fruits?0.12 0.24 0.30 0.66 0.270.15 0.18 0.1614. How often do you consume foods containing calcium (Like milk, cheese, yogurt, orange,cabbage, etc.)?0.02 0.18 0.21 0.69 0.140.11 0.17 0.1216. How often do you add salt to your food at the table?0.01 0.13 0.14 0.66 0.240.10 0.20 0.1219. How often do you eat complete breads with whole grain?0.34 0.02 0.02 0.48 0.050.08 0.19 0.120.04 0.11 0.1320. How often do you drink at least eight glasses of water a day?0.22 0.31 0.08 0.62 0.1721. How often do you feel satisfied with your night’s sleep?0.09 0.24 0.03 0.04 0.69 0.02 0.08 0.1222.How often do you go to bed at night on time?0.32 0.24 0.08 0.03 0.62 0.04 0.08 0.1124. How often can you control your anger and anxiety?0.19 0.03 0.09 0.14 .0.64 0.09 0.11 0.0125. How often do you try to get rid of sorrow and depression?0.09 0.24 0.16 0.20 0.72 0.02 0.16 0.1440.How often do you entertain yourself (for instance through gardening, making handcrafts,0.05 0.11 0.05 0.20 0.77 0.04 0.11 0.02studying newspaper or book, playing chess, weaving, watching television, listening to radio, etc.)?26. How often do you avoid tasks that are potentially harmful for you (lifting heavy objects,going up and down stairs too frequently, going up a ladder or a seat, etc.)?0.09 0.10 0.21 0.16 0.210.42 0.30 0.0828. How often do you take the medication prescribed by your doctor on a regular basis?0.18 0.15 0.14 0.16 0.170.49 0.13 0.0131. How careful are you to maintain a healthy weight?0.03 0.14 0.06 0.02 0.130.66 0.17 0.2232. How often do you follow health and hygiene instructions (so that you don’t get sick)?0.09 0.06 0.12 0.04 0.150.70 0.17 0.2233. How often do you visit a doctor for check-ups?0.30 0.12 0.07 0.14 0.080.66 0.10 0.0634. How often do you monitor your level of blood sugar, fat, or blood pressure?0.33 0.37 0.03 0.24 0.270.71 0.43 0.0235. How often do you care about safety standards to prevent falls, burns, injuries, slipping in theshower and toilet, etc.?0.13 0.29 0.11 0.05 0.240.52 0.06 0.0639.How often do you smoke cigarettes or other tobacco products (tobacco, pipe, hookah, etc.)?0.19 0.10 0.07 0.17 0.110.58 0.23 0.3036.How often do you meet your friends and family?0.16 0.19 0.09 0.07 0.100.21 0.80 0.1037.How often do you talk on the phone with relatives and friends?0.25 0.13 0.16 0.18 0.080.26 0.85 0.2141.How often do you perform religious activities (like pray, reading prayer and religious books,visiting religious places, shrines, mosque, church, etc.)?0.17 0.07 0.10 0.11 0.090.07 0.16 0.5943. What times do you feel satisfied with your life?0.16 0.13 0.13 0.06 0.040.05 0.28 0.6744. How often do you try to achieve your dreams and goals?0.15 0.23 0.02 0.27 0.070.17 0.04 0.6045. What times do you rely on God (or super power)?0.13 0.11 0.09 0.01 0.060.23 0.10 0.6646. What times do you expect a good future?0.08 0.01 0.04 0.09 0.080.03 0.12 0.798: How often do you eat red meat (beef, mutton, lamb .)?0.04 0.10 0.09 0.09 0.150.06 0.16 0.2911: How often do you use solid, animal, butter or tail oil to cook food?0.05 0.13 0.05 0.03 0.190.01 0.02 0.2715: How often do you eat fatty foods (butter, cream, offal, sandwiches, pizza .)?0.04 0.01 0.13 0.10 0.180.06 0.12 0.0117: How often do you eat dried fruits and nuts (almond and pistachio kernels, hazelnuts, seeds.)?0.33 0.02 0.08 0.04 0.050.11 0.01 0.09
Bandari et al. Health and Quality of Life Outcomes(2020) 18:277Page 6 of 9Table 2 Exploratory factor analysis of the healthy lifestyle questionnaire for elderly (Heal) (Continued)F1F2F3F4F5F6F7F818: How often do you consume sweets (sweeter, creamy, dry, candy, candy, etc. sweet syrup .)?0.16 0.08 0.06 0.06 0.100.04 0.08 0.0923: How often do you feel tired?0.04 0.090.21 0.230.09 0.04 0.0327: How often do you get enough rest?0.01 0.05 0.25 0.10 0.120.11 0.02 0.1029: How often do you take painkillers (acetaminophen, ibuprofen, gelofen, etc.) for body aches?0.25 0.02 0.02 0.03 0.050.18 0.04 0.0430: How often do you take supplements such as vitamins, iron pills, calcium, fish oil, etc.?0.11 0.06 0.15 0.17 0.150.01 0.09 0.2938: How often do you participate in group and volunteer work in your neighborhood, such as:religious delegations, public meetings of buildings or apartments, solving neighborhoodproblems, helping neighbors, and so on?0.05 0.15 0.07 0.17 0.120.08 0.01 0.2742: How often have you used traditional therapies such as herbal decoctions (oxtongue, cupping, 0.07 0.02 0.04 0.13 0.06herbal extracts (mint extract, pussy extract .), massage, acupuncture .?0.05 0.04 0.01Eigenevalue9.49 8.43 8.33 6.78 6.596.19 6.19 5.14% variance8.56 2.47 1.49 1.80 1.751.47 1.29 1.27F1: Personal health and hygiene, F2: Performing life tasks independently, F3: Exercise, F4: Nutrition, F5: Mental Health, F6: Safety and health advice, F7: Social &family relationships, F8: Spirituality and religious practicewere randomly selected. Again, random sampling was applied to select the elderly from members of each of theclubs, based on the table of random numbers. The inclusion criteria for including samples in the study were as follows: being aged 60 and older, no hearing and visiondeficit as per self-reports, no cognitive decline (obtaining ascore of seven or higher in the Iranian Version of the Abbreviated Mental Test) [23], and willingness to participatein the study. The sample size was estimated based on therequired samples that needed for the factor analysis [24].2. Construct validity: The following procedures wereapplied to examine the construct validity.2.1 Structural validity: In order to test and determinethe structural validity of the questionnaire, exploratoryfactor analysis was performed.2.2 Known-groups comparison: Known-groups comparison was used to determine the extent to which thequestionnaire was able to distinguish among differentsubgroups of particpants who differed in health status.Health status was measured using a self-reported singleitem that rated on a five point likert scale.3 Reliability of the questionnaire: Reliability was measured by examining internal consistency and test-retest reliability. For the purpose of test-retest reliability asubsample of 30 elderly completed the questionaire twciewith a two-weeks interval. It was insured that in the interim period between the two administrations the samples’health-related lifestyle and behaviors did not change.Statistical analysisThe Shapiro-Wilk test was performed to assess data normality. Descriptive statistics were used to create an overview of the sample characteristics. Psychometricevaluation was performed several statistical procedures.The maximum likelihood approach, and varimax rotation was used to examine the structural validity. The adequacy of sample size was assessed using KMO statistic,which should be at least 0.06, and by Bartlett’s test ofTable 3 Comparison of the mean row scores of healthy lifestyle questionnaire for elderly by health status (the known-groupscomparison)Very good/Good (n 153)Fair (n 174)Poor/Very poor (n 63)Mean (SD)PMean (SD)Mean (SD)Personal health and hygiene8.96 (0.82)8.88 (0.78)8.78 (0.96)0.05Performing life tasks independently10.75 (2.92)10.58 (3.01)9.79 (3.04)0.01Sport6.92 (1.92)6.40 (1.90)5.66 (1.94).0001Nutrition30.09 (4.10)29.38 (3.48)27.76 (4.27)0.001Mental Health18.85 (3.16)18.63 (3.12)18.01 (3.29)0.03Observing safety and health advice31.30 (4.06)31.09 (3.40)30.26 (3.81)0.03Social and family relations8.67 (1.33)8.32 (1.32)7.69 (1.47)0.0001Spiritual and religious activities21.09 (4.11)20.40 (3.52)17.46 (3.70)0.0001Total scale133.34 (13.99)133.73 (11.86)125.46 (13.14)0.0001
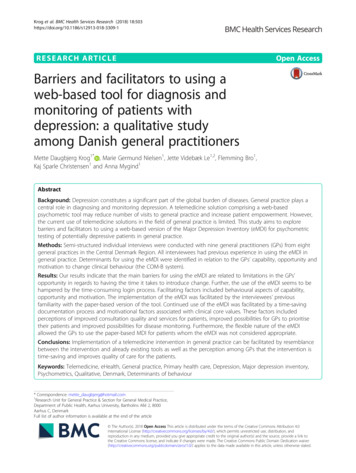
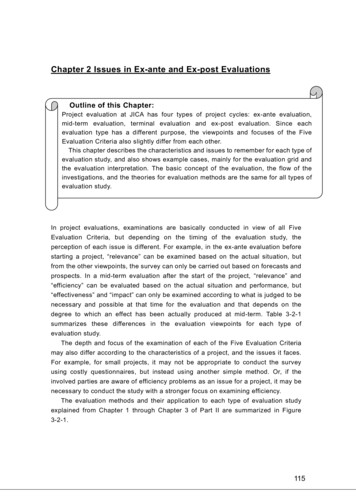
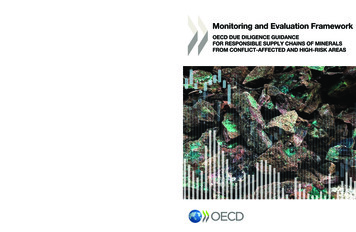
Bandari et al. Health and Quality of Life Outcomes(2020) 18:277Page 7 of 9Table 4 The Cronbach’s alpha and the Intraclass Correlation Coefficients (ICC) for healthy lifestyle questionnaire for elderly (Heal)Number of itemsCronbach’s alphaInterclass correlation coefficient (95% CI)Personal health and hygiene20.870.90 (0.90–0.93)Performing life tasks independently30.970.98 (0.99–0.99)Sport20.950.98 (0.99–0.99)Nutrition80.700.83 (0.76–0.94)Mental Health, sleep and rest50.730.99 (0.99–0.99)Observing safety and health advice80.710.91 (0.84–0.95)Social and family relations20.780.80 (0.68–0.91)Spiritual and religious activities50.930.97 (0.91–0.92)Total350.890.94 (0.88–0.97)sphericity, which should be statistically significant [25,26]. Items were considered for deletion if loadings onany of the components were less than 0.4 [27, 28]. Usingthe one-way analysis of variance (ANOVA) with Bonferroni method for post hoc the life style score among different sub-groups of sample was compared to assessknown-groups validity. Reliability was measured byexamining internal consistency and test-retest reliability.Internal consistency was assessed using the Cronbach’salpha coefficients (α) and values of 0.70 or above wereconsidered satisfactory [3]. Test-retest reliability was estimated by calculating the intraclass correlationcoefficient-ICC (two-way mixed effects model, singlemeasure) and values of 0.75 were thought acceptable [3].ResultsQuestionnaire developmentThe healthy lifestyle questionnaire for elderly (Heal) wasdeveloped based on a robust methodological procedure.The results obtained from pre-test showed that thequestionnaire received well and almost all participants inthis stage (n 12) indicated that the questionnaire waseasy to understand, and they could rate the items easily.A few participants suggested it would be better to printthe questionnaire in a larger font. However, after performing factor analysis the final questionnaire contained35 items. Each item is rated on a 5-point Likert scale (always, most of the time, sometimes, rarely, never). Therow score for the questionnaire ranges from 35 to 175,which with a simple linear transformation could be converted to 0 to 100, where the higher scores indicate better healthy life style.The main study: participantsIn all 390 elderly took part in the study. Of these 205(52.4%) were female, 68.0% (n 365) were married, and58% were retired. Most participants reported that theyare living with family (36.4%) and indicated themselvesas having intermediate economic status (41.6%). Thecharacteristics of the participants are shown in Table 1.Structural validityThe KMO value was found to be 0.85. In addition, theBartlett’s test for Sphericity had a value of 4425.38, andwas significant at 0.0001 level. The latent factors wereextracted using the maximum likelihood estimation andthe varimax rotation. Based on the results obtained fromfactor analysis, since the factor loading of 10 items wasless than 0.4, thus these were removed and the questionnaire was reduced to 35 items. However, eight factorswere extracted, based on eigenvalues above 1 and thescree plot (Fig. 1). As shown in Table 2, the factorsjointly explained 57.1% of the variance observed.Known groups comparisonThe results obtained from one-way analysis of varianceshowed that the Heal was able significantly differentiateamong subgroups of elders who were differed in healthstatus. Those elderly who reported as having very goodor good health significantly scored higher on all subscales of the healthy lifestyle questionnaire (P 0.005).The results are presented in Table 3.ReliabilityThe Cronbach’s alpha coefficient was calculated for thewhole questionnaire as well as for each factor. TheCronbach’s alpha coefficients ranged from 0.70 to 0.97;well above acceptable threshold. The alpha coefficientfor the scale as a whole was 0.89. The ICC was 0.94;reflecting a good test-retest reliability (Table 4).DiscussionHealthy lifestyle is a multidimensional concept that hasbeen discussed in the literature for many years and several studies have been carried out to investigate how tomeasure it. The purpose of this study was to design andpsychometrically appraise an instrument to measure thehealthy lifestyle among elderly papulation. It is generallybelieved that a healthy lifestyle is a way of life that reduces the risk of diseases and reduces premature deaths.In fact, the concept could be determined by people’s
Bandari et al. Health and Quality of Life Outcomes(2020) 18:277patterns of behavior and as a characteristic of a balancedlife [29]. On the other hand, it is also could be affectedby social factors. Thus, it can say that, lifestyle is a complex interaction between different physical and psychological factors. To achieve this the initial items for thecurrent questionnaire were originated and developedbased on data from a qualitative study and review of theliterature.The validity of the questionnaire was assessed usingfactor analysis. Eight domains were identified. The context of these eight domains (personal health and hygiene,performing life tasks independently, sport, nutrition,mental health, observing safety and health advice, socialand family relations, spiritual and religious activities)was consistent with the theoretical foundation and structure defined for healthy lifestyle for elderly. These eightdomains explained 57.1% of the cumulative variance observed in the results. However, one should note that thequestionnaire might not be relevant to clinical settingsalthough it might help clinicians to assess the extent towhich elderly populations adhere to clinical and medicaladvice and treatment.The results from the psychometric assessment indicated that the questionnaire had a suitable reliability.The Cronbach’s alpha for the subscales ranged from0.70 to 0.97, showing a good internal consistency for thequestionnaire. Tes
13]. The Iranian version of this questionnaire has been developed and mainly is used for young people [5, 8, 14-17]. Considering the limitations of using the existing tools in older adults, Eshaghi et al., in 2010, designed a Healthy Lifestyle Assessment Questionnaire for Iranian older adults. This questionnaire was designed based on a