Transcription
African Journal of AgriculturalResearchVol. 8(49), pp. 6529-6536, 19 December, 2013DOI: 10.5897/AJAR12.921ISSN 1991-637X 2013 Academic Journalshttp://www.academicjournals.org/AJARFull Length Research PaperGenetic diversity in soybean genotypes under waterstress and normal condition using factor analysis andcluster analysisSarkaut SalimiIslamic Azad University, Mariwan Branch, Mariwan, Iran.Accepted 4 December, 2013To study the relationships between morphological characters of soybean plant an experiment wasconducted in randomized complete blocks design (RCBD) in two replications under drought stresscondition at Agricultural College of Guilan University in 2008. Result of analysis of variance showedthat there was significant difference among the studied soybean genotypes in the majority of traits. Theresult of factor analysis in under water stress condition showed that 7 independent factors forcharacters to explain 86.4% variation of all data and under normal condition 5 independent factors forcharacters to explain 82% variation of all data. A similarity factor was constructed using UPGMAmethod for morphological characters varieties were classified into 8 groups for water stress conditionand 4 groups for normal condition. Classifying the results of the cluster analysis identified Hamiltongenotype suitable for sown in water stress condition and majority genotypes suitable for sown innormal condition.Key words: Cluster analysis, factor analysis, genetic diversity, normal condition, soybean, water stress.INTRODUCTIONSoybean seed is a major source of high-quality proteinand oil for human consumption (Katerji et al., 2001). Theunique chemical composition of soybean has made it oneof the most valuable agronomic crops worldwide(Thomas et al., 2003). Its protein has great potential as amajor source of dietary protein. The oil produced fromsoybean is highly digestible and contains no cholesterol(Essa and Al-ani, 2001). Genetic diversity analysisreveals genetic backgrounds and relationships ofgermplasm, and also provides strategies to establish,unitize, and manage crop core collections (BrownGuedira et al., 2000; Roussel et al., 2004). Soybeangenetic diversity and relationships can be assessed bythe differences in morphological and agronomic traits,pedigree information, geographic origins, isozymes andDNA markers (Dong et al., 2004; Guan et al., 2010;Wang et al., 2010). The importance of genetic diversity inE-mail: sarkaut1983@gmail.com.plant breeding is obvious from the results obtained indifferent crops (Ghafoor et al., 2001; Smart, 1990;Upadhyaya, 2003; Upadhyaya et al., 2002). Water stressis considered one of the most important factors limitingplant performance and yield worldwide (Boyer, 1982).Water stress during reproductive development oftendecreases the seed size in soybean (Kadhem et al.,1985; Momen et al., 1979; Sionet and Kramer, 1977).Waterlogging is defi ned as prolonged soil saturation withwater at least 20% higher than the field capacity(Aggarwal et al., 2006). Increasing soil water deficiencycorrelated with reduction in dry matter accumulation(Lopez et al., 1996; Lazcano-Ferrat and Lovatt, 1999;Grieu et al., 2001). The best option for crop production,yield improvement and yield stability under water stressconditions is to develop water tolerant crop varieties. Oneof the main goals in breeding programs is selection of the
6530Afr. J. Agric. Res.Table 1. Used genotypes.S/N12345678910GenotypesLine 33HillUnionBpHamiltonStresllandWilliamsTnh 56DpxWilliams 82Origin /N111213141516171819GenotypesZaneHackDw2Line 32ClarkGorgan 3TalarCenturyLine 17Origin (country)IranIranIranIranIranIranIranIranIranTable 2. Analysis of variance (RCBD) for studied heightns0/0130/031ns0/0328/64Numberof 3/98Numberof Seedon Podns0/0120/029ns0/038/49MSNumberof seedon /3710/317/96Day to50%floweringns1/28170/21**0/342/42Day 1/1917/83*,** Significantly different at 5 and 1% probability level respectively; ns, non significant.best genotypes under water stress conditions. Insufficientwater, especially during emergence, flowering and podfilling stages lower the yield of soybean (Abayomi, 2008).Optimally supplying water during different growth stagessuch as the early of growth season, flowering, pod set,and grain–filling improves crop yield and quality; andplants need more water from flowering to onset of grain–filling than any other times (Speeht et al., 2001). Narjesiet al. (2007) reported that 5 independent factors forcharacters 30 soybean genotypes to explain 80.2%variation of all data. The first factor alone 22.54 of thedata changes can be justified and called the phonologicalproperties. (Arshad et al., 2006) showed that clusteranalysis the genotypes divided in 3 groups. The firstgroup was involved 14 genotypes, second group 33genotypes and third group involved 11 genotypes. Theobjectives of this study are to evaluate the geneticdiversity of soybean cultivar using factor analysis andcluster analysis, to analyze and characterize populationstructure within soybean cultivars and compare effecttraits on grain yield under water stress and normalcondition.MATERIALS AND METHODSThe present study was conducted to evaluate the effects of waterstress and normal condition on soybean genotypes. To study therelationships between morphological characters of soybean plantan experiment was conducted in randomized complete blocksdesign (RCBD) with two replication sat water stress conditions andnormal condition at Agricultural College of Guilan University, Iranduring 2008. The material consisted of 19 soybean genotypes(Table 1). The seeds sown in the spring season and genotypeswere grown in two row plots, each plot included four ridges, andeach ridge was 3.5 m in length and 50 cm apart. Agronomiccharacteristics were including plant height, number of pod, leafarea, number of seed on pod, number of seed on plant, 100 grainweight, day to 50% flowering, day to maturity and grain yield. Datawere recorded on 5 competitive plants of each plot and grain yield(kg/ha ) was calculated for the entire plot. Data were statisticallyanalyzed using ANOVA appropriate for RCBD with SAS ver. 9.1and factor analysis and cluster analysis using SPSS 16 software’s.RESULTS AND DISCUSSIONResult of analysis of variance (Table 2) showed that therewere significant differences among the studied soybeangenotypes for yield and component yield traits. Thisillustrates the high potential of these genotypes to use thegenetically source for breeding purposes.Factor analysisFactor analysis based principal component analysis andafter varimax rotation under water stress condition
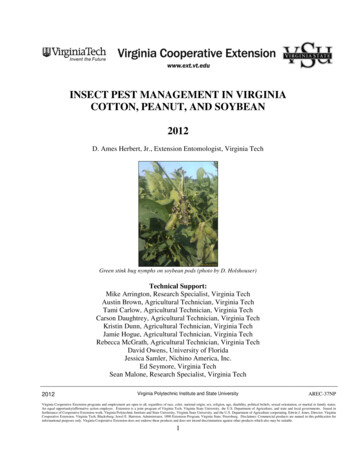
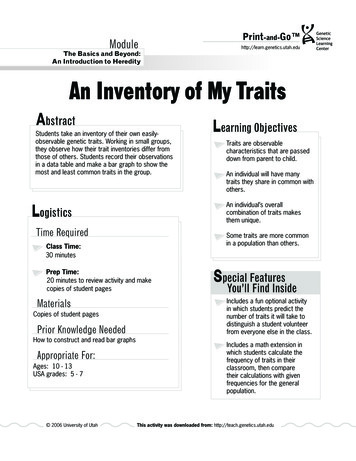
Salimi6531Table 3. Factor analysis of studied traits under water stress condition.ParameterEigen valuesCumulative Eigen valuesProportion of varianceCumulative /48969/339PC51/95216/46612/99182/331TraitsPlant heightNumber of podLeaf areaNumber of seed per podNumber of seed per plant100 grain weightDay to 50% floweringDay to maturitygrain yieldOil contentProtein /6780/128-0/169-0/241-0/309-0/3440/1050/132Table 4. Factor analysis of studied traits under normal (non stress) condition.ParameterEigen valuesCumulative Eigen valuesProportion of varianceCumulative 10/02377/635PC71/12817/2948/83386/468Traitsplant heightNumber of podLeaf areaNumber of seed per podNumber of seed per plant100 grain weightDay to 50% floweringDay to maturitygrain yieldOil contentProtein 4-0/0280/128showed (Table 3) that 7 independent factors forcharacters to explain 86.4% variation of all data. The firstfactor because of high day to 50% flowering and day tomaturity alone 15.68% of the data changes can bejustified and called the phonological factor properties.The second factor because high number of seed perplant and protein content was called quality factor andalone 14.89% of the data changed can be justified andtotal 86.4% variation of all data under water stresscondition. Factor analysis under normal (non stress)condition showed (Table 4) that 5 independent factors forcharacters to explain 82% variation of all data. The firstfactor because of high plant height, 100 grain weight andDay to 50% flowering alone 26.17% of the data changescan be justified and called yield and yield componentfactor properties. The second factor because high oilcontent was called quality factor and alone 15.3% of thedata changed can be justified and total 82% variation ofall data under normal condition (non stress) condition.Figures 1 and 2 showed projection of the agromorphological and seed quality traits on the planesdefined in water stress and normal condition by principal
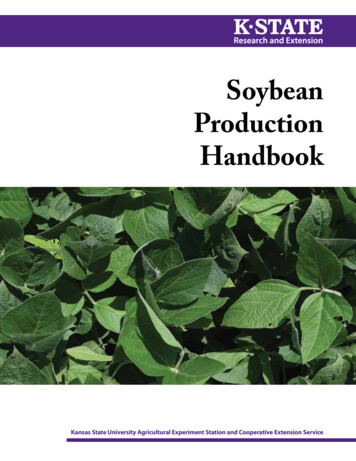
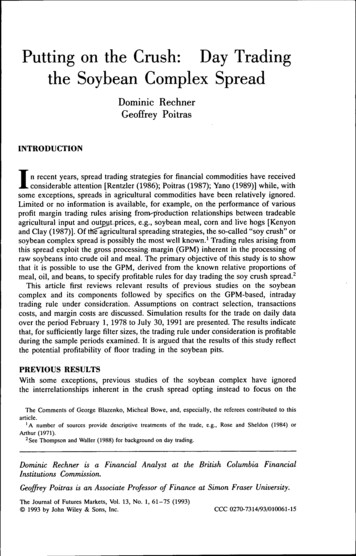
Afr. J. Agric. Res.Second factor6532First factorSecond factorFigure 1. Plot of graph first factor (phonological properties) and second factor (quality properties) insoybean.First factorFigure 2. Plot of graph first factor (yield and yield component properties) and second factor (quality properties) insoybean.components. In water stress condition first factordetermined according to high day to 50% flowering(0/92) and day to maturity (0/919) and calledphonological factor properties and second factordetermined according to high number of seed per plant(0/595) and protein content (0/964) was called qualityfactor (Figure 1) and in normal condition first factordetermined according to high plant height (0/681),number of seed per plant (0/868) and grain yield (0/876)called yield and yield component factor properties andsecond factor determined according to high oil content(0/88) and 100 grain weight (-0/774) was called qualityfactor (Figure 2). Principal component analysis is usefulas it gives information about the groups where certaintraits are more important allowing the breeders toconduct specific breeding programs. The results ofpresent studies are in line with those of Narjesi et al.(2007). Principal component analysis is useful as it givesinformation about the groups where certain traits aremore important allowing the breeders to conduct specific
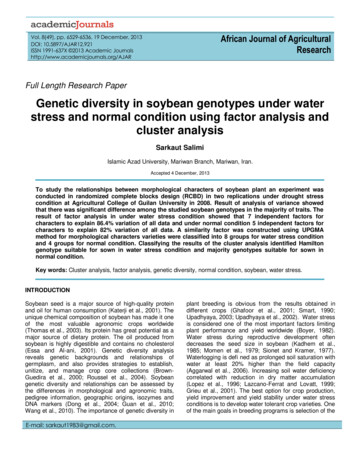
Salimi6533Table 5. Means value and variance of 7 cluster of studied traits under water stress condition.Traitsplant heightNumber of podLeaf areaNumber of seed on podNumber of seed per plant100 grain weightDay to 50% floweringDay to maturitygrain yieldOil contentProtein contentCluster 133/5580/71116Cluster 44/3315/0061/7585/6857/06Cluster 584/73244/74Cluster 89Cluster VVariance 5517/91Cluster 315/499/9688/48324/8Cluster 14/260/7781/4325/17Cluster 64118/794/36Table 6. Mean value and variance of 4 cluster of studied traits under normal (non stress) condition.TraitsPlant heightNumber of podLeaf areaNumber of seed on podNumber of seed per plant100 grain weightDay to 50% floweringDay to maturityGrain yieldOil contentProtein contentbreeding programs.Cluster analysisCluster analysis based on nine agro-Cluster /2514/475/0782/65165/4Cluster 7/5715/21/6386/7953/25Cluster 926/6679/48217/2morphological and two seed quality traits during2008, divided 19 genotypes of glycin max into 8clusters in water stress condition and 4 cluster innormal condition. Mean values and variance foreach of 8 and 4 clusters are presented in (Tables5 and 6). In water stress condition Cluster ICluster 5/85118/7consisted of 4 genotypes (6, 9, 10 and 14) andthese genotypes were medium early in flowering,medium early in maturity, tall, medium number ofseed per plant, medium grain yield, medium oilcontent and medium protein contents (Figure 3).Cluster II comprised of 4 genotypes (2, 11, 12 and
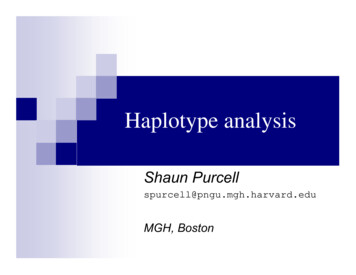
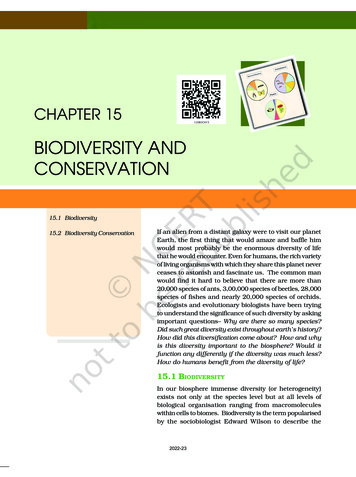
6534Afr. J. Agric. Res.Figure 3. Dendogram of cluster analysis of soybean genotypes classified according to all the traits studied inwater stress condition.17) and these genotypes were early in flowering, early inmaturity, short, low number of seed per plant, low grainyield, medium oil contents and medium protein contents.There were 2 genotypes (1 and 16) in Cluster III andthese genotypes were late in flowering, late in maturity,medium height, high number of seed per plant, high grainyield, medium oil contents and medium protein contents.Cluster IV consisted of 2 genotypes (13 and 15) andthese genotype were early in flowering, early in maturity,tall, low number of seed per plant, low grain yield and lowoil contents and very low protein contents. There were 3genotypes (4, 8 and 18) in cluster V and these genotypeswere medium in flowering, medium in maturity, short, lownumber of per plant, low grain yield, high oil contents andhigh protein contents. Cluster VI had 2 genotypes (3 and19) and these genotypes were characterized by mediumin flowering, medium in maturity, tall, low number of seedper plant, high grain yield, medium oil contents andmedium protein contents. Cluster VII comprised ofWilliams genotype characterized as medium in flowering,late in maturity, medium very tall, medium number ofseed per plant, medium grain yield, medium oil contentsand low protein contents. Cluster VIII comprised ofHamilton genotype characterized as medium in flowering,medium in maturity, very short, high number of seed perplant, high grain yield, high oil contents and high proteincontents (Figure 4). In normal (non stress) conditionCluster I consisted of 9 genotypes (1, 6, 7, 8, 10, 14, 15and 16) and these genotypes were medium in flowering,medium in maturity, tall, very high number of seed perplant, very high grain yield, medium oil content andmedium protein contents. Cluster II comprised of 7genotypes (3, 4, 5, 9, 11, 17 and 19) and thesegenotypes were medium in flowering, medium in maturity,medium height, very low number of seed per plant,medium grain yield, medium oil contents and mediumprotein contents. There were 2 genotypes (2 and 18) incluster III and these genotypes were medium in flowering,medium in maturity, short, very low number of seed perplant, very low grain yield, medium oil contents andmedium protein contents. Cluster IV consisted Hackgenotype and this genotype were early in flowering, earlyin maturity, very short, very low number of seed per plant,very low grain yield and medium oil contents and mediumprotein contents. Classifying the results of the clusteranalysis identified Hamilton genotype suitable for sown inwater stress condition and majority genotypes suitable forsown in normal (non stress) condition and Hamiltongenotype in water stress condition which confirm theresults of the compared means yield. This genotypecould be used as source of germplasm for breeding forwater tolerance. The results of cluster analysis suggestedthat there is variation among the genotypes for differentagro-morphological and seed quality traits. Genotypeswith greater similarity for agro-morphological and seedquality traits were placed in the same cluster. Results ofpresent studies are in agreement with those of Chang etal. (1998).
Salimi6535Figure 4. Dendogram of cluster analysis of soybean genotypes classified according to all the traitsstudied in normal (non stress) condition.ConclusionsResult of analysis of variance showed that there wassignificant difference among the studied soybeangenotypes in the majority of traits. Principal componentanalysis is useful as it gives information about the groupswhere certain traits are more important allowing thebreeders to conduct specific breeding programs.Classifying the results of the cluster analysis identifiedHamilton genotype suitable for sown in water stresscondition and majority genotypes suitable for sown innormal condition. Identifying a genetic structure withinsoybean genotypes is useful for establishing strategiesfor sampling and managing germplasm. Crossesbetween the Hamilton genotype with other genotypescould be used to create genotype resistant under stresscondition.REFERENCESAbayomi YA (2008). Comparative Growth and Grain Yield Responsesof Early and Late Soybean Maturity Groups to Induced Soil MoistureStress at Different Growth Stages. World J. Agric. Sci. 4(1):71-78.Aggarwal PK, Kalra N, Chander S, Pathak H (2006). InfoCrop: adynamic simulation model for the assessment of crop yields, lossesdue to pests, and environmental impact of agroecosystems in tropicalenvironments. I. Model description; Agric. Syst. 89:1–25.Arshad M, Naazar A, Ghafoor A (2006). Character correlation and pathcoefficient in soybean [Glacin max (L.)] Merill. Pak. J. Bot. 38(1):121130.Boyer JS (1982). Plant productivity. Environ. Sci. 218: 43-448.Brown-Guedira GL, Thompson JA, Nelson RL, Warburton ML (2000).Evaluation of genetic diversity of soybean introductions and northAmerican ancestors using RAPD and SSR markers. Crop Sci.40:815–823.Chang RZ, Sun JY, Qiu LJ (1998). The development of soybeangermplasm in China. Crops 3:7–9.Dong YS, Zhao LM, Liu B, Wang ZW, Jin ZQ, Sun H (2004). Thegenetic diversity of cultivated soybean grown in China. Theor. Appl.Genet. 108:931-936.Essa TA, Al-ani DH (2001). Effect of salt stress on the performance ofsix soybean genotypes. Pak. J. Biol. Sci. 4:175-177.Ghafoor A, Sharif A, Ahmad Z, Zahid MA, Rabbani MA (2001). Geneticdiversity in blackgram (Vigna mungo L. Hepper). Field Crops Res.69:183-190.Grieu P, Lucero DW, Ardiani R, Ehleringer JR (2001). The mean depthof soil water uptake by two temperate grassland species over timesubjected to mild water deficit and competitive association. Plant Soil.230:179-209.Guan R, Chang R, Li Y, Wang L, Liu Z, Qiu L (2010). Genetic diversitycomparison between Chinese and Japanese soybeans (Glycine max(L.) Merr.) revealed by nuclear SSRs. Genet. Resour. Crop. Evol.57:229-242.Kadhem FA, Specht JE, Williams JH (1985). Soybean irrigation seriallytimed during stages R1 to R6. II. Yield component responses. Agron.J. 77:299-304.Katerji N, Van Hoorn JW, Hamdy A, Mastrorilli M, Oweis T, Erskine W(2001). Response of two varieties of lentil to soil salinity. Agric. WaterManag. 47:179-190.Lazcano-Ferrat I, Lovatt CJ (1999). Relationship between relative watercontent, nitrogen pools, and growth of Phaseolus vulgaris L. and P.acutifolius A. Gray during water deficit. Crop Sci. 39:467-475.Lopez FB, Johansen C, Chauhan YS (1996). Effects of timing ofdrought stress on phenology, yield and yield components ofshortduration pigeon pea. J. Agron. Crop Sci. 177:311-320.Momen NN, Carlson RE, Shaw RH, Arjmand O (1979). Moisture stresseffects on the yield components of two soybean cultivars. Agron J.71:86-90.
6536Afr. J. Agric. Res.Narjesi V, Khaneghah HZ, Zali EE (2007). Assesment of geneticalrelationship in few important agronomic characters with grain yield insoybean by multivariate ststistical analysis. Agric. Nat. Res. Sci.41(11):227-234.Roussel V, Koenig J, Bechert M, Balfouriter F (2004). Moleculardiversity in French bread wheat accessions related to temporal trendsand breeding programmes. Theor. Appl. Genet. 108:920–930.Sionet N, Kramer PJ (1977). Effect of water stress during differentstages of growth of soybean. Agron. J. 69:274-278.Smart J (1990). Evolution of genetic resources in grain legumes.Cambridge University Press. Cambridge, pp.140-175.Speeht JE, Chase K, Macrander M, Greaf GL, Chung J, Markwell TP,German JHO, Lark KG (2001). Crop Sci. 40:493-509.Thomas JMG, Boote KJ, Allen LH, Gallo-Meagher M, Davis J (2003).Seed physiology and metabolism: Elevated temperature and carbondioxide effects on soybean seed composition and transcriptabundance. Crop Sci. 43:1548-1557.Upadhyaya HD (2003). Phenotypic diversity in groundnut (Arachishypogaea L.) core collection assessed by morphological andagronomical evaluations. Genet. Res. Crop Evol. 50:539-550.Upadhyaya HD, Ortiz R, Bramel PJ, Singh S (2002). Phenotypicdiversity for morphological and agronomic characteristics in chickpeacore collection. Euphytica 123(3):333-342.Wang M, Li RZ, Yang WM, Du W J (2010). Assessing the geneticdiversity of cultivars and wild soybeans using SSR markers. Afr. J.Biotechnol. 9:4857-4866.
and factor analysis and cluster analysis using SPSS 16 software's. RESULTS AND DISCUSSION Result of analysis of variance (Table 2) showed that there were significant differences among the studied soybean genotypes for yield and component yield traits. This illustrates the high potential of these genotypes to use the