Transcription
Allscripts End User Experience Monitoring1 Copyright 5/6/2014 Aternity, Inc
Founded in 2005CUSTOMERS Headquartered outside of Boston, MA Used by F500 companies in every major vertical Closes the visibility gap within all APM tools Any Application Any Device Any User Deployments from 1K to 100K devices2 Physical & Virtual Desktops Mobile Devices Copyright 5/6/2014 Aternity, IncAWARDS
3 Copyright 5/6/2014 Aternity, Inc
4 Copyright 5/6/2014 Aternity, Inc
5 Copyright 5/6/2014 Aternity, Inc
6 Copyright 5/6/2014 Aternity, Inc
7 Copyright 5/6/2014 Aternity, Inc
8 Copyright 5/6/2014 Aternity, Inc
9 Copyright 5/6/2014 Aternity, Inc
Management Service“Directory ServerAnalytic msAggregation ServiceData Collection Service10 Copyright 5/6/2014 Aternity, IncUnlike many productsthat attempt tounderstand end useractivity throughtransaction monitoring,Aternity uniquelycombines the multipledata streams thatseparately describedifferent aspects of enduser experienceproviding an integratedmultidimensionalportrait.”
AllScripts Value
The Allscripts Activity Pack includes the following Activities:1.2.3.4.5.6.7.8.9.10.11.12.13.14.Assess ProblemGo To DocumentsGo To TasksGo To VitalsLaunchMed Encounter SummaryNew Allergy ButtonNew Problem IconNew v10 Structured NoteNew v11 Structured NoteOpen Meds-Orders ACI SearchOpen Note From ScheduleOpen Note SelectorOpen v11 Sign Note tient Toolbar ActivateRecord VitalsSave and Continue new MedSelect Immunization ItemSelect MedSign v11 Structured NoteView Note OutputView qChartView Results DataQverifyLaunchQverify – AllGo To Work-listEtc.An “Activity Signature” is a template which monitors duration and latency associated with navigating from one pointin an application to another. For example, clicking the ‘submit’ button, until a web-page page completes rendering.Activity Signatures can be created to monitor specific actions, or left generic to monitor all actions of a certain type.12 Copyright 5/6/2014 Aternity, Inc
AllScripts – Qverify Activity ExamplePack includes the following Activities:An “Activity Signature” is a template which monitors duration and latency associated with navigating from one pointin an application to another. For example, clicking the ‘submit’ button, until a web-page page completes rendering.Activity Signatures can be created to monitor specific actions, or left generic to monitor all actions of a certain type.13 Copyright 5/6/2014 Aternity, Inc
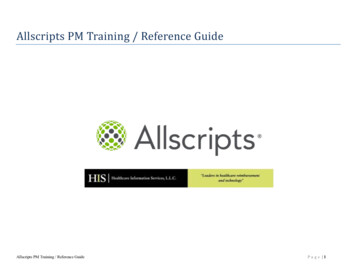
The Go-To Tasks Activity took thelongest and was executed 2,500 times over the given timeframe.Average Response time across all sites for a week. The top portion of the chart shows average response times, the bottomportion shows volume per location.14 Copyright 5/6/2014 Aternity, Inc
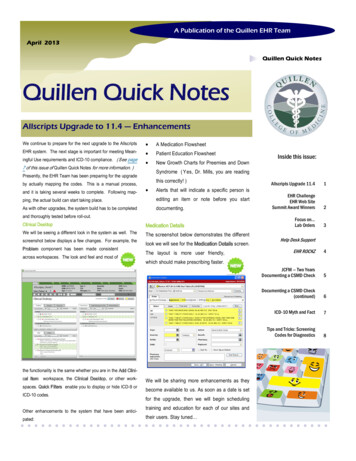
Average Site Performance (andvolume) varies significantly betweenlocations accessing AllScriptsAverage Response time across all sites for a week. The top portion of the chart shows average response times, the bottomportion shows volume per location.15 Copyright 5/6/2014 Aternity, Inc
Normal PerformingCitrix ServersWorst PerformingCitrix ServerBest PerformingCitrix ServerThe chart above compares the true render-time in seconds of all application Activities executed across all Citrix Servers.The 50th percentile represents the mean, the height of the bubble represents the variability and the size of the bubblerepresents volume. The further the bubble is to the left, the better its comparative performance. The further the bubble is tothe right, the worse its comparative response.16 Copyright 5/6/2014 Aternity, Inc
The faster the CPU, the quicker theGoto Task Activity is executed.CPU Speed is an influencing factor in the performance of activities, however, it is not the only determining factor whenmaking decisions based on performance.17 Copyright 5/6/2014 Aternity, Inc
The above chart breaks down the overall activity response time (BLUE) into it’s subcomponents. The amount of time spenton the client side machine (RED) and total infrastructure response time (YELLOW)18 Copyright 5/6/2014 Aternity, Inc
A significant reduction in totalInfrastructure Response Times drovean improvement in the overallResponse of the Activity.Users experienced a significant improvement in the login activity (Activity Response) due to the reduction in networklatency. While the difference was small, it’s affects are compounded due to the number of network round trips done duringthe login activity (Total Network Response time). Other activities are not as “chatty” as the login activity.19 Copyright 5/6/2014 Aternity, Inc
Aternity Value
21 Validation. Truly having the ability to validate end-user experience—eliminating the questions that often come upin IT: Is there really a problem, or is the user simply perceiving one? So often we’ve had to spend countless hourstrying to reproduce a customer issue just to see if one exists. Aternity allows us not only to validate that a problemexists, but identify when, where and how big of an issue it truly is. Hot Fix 8. We used Aternity to analysis the performance difference between Allscripts Enterprise before and afterHotfix 8. Providing the visibility into exactly what benefits and disadvantages the upgrade brought to our end-users. ICA Latency Spikes. Despite other performance monitoring software that works in the backend infrastructure,Aternity was the only solution that revealed an ICA latency issue that caused slowness and performance spikesthroughout three of Sharp’s sites. Sharp’s hardworking Network Team and Aternity’s data forced AT&T to recognizethat there was an issue, which was then corrected. Allscripts Enterprise SQL hardware upgrade. Aternity proved its use early, during our Proof of Concept, theAllscripts SQL hardware was upgraded. Reports were coming in that performance was worse, and thanks to Aternity,we proved that there was a noticeable drop in performance AFTER the supposed “upgrade”. The hardware upgradewas reverted back to its previous state for analysis. Copyright 5/6/2014 Aternity, Inc
Allscripts Enterprise – Record Vitals. With Aternity we were able to identify the performance of the RecordVitals activity degraded over time. As a result, staff began to alter their workflow, raising a concern for patient safety.Sharp provided this Aternity data to Allscripts—who were able to identify an issue with the workflow and provided afix to the issue. Grossmont vs. Memorial. A major performance analysis was performed over the course of 3 months betweentwo of our major hospitals due to reports of one being “slower” than the other. Every IS team at Sharp was involved,from networking, database, and Distributed System Support to Enterprise Device Architecture and CernerTechnical. No one was able to discern any significant performance difference, and Aternity helped by providing thenumbers to back it up, as well as a hardware comparison between sites.SummarySharp is now enabled with Aternity to become proactive with supporting their users leveraging Allscripts, and justifyingthe business decisions required to improve their delivered quality of service based on true end user performance data.Their support teams and their end users are more productive, and doctors are enabled to deliver on their critical businessprocesses.22 Copyright 5/6/2014 Aternity, Inc
"We chose the Aternity platform for its unique ability to proactively identify and remediate application performance issues beforeour end users are impacted.” Keith Bernier, Vice President of IT, Centene Corporation “With Aternity, we can now preemptively detect issues, dynamically isolate the impacted users, and automatically identifyprobable cause, while also ensuring that our mission-critical business applications stay on target to deliver optimal up-time andservice levels.” Royce Uehara, Director of Clinical Information Systems, HealthCare Partners “Aternity was able to offer the monitoring capabilities we require coupled with real-time analytics that will provide us with theproactive IT management approach to both application and desktop management we are looking for.” Jeremy Meller,Director of Enterprise Operations, Spectrum Health Gaining visibility into our end user’s EHR experience is key to achieving solid clinician adoption. That is why we chose Aternity.When we do have end user issues, we can demonstrate progress and not be hindered by a user perceptionthat often trails reality.”Will Weider, Chief Information Officer (CIO), Ministry Health Care23 Copyright 5/6/2014 Aternity, Inc
Demonstration
Aternity Value
On average, the Client 1activities take significantlylonger to execute than similaractivities at other clients.The chart above compares the activities executed by Client 1 clinicians to those executed by peers at Client 2. Eachcolored bar on the left has a corresponding bar on the right of the same color—except in instances where the same activitywas not tracked within both environments.26 Copyright 5/6/2014 Aternity, Inc
On average, at Client 1, activitiesspend a vastly greater time beingprocessed within the infrastructure.The chart above compares the total network response time of activities executed by Client 1 clinicians, to those executedby peers at Client 2. This represents ONLY the time spent processing the activity within the infrastructure.27 Copyright 5/6/2014 Aternity, Inc
At Client 1 the Infrastructure sideprocessing time is significantly worse,Although Client side processing time ispoorer as well. Lets explore the worstfirst—infrastructure processing time.The above chart compares a single activity between Client 1 and Client 2, while breaking down the activity into its subcomponents. The BLUE bars represent the infrastructure processing time. The RED bars represent client side processingtime and the GREEN bar is the sum of the other two bars, representing total activity response.28 Copyright 5/6/2014 Aternity, Inc
No – All middleware application nodes seem to beprocessing activities at similar rates. Either the problemis systemic, or not related to an individual backend node.The above chart represents the Average Total Network Response Time by Backend Application Server for the 10 highestvolume activities.: (Middleware Application Node)The top portion of the chart represents infrastructure processing timeseparated by application node. The bottom portion of the chart represents volume.29 Copyright 5/6/2014 Aternity, Inc
Using the Single Sign-On Technology Sentillion Vergence causesperformance to be vastly worse. Blue Single Sign-On Utilized,RED No Single Sign-On UtilizedThe following chart shows the top 15 activities, by volume, executed by associates within the Clinical Applications. In BLUEare Vergence servers (70 or so) utilizing SSO technology. In RED are the 5 non-Vergence servers not utilizing SSOtechnology Some activities should not be impacted by SSO, while others such as the Open Patient Chart activities are.30 Copyright 5/6/2014 Aternity, Inc
Aternity Value
After defragmenting the Citrix servers,end-users experienced a dramaticincrease in activity response timeThe above chart shows the client side (Citrix) processing time for various activities on two sets of servers. In RED areservers whose hard drives are significantly fragmented—as seen on the previous chart. In BLUE are servers whose driveswere defragmented the previous night. A dramatic decrease in client side processing time occurs after the disks have beendefragmented. Additionally, this lowers disk wear and lengthens disk life.32 Copyright 5/6/2014 Aternity, Inc
The entire Citrix farm had extremely high levels ofFile and Disk Fragmentation—Performing a defragon all servers is highly recommended.The above chart shows the total percent of disk fragmentation (BLUE) and the total percent of file fragmentation (RED)across a handful of Citrix servers. This is not an all inclusive list, however, shows extremely high levels of file fragmentationacross the Citrix farm. A defrag of ALL Citrix servers is highly recommended.33 Copyright 5/6/2014 Aternity, Inc
United States (HQ)Aternity, Inc.200 Friberg ParkwaySuite 1004Westborough, MA 015811-508-475-0414EuropeAternity UK, Ltd.Standard HouseWeyside ParkCatteshall Lane, Godalming,Surrey GU7 1XE 44 333 370 657034 Copyright 5/6/2014 Aternity, Inc
Aternity was the only solution that revealed an ICA latency issue that caused slowness and performance spikes throughout three of Sharp's sites. Sharp's hardworking Network Team and Aternity's data forced AT&T to recognize that there was an issue, which was then corrected. Allscripts Enterprise SQL hardware upgrade.