Transcription
Research and Program Evaluation in Illinois:The Extent and Nature of Drug andViolent Crime in Illinois' CountiesJO DAVIESSSTEPHENSONWINNEBAGO GECOOKLEEKENDALLWILLROCK ISLAND120 S. Riverside Plaza,Suite 1016Chicago, Illinois TARKMARSHALLKNOXTel: (312) 793-8550Fax: (312) 793-8422TDD: (312) UGLASSANGAMONEDGARMOULTRIESCOTTCHRISTIANPrepared byCOLESSHELBYGREENECLARKCUMBERLANDMACOUPINThe Research andAnalysis RAWFORDBONDMADISONCLAYRICHLAND LAWRENCEMARIONCLINTONST. CLAIRWAYNEJEFFERSONMONROERANDOLPHRod R. BlagojevichGovernorSheldon YWHITEFRANKLINJACKSONWILLIAMSONSALINE ACLori G. LevinExecutive DirectorDecember2004A Profile of the Madison CountyCriminal and Juvenile Justice Systems
Break
This project was supported by Grant # 02-DB-MU-0017, awarded to the Illinois Criminal JusticeInformation Authority by the Bureau of Justice Assistance, Office of Justice Programs, U.S.Department of Justice. The Assistant Attorney General, Office of Justice Programs, coordinatesthe activities of the following programs, offices and bureaus: Bureau of Justice Assistance,Bureau of Justice Statistics, National Institute of Justice, Office of Juvenile Justice andDelinquency Prevention, and the Office for Victims of Crime. Points of view or opinionscontained within this document are those of the authors and do not necessarily represent theofficial position or policies of the U.S. Department of Justice.Illinois Criminal Justice Information Authority120 S. Riverside Plaza, Suite 1016Chicago, Illinois 60606-3997Telephone (312) 793-8550Telefax (312) 793-8422World Wide Website http://www.icjia.state.il.us
ACKNOWLEDGMENTSA number of organizations and individuals put a great deal of effort into the development of thisdocument. The Authority’s Research and Analysis Unit is very grateful for the assistanceprovided by the following organizations:Administrative Office of the Illinois CourtsIllinois Department of Children and Family ServicesU.S. Department of Commerce, Bureau of the CensusIllinois Department of CorrectionsIllinois State PoliceThis document was put together by the following Research and Analysis Unit staff:Sharyn AdamsJessica AshleyRobert BauerChristopher HumbleChristine MartinAdriana PerezIdetta PhillipsMichelle Repp
CONTENTSSectionI.II.III.IV.V.VI.VII.Page NumberIntroduction . 1Law Enforcement Activities in Madison County. 3Adult and Juvenile Court Activity in Madison County . 11Jail Populations in Madison County. 19Indicators of Child Abuse and Neglect in Madison County. 21Appendix I (Map of Illinois Counties within a Metropolitan Statistical Area). 24Bibliography . 25LIST OF FIGURESFigureFigure 1.Figure 2.Figure 3.Figure 4.Figure 5.Figure 6.Figure 7.Figure 8.Figure 9.Figure 10.Figure 11.Figure 12.Figure 13.Figure 14.Figure 15.Figure 16.Figure 17.Figure 18.Figure 19.Page NumberTotal Violent Index Offense Rates in Madison and Other Urban Counties .4Total Property Index Offense Rates in Madison and Other Urban Counties . 5Index Arrest Rate in Madison and Other Urban Counties. 6Drug Arrests in Madison County .7Drug Arrest Rates in Madison and Other Urban Counties .8Cannabis Seized in Madison County.9Cocaine and Methamphetamine Seized in Madison County .10Felony and Misdemeanor Filings in Madison County .12Felony Filing Rates in Madison and Other Urban Counties .13Juvenile Delinquency Petitions Filed and Adjudicated in Madison County .14Sentences Imposed on Felons Convicted in Madison County .15IDOC New Court Commitments from Madison County, by Offense Type .16Juvenile Court Commitments to the IDOC Juvenile Division from Madison County .17Total Adult and Juvenile Active Probation Cases in Madison County .18Average Daily Population of the Madison County Jail . 19Average Daily Jail Population Rates, Madison and Other Urban Counties .20Reported and Verified Cases of Substance-Exposed Infants, Madison County .21Reported and Verified Cases of Child Abuse and Neglect in Madison County .22Rate of Verified Cases of Child Abuse and Neglect, Madison and OtherUrban Counties. 23
FOREWORDThe Illinois Criminal Justice Information Authority is a state agency created in 1983 to promotecommunity safety by providing public policymakers, criminal justice professionals and otherswith information, tools and technology needed to make effective decisions that improve thequality of criminal justice in Illinois. The Authority provides an objective system-wide forum foridentifying critical problems in criminal justice, developing coordinated and cost-effectivestrategies, and implementing and evaluating solutions to those problems. The specific powersand duties of the Authority are delineated in the Illinois Criminal Justice Information Act(Illinois Compiled Statutes, Ch. 20, Sec. 393/7). Two of the Authority’s many responsibilities areserving as a clearinghouse of information and research on criminal justice and undertakingresearch studies to improve the administration of criminal justice.Since 1989, the Authority’s Research and Analysis Unit has received funds under the federalAnti-Drug Abuse Act of 1988 to document the extent and nature of drug and violent crime inIllinois and the criminal justice system’s response to these offenses. As a result of these efforts,the Authority has amassed a large amount of data measuring the extent and nature of drug andviolent crime in Illinois and the impact these crimes have had on the criminal justice system. Toput this information into the hands of Illinois’ criminal justice policymakers in a useful summaryformat, the Authority’s Research and Analysis Unit has developed profiles of the criminal justicesystem for each county in Illinois. In 1994, the Illinois Criminal Justice Information Authorityproduced a series of reports detailing criminal justice system activity levels for each of Illinois’102 counties. As a result of the positive response by local criminal justice officials, in 1996 theAuthority updated and expanded the scope of these reports to reflect current criminal andjuvenile justice activity. It is hoped that these 2004 updated reports will be as valuable, if notmore, than the original versions. In addition to providing policymakers with an overview ofactivities across the components of the justice system in their county (law enforcement, courtsand corrections), the profiles also provide perspective by including trends experienced incounties with similar population sizes.While the data presented in this report are by no means inclusive of all indicators, they doprovide a general overview of crime and the criminal justice system’s response. In addition,these data are readily available and consistently defined through existing statewide datacollection mechanisms.The information presented in this profile has been provided to the Authority by a number of stateagencies, specifically: the Illinois State Police, the Administrative Office of the Illinois Courts,the Illinois Department of Corrections, and the Illinois Department of Children and FamilyServices. The support and cooperation of these agencies and their staffs have helped make thisreport an informative and timely source of information on the activities of the criminal justicesystem in Illinois.The Illinois Criminal Justice Information Authority'sWeb-based clearinghouse of criminal justice data available at:http://www.icjia.state.il.us.
I. IntroductionMadison County, located in southwestern Illinois, covers an area of 725 square miles and had a2003 population of 261,689, according to estimates by the U.S. Department of Commerce'sBureau of the Census. Using these figures, Madison County was the 20th largest county inIllinois geographically, but 8th largest in terms of population. Combining these two measures,Madison County had the 9th highest population density per square mile among Illinois’ 102counties.As with the previous reports, information specific to Madison County is presented in comparisonwith similar counties. To provide more useful comparisons, counties have been separated intofour types; 1) Cook County, 2) Collar counties, 3) urban counties (outside of Cook and the Collarcounties), and 4) rural counties. Because of its size, Cook County is compared to the rest of thestate. The Collar counties are the five that border Cook County (DuPage, Lake, Kane, McHenry,and Will). Urban and rural counties are defined by whether or not they lay within a MetropolitanStatistical Area (MSA) (Appendix 1, page 24). Based on these definitions, there are 36 countiesin Illinois that are part of a MSA (Cook, Collar, and urban counties) and 66 counties that are notpart of a MSA (in other words, rural).Recent changes to the standard definitions of MSAs have affected the classification of severalIllinois counties. The United States Office of Management and Budget (OMB) definesmetropolitan and micropolitan statistical areas according to published standards that are appliedto Census Bureau data. The general concept of a metropolitan or micropolitan statistical area isthat of a core area containing a substantial population nucleus, together with adjacentcommunities having a high degree of economic and social integration with that core. Currentlydefined metropolitan and micropolitan statistical areas are based on the application of 2000standards to 2000 decennial census data and were announced by OMB on June 6, 2003.Standard definitions of metropolitan areas have changed over time. The term "metropolitan area"(MA) was adopted in 1990 and referred collectively to metropolitan statistical areas (MSAs),consolidated metropolitan statistical areas (CMSAs), and primary metropolitan statistical areas(PMSAs). More recently, the term "core based statistical area" (CBSA) became effective in 2000and refers collectively to metropolitan and micropolitan statistical areas.The 2000 standards require that each CBSA must contain at least one urban area of 10,000 ormore population. Each metropolitan statistical area must have at least one urbanized area of50,000 or more inhabitants. Each micropolitan statistical area must have at least one urbancluster of at least 10,000 but less than 50,000 population.Under the standards, the county (or counties) in which at least 50 percent of the populationresides within urban areas of 10,000 or more population, or that contain at least 5,000 peopleresiding within a single urban area of 10,000 or more population, is identified as a "centralcounty" (counties). Additional "outlying counties" are included in the CBSA if they meetspecified requirements regarding residents commuting to or from the central counties.A Profile of the Madison County Criminal and Juvenile Justice Systems1
Changes in the definitions of these statistical areas since the 1950 census have consisted chieflyof: 1) the recognition of new areas as they reached the minimum required city or urbanized areapopulation, and 2) the addition of counties to existing areas due to new decennial census data. Insome instances, formerly separate areas have been merged, components of an area have beentransferred from one area to another, or components have been dropped from an area. The largemajority of changes have taken place on the basis of decennial census data.Because of these historical changes in geographic definitions, users must be cautious incomparing data for these statistical areas from different dates. For more information, contact thePopulation Distribution Branch at (301) 763-2419 (U. S. Census Bureau).Based on these characteristics, Madison County is one of Illinois’ 30 urban counties. Throughoutthis report, the criminal justice activity trends experienced in Madison County will be comparedto those trends experienced in the other urban counties. This comparison will be realized throughthe calculation of rates for the activities being analyzed, with the number per 100,000 populationthe format for all the rates.A Profile of the Madison County Criminal and Juvenile Justice Systems2
II. Law Enforcement Activities in Madison CountyOne of the most commonly used indicators of the level of crime in a particular jurisdiction is thenumber of Index offenses reported to the police. There are eight separate offenses that constitutethe Crime Index, including murder, criminal sexual assault, robbery, aggravated assault (violentIndex offenses), burglary, theft, motor vehicle theft, and arson (property Index offenses).Although these eight offenses do not account for all crimes reported to the police, they areconsidered to be the most serious, frequent, pervasive, and consistently defined by different lawenforcement agencies.An indicator of the workload that law enforcement agencies place on other components of thejustice system is the number of arrests made by police, including those for violent and propertyIndex offenses and drug offenses. Unlike offenses, which are what police must respond to,arrests represent those offenders who may eventually be processed through other components ofthe justice system, including the courts, county jails, and state and local correctional programs.In addition to local law enforcement agencies, the Metropolitan Enforcement Group ofSouthwestern Illinois (MEGSI) also serves Madison County. Throughout most of the periodanalyzed, there were 21 Metropolitan Enforcement Groups (MEGs) and task forces operating inIllinois. A county is considered to be served by a MEG or task force if at least one lawenforcement agency within that county participated in that MEG or task force either by providingpersonnel or financial resources.To learn more about the drug enforcement activities of the Metropolitan Enforcement Group ofSouthwestern Illinois and Illinois’ other MEGs and task forces, profiles of each of the units weredeveloped by the Authority’s Research and Analysis Unit and are available through theAuthority’s Criminal Justice Information Clearinghouse or can be downloaded from theAuthority’s Website at www.icjia.state.il.us.A Profile of the Madison County Criminal and Juvenile Justice Systems3
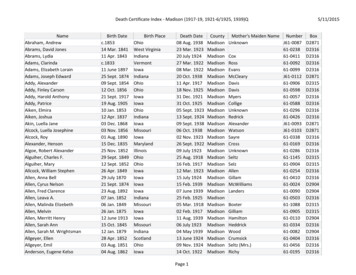
Violent Index Offenses Reported to the Police in Madison CountyThe number of violent Index offenses reported to the police increased slightly in MadisonCounty between 1994 and 2003, from 1,167 to 1,179. As in previous years and in most othercounties, aggravated assault offenses accounted for the majority (69 percent) of violent Indexoffenses reported in Madison County in 2003.Between 1994 and 2003, the violent Index offense rate in Madison County decreased 1 percent,from 457 to 451 offenses per 100,000 population (Figure 1). Similarly, during that same period,the violent Index offense rate in the other urban counties decreased 35 percent, from 830 to 542offenses per 100,000 population. The 2003 violent Index offense rate in Madison County was 17percent lower than the rate in the other urban counties.Figure 1Total Violent Index Offense Rates inMadison and Other Urban Counties900Rate per 100,000 Population80070060050040030020010001994 1995 1996 1997 1998 1999 2000 2001 2002 2003YearMadison CountyOther Urban CountiesSource: ICJIA calculation using Illinois State Policeand U.S. Census Bureau dataA Profile of the Madison County Criminal and Juvenile Justice Systems4
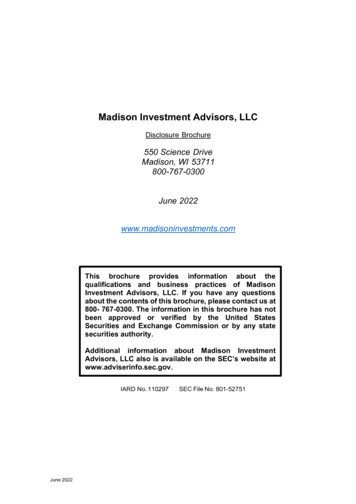
Property Index Offenses Reported to the Police in Madison CountyBetween 1994 and 2003, the number of property Index offenses reported to the police inMadison County decreased 18 percent, from 11,291 to 9,214. Thefts accounted for 67 percent ofall property Index offenses reported in Madison County during 2003.Between 1994 and 2003, the property Index offense rate in Madison County decreased 20percent, from 4,418 to 3,521 offenses per 100,000 population (Figure 2). In the other urbancounties, the property Index offense rate decreased 18 percent, from 4,495 to 3,692 offenses per100,000 population. The 2003 property Index offense rate in Madison County was 5 percentlower than the rate in the other urban counties.Figure 2Total Property Index Offense Rates inMadison and Other Urban CountiesRate per 100,000 1,00050001994 1995 1996 1997 1998 1999 2000 2001 2002 2003YearMadison CountyOther Urban CountiesSource: ICJIA calculation using Illinois State Policeand U.S. Census Bureau dataA Profile of the Madison County Criminal and Juvenile Justice Systems5
Index Arrests by Madison County Law Enforcement AgenciesBetween 1994 and 2003, arrests for total Index offenses by law enforcement agencies inMadison County increased 4 percent, from 2,420 to 2,524. The majority of Index arrests were forproperty Index offenses. Of the 2,524 Index arrests made in Madison County during 2003, 28percent were for violent Index crimes and 72 percent were for property Index crimes. Arrests fortheft and aggravated assault accounted for the majority of property and violent Index arrests inMadison County during 2003. Of all violent Index arrests, 78 percent were arrests for aggravatedassault, while thefts accounted for 72 percent of all property Index arrests.Between 1994 and 2003, the Index arrest rate in Madison County increased 2 percent, from 947to 965 arrests per 100,000 population (Figure 3). During the same period, the Index arrest rate inthe other urban counties decreased 17 percent, from 1,137 to 939 arrests per 100,000 population.In 2003, Madison County’s Index arrest rate was 3 percent higher than the Index arrest rate in theother urban counties.Figure 3Index Arrest Rates in Madisonand Other Urban CountiesRate per 100,000 Population1,2001,00080060040020001994 1995 1996 1997 1998 1999 2000 2001 2002 2003YearMadison CountyOther Urban CountiesSource: ICJIA calculation using Illinois State Policeand U.S. Census Bureau dataA Profile of the Madison County Criminal and Juvenile Justice Systems6
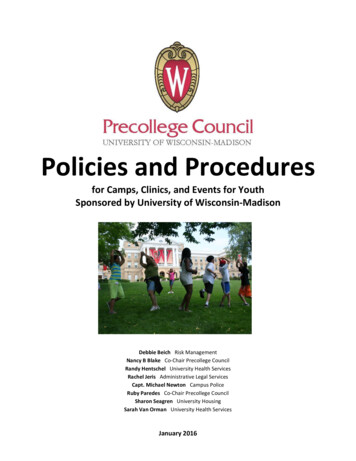
Drug Offense Arrests in Madison CountyBetween 1994 and 2003, arrests for total drug offenses (including violations of Illinois’ CannabisControl Act, Controlled Substances Act, Drug Paraphernalia Control Act, and the HypodermicSyringes and Needles Act) nearly doubled in Madison County, from 1,013 to 2,024 (Figure 4).Similar to other counties, total drug arrests in Madison County remained relatively stablebetween 1983 and 1991, before increasing annually nearly every year thereafter. DrugParaphernalia Control Act violations accounted for the majority of the increase in total drugarrests. Between 1994 and 2003, the number of arrests for violation of the Drug ParaphernaliaControl Act increased dramatically, from 20 arrests in 1994 to 568 in 2003, or in other words, 28percent of all drugs arrests in 2003.During the majority of the period between 1994 and 2003, arrests for violations of Illinois'Cannabis Control Act (which prohibits the possession, sale, and cultivation of cannabis) inMadison County have out-numbered arrests for violations of the Controlled Substances Act(which prohibits the possession, sale, distribution, or manufacture of all other illegal drugs suchas cocaine and opiates). Between 1994 and 2003, the number of arrests for violations of theCannabis Control Act in Madison County increased 67 percent, from 480 to 801. Arrests forviolations of the Controlled Substances Act increased from 499 to 641, between 1994 and 2003,a 28 percent increase (Figure 4).Figure 4Drug Arrests in Madison County3000Number of Drug Arrests25002000150010005000199419951996 19971998199920002001 20022003YearCannabis Control ActControlled Substance ActDrug Paraphernalia Control ActTotalSource: Illinois State PoliceA Profile of the Madison County Criminal and Juvenile Justice Systems7
Between 1994 and 2003, the arrest rate for all drug law violations in Madison County also nearlydoubled, from 396 to 773 per 100,000 population (Figure 5). Similarly, the total drug arrest ratein the other urban counties nearly doubled between 1994 and 2003, from 322 to 641 per 100,000population, a 99 percent increase. In 2003, the drug arrest rate in Madison County was 21percent higher than the rate in the other urban counties.Figure 5Drug Arrest Rates in Madisonand Other Urban Counties1,000900Rate per 100,000Population80070060050040030020010001994 1995 1996 1997 1998 1999 2000 2001 2002 2003YearMadison CountyOther Urban CountiesSource: ICJIA calculation using Illinois State Policeand U.S. Census Bureau dataDrugs Seized in Madison CountyDrugs seized by law enforcement agencies are another indicator of the extent and nature of theillegal drug trade in a jurisdiction. When illegal drugs are seized by law enforcement agencies inIllinois, they are submitted to a crime lab for analysis. Most agencies submit drugs to one of theIllinois State Police crime labs. These labs record the quantity of drugs submitted from eachcounty. This section discusses the quantities of illegal drugs seized and submitted to the IllinoisState Police from law enforcement agencies in Madison County.A Profile of the Madison County Criminal and Juvenile Justice Systems8
Cannabis Seized in Madison CountyCannabis accounts for the majority of drugs seized in Madison County and in most Illinoisjurisdictions. Between 1994 and 2003, the quantity of cannabis seized in Madison Countydecreased 69 percent, from 383,119 grams to 117,212 grams. During the period between 1994and 2003, the quantity of cannabis seized in the other urban counties decreased 57 percent, from928,647 grams to 397,421 grams (Figure 6).Figure 6Cannabis Seized in Madison County1,000,000900,000800,000Grams 0,00001994 1995 1996 1997 1998 1999 2000 2001 2002 2003YearSource: Illinois State PoliceBetween 1994 and 2003, the cannabis seizure rate in Madison County decreased 70 percent,from 149,902 grams per 100,000 population in 1994 to 44,791 grams in 2003. The cannabisseizure rate in the other urban counties decreased 59 percent, from 40,243 grams per 100,000population in 1994 to 16,494 grams in 2003. In 2003, Madison County's cannabis seizure ratewas more than double the rate in the other urban counties.A Profile of the Madison County Criminal and Juvenile Justice Systems9
Cocaine and Methamphetamine Seized in Madison CountyDuring the past decade, it is clear that methamphetamine “activity” in the state has increaseddramatically and has become a significant drug problem in many jurisdictions. Further, theextent to which law enforcement agencies are encountering methamphetamine has also dispersedacross a large area of the state, with most of this being fueled by activities taking place inIllinois’ rural jurisdictions.The quantity of cocaine seized decreased, while the quantity of methamphetamine seizedincreased in Madison County between 1994 and 2003. The quantity of cocaine seized decreased87 percent, from 36,278 grams in 1994 to 4,556 grams in 2003 (Figure 7). The quantity ofmethamphetamine seized increased nearly 19-fold, from 161 grams in 1994 to 3,263 grams in2003.Figure 7Cocaine* and MethamphetamineSeized in Madison County40,00035,000Grams hetamineSource: Illinois State Police*Cocaine totals include both powder and crack cocaineThe quantity of cocaine and methamphetamine seized in the other urban counties increasedduring the period analyzed. Between 1994 and 2003, the amount of cocaine seized increased 62percent, from 23,575 grams to 38,307 grams in the other urban counties, while the quantity ofmethamphetamine seized increased from 459 grams to 4,822 grams. In 2003, 1,741 grams ofcocaine per 100,000 population were seized in Madison County, nearly 10 percent higher thanthe rate of 1,590 grams of cocaine per 100,000 population seized in the other urban counties. Therate of methamphetamine seized in Madison County increased from 63 grams per 100,000population in 1994 to 1,247 grams per 100,000 population, compared to the rate in the otherurban counties which increased from 20 to 200 grams per 100,000 between 1994 and 2003.A Profile of the Madison County Criminal and Juvenile Justice Systems10
III. Adult and Juvenile Court Activity in Madison CountyAlthough Illinois has one of the best court reporting systems in the country, the AdministrativeOffice of the Illinois Courts only collects information regarding the aggregate number of courtfilings, dispositions, and probation caseloads. Currently, there are no statewide data available oncourt filings, dispositions, and convictions by offense type. However, detailed offense data areavailable from the Illinois Department of Corrections for those convicted felons sentenced toprison.Trends in the number of delinquency petitions filed and adjudicated in juvenile court are alsopresented. Illinois statutes define delinquency offenses as those committed by someone youngerthan 17 years old that would be considered crimes if committed by someone 17 years of age orolder.In Illinois, county probation departments are overseen by the Administrative Office of theIllinois Courts’ Probation Division. This section also presents data on active misdemeanor andfelony adult caseloads and the number of juveniles under the supervision of the probationdepartments in Madison County and the other urban counties.Misdemeanor and Felony Filings in Madison CountyThe Administrative Office of the Illinois Courts reports data on criminal court cases in twocategories: misdemeanors and felonies. After screening a case and deciding it warrants furtheraction, the state’s attorney must file formal charges in court. Misdemeanor cases are less seriousthan felonies and can be punished by a probation sentence of one year or less and less than oneyear of incarceration. Felony cases, on the other hand, are more serious and can be punished by aprobation term up to four years and incarceration for more than one year. When comparing thenumber of filings across time and across counties, it should be noted that differences in reportingpractices exist. For example, when two or more defendants are involved in a single case, somestate’s attorneys file a single case charging all defendants, while others file a separate case foreach suspect.A Profile of the Madison County Criminal and Juvenile Justice Systems11
In 2003, felony and misdemeanor court filings accounted for 14 percent of all filings in MadisonCounty’s courts (civil, traffic, family, and other). Between 1994 and 2003, the number of felonyfilings in Madison County increased 65 percent, from 2,264 to 3,726 (Figure 8). During the sameperiod, misdemeanor filings increased 4 percent, from 8,839 in 1994 to 9,223 in 2003. In 2003,misdemeanor filings out-numbered felony filings by more than two to one.Figure ,0001,5004,0001,0002,000500001994 1995 1996 1997 1998 1999 2000 2001 2002 2003YearFelony FilingsMisdemeanor FilingsSource: Administrative Office of the Illinois CourtsA Profile of the Madison County Criminal and Juvenile Justice Systems12Number of MisdemeanorFilingsNumber of Felony FilingsFelony and Misdemeanor Filingsin Madison County
Between 1994 and 2003, the felony-filing rate in Madison County increased 61 percent, from886 to 1,424 cases per 100,000 population (Figure 9). The felony-filing rate in the other urbancounties increased 23 percent during this period, from 688 to 850 cases per 100,000 population.In 2003, the felony-filing rate in Madison County was 68 percent higher than the rate in the otherurban counties.Figure 9Felony Filing Rates in Madisonand Other Urban CountiesRate per 100,000 519961997199819992000200120022003YearMadison CountyOther Urban CountiesSource: Administrative Office of the Illinois Courtsand U.S. Census Bureau dataIllinois’ juvenile court system differs in several key aspects from the adult criminal court system.One aspect revolves around the difference in treatment between juveniles and adults: the juvenilecourt process is somewhat less formal and adversarial; authorities are given much more latitudein determining the proper response to each case. Traditionally, the terminology used to describejuvenile proceedings has been less harsh than that used for the adult criminal process. Forexample, Illinois’ juvenile courts accept “p
A Profile of the Madison County Criminal and Juvenile Justice Systems 1 I. Introduction Madison County, located in southwestern Illinois, covers an area of 725 square miles and had a 2003 population of 261,689, according to estimates by the U.S. Department of Commerce's Bureau of the Census. Using these figures, Madison County was the 20 th largest county in Illinois geographically, but 8th .