Transcription
Paying Attention to SymmetryGert Kootstra1, Arco Nederveen1 and Bart de Boer21Artificial Intelligence, Univesity of Groningen, Netherlands2Institute of Phonetic Sciences, University of Amsterdam, NetherlandsAbstractHumans are very sensitive to symmetry in visual patterns. Symmetry isdetected and recognized very rapidly. While viewing symmetrical patterns,eye fixations are concentrated along the axis of symmetry or thesymmetrical center of the patterns. This suggests that symmetry is a highlysalient feature. Existing computational models of saliency, however, havemainly focused on contrast as a measure of saliency. These models do nottake symmetry into account. In this paper, we discuss local symmetry as ameasure of saliency. We developed a number of symmetry models andperformed an eye tracking study with human participants viewingphotographic images to test the models. The performance of our symmetrymodels is compared with the contrast saliency model of Itti et al. [1]. Theresults show that the symmetry models better match the human data thanthe contrast model. This indicates that symmetry is a salient structuralfeature for humans, a finding which can be exploited in computer vision.1 IntroductionSymmetry is a visual stimulus that often occurs in our daily lives. We ourselves, forinstance, as well as most other organisms, have a clear left-right symmetrical body. Alsoflowers and butterflies are a good example. The degree of symmetry is even an indicatorof the fitness of the individual. Manipulated images of faces, where the symmetry isenhanced, are judged more attractive than the original faces [2]. Symmetry does not onlyhave value for living organisms. Also in art and decoration, symmetry is usuallypreferred over asymmetry [3]. Furthermore, symmetry is said to increase the figuralgoodness, since the redundancy in a symmetrical figure makes it simpler to encode andis more ordered than a non-symmetrical one [4].In the present research, we investigate whether this abundance of symmetry in theenvironment also means that symmetry plays a role in human visual processing. Morespecifically, we investigate whether symmetry is a salient feature that guides eyemovements and can thus be considered a good predictor for overt visual attention. Wepropose a new model to calculate saliency on the basis of symmetry, which is able topredict human fixations better than existing saliency models.It is known that humans are highly sensitive to symmetry. We detect symmetricalpatterns very rapidly. When patterns have multiple axes of symmetry, recognition speedincreases even more [5]. Similarly, symmetry positively influences recall anddiscrimination [6]. This suggests that the detection mechanism works preattentively and
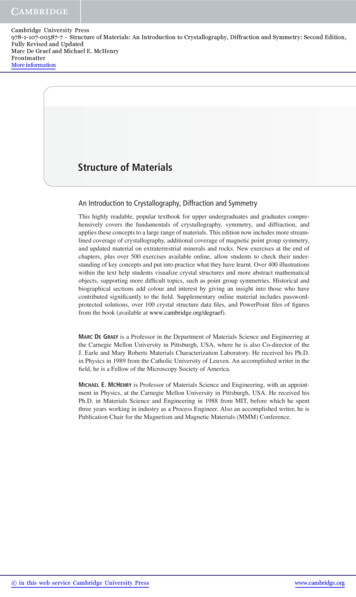
Figure 1: Examples of images containing symmetrical forms. The second column showsthe human fixation density map, the third shows the contrast saliency map, and the lastshows our symmetry saliency map. The bright regions are the parts of the maps above50% of its maximum. The preference of humans to fixate on the center of symmetry iscorrectly reproduced by our symmetry model, whereas the contrast model displays awide non-specific saliency response.in a parallel manner [7]. The improvement in performance is thought to be related to theredundancy in the symmetrical forms, which results in more effective and simplerrepresentations [8].There is also evidence that eye movements are influenced by symmetry. Whenviewing symmetrical forms, humans tend to fixate on the center of the form [9], or thecrossing points of the symmetry axes [10]. Furthermore Locher and Nodine [11] foundthat fixations are concentrated along the axis of symmetry, and that fixations are morespread out for non-symmetrical images. These studies, however, use relatively simplestimuli with only one pattern presented at a time. In our experiment, we usephotographic images to study whether local symmetry also guides eye movements inmore complex scenes.These observations suggest that symmetry is a salient feature. However, most existingsaliency models that model overt visual attention do not use symmetry as a measure ofsaliency. Instead, most models are based on local contrast in the image. The model ofItti et al. [1, 12], for instance, is based on contrasts in luminance, color and orientation.Their model is strongly influenced by the feature integration theory of human visualsearch [13]. The saliency model of Itti et al. has been compared to human eye fixations.Parkhurst, Law and Niebur [14] tested the model on photographic images and theyshowed that the model matches the human fixation points significantly better thanexpected by chance. Ouerhani et al. [15] also found a positive correlation between themodel and human fixation data.Other saliency models, like the model of Le Meur et al. [16] are also based oncontrast calculations. In their model contrast is calculated in the spatial frequencydomain. Le Meur et al. compared their model to human data and found a positivecorrelation, which was slightly higher than the performance of Itti and Koch’s model. Aset of simpler saliency operators including other features than contrast alone have beenproposed by Privitera and Stark [17]. These were also found to predict human fixation
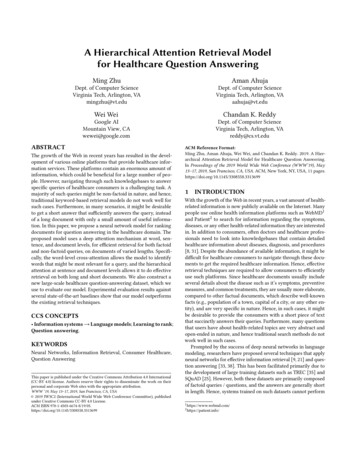
points to some extent. It must be noted that Privitera and Stark also used a basicsymmetry operator, which weakly resembled the human data.Although most existing models are based on contrast, figure 1 shows that humanshave a clear preference to fixate on the center of symmetry. This can neither beexplained by Itti and Koch’s model, nor by any of the other contrast models. Thisapparent deficiency in current vision models was the stimulus for the present study. Inthis paper we therefore investigate the role of local symmetry in overt visual attention.We use photographic images that contain real-world scenes with a complexity that goesbeyond the simple forms used in the earlier mentioned psychophysical studies. It will beshown that the symmetry saliency models that we developed, do match the human eyefixation data.The paper is organized as follows. We start with a description of the three symmetrysaliency models that we developed. These models are based on the isotropic symmetryand radial symmetry operator of Reisfeld, Wolfson and Yeshurun [18], and the colorsymmetry operator of Heidemann [19]. Furthermore, the eye tracking study that weconducted to test the performance of the saliency models is discussed. Then, the resultsare shown and compared to the saliency model of Itti and Koch, that is based on contrast[1]. We end with a discussion on the role of symmetry in overt visual attention.2 MethodsTo investigate the role of symmetry in visual attention, we developed a number ofsymmetry saliency models and compared them with human eye tracking data. Toestablish a point of reference, the contrast saliency model of Itti et al. [1] is alsocompared with the human data. In this section, the developed symmetry saliency modelsare explained. Furthermore, we describe the eye tracking studies. The section ends withthe description of the methods to compare the models with the human data.2.1Symmetry operatorsWe developed three symmetry saliency models based on the isotropic symmetry andradial symmetry operator of Reisfeld, Wolfson and Yeshurun [18], and the colorsymmetry operator of Heidemann [19].The isotropic symmetry operator [18] calculates the amount of symmetry at a givenposition, x, based upon gradients of the intensity in surrounding pixels. This is done bycomparing pairs of pixels i and j at positions xi and xj, where x ( xi x j ) / 2 (seefig. 2a). Every pixel pair contributes to the local symmetry byc(i, j ) d (i, j , σ ) p(i, j ) mi m j(1)Where mi is the magnitude of the gradient at point i, d (i, j , σ ) is a Gaussian weightingfunction on the distance between the two pixels with standard deviation σ, and thesymmetry measurement p(i, j ) is calculated byp(i, j ) (1 cos(γ i γ j ) ) (1 cos(γ i γ j ) )(2)
Figure 2: The basis of our symmetry models. (a) gives three examples of pixel pairswhose gradients are compared by the symmetry operator. The geometry of thecontribution of a pixel pair is shown in (b) and further explained in the text. (c) gives anoverview of the multi scale setup of the symmetry models.Where γ i θi α is the angle between the direction of the gradient angle θi and theangle α of the line between pi and pj (see fig. 2b). The first term in equation (2) has amaximum value when γ i γ j π , which is true for gradients that are mirror symmetricwith respect to p. Using only this term would result in high values for points on astraight edge, which are not considered symmetrical. To avoid this problem, the secondterm demotes pixel pairs with similar gradient orientation. In this way, the contributionsof all pixel pairs, Γ( p) , within the radius, r, are summed up to give the isotropicsymmetry value for p.(3)Miso ( x, y ) ( i , j ) Γ ( p ) c(i, j )To make the symmetry operator more sensitive to symmetrical patterns with multipleaxes of symmetry, Reisfeld et al. [18] developed the radial symmetry operator as anextension of the isotropic symmetry operator. First, the orientations of the contributionof the pixel pairs are calculated by ϕ (i, j ) (θ i θ j ) / 2 . Next, the symmetry orientationis determined as φ ( p) ϕ (i, j ) for (i, j ) that give the highest contribution c(i, j ) . Thisvalue is then used to promote the contributions of pixels pairs with dissimilarorientations.(4)Mrad (i , j ) Γ ( p ) c(i, j ) sin 2 (ϕ (i, j ) φ ( p) )The two symmetry operators mentioned above work on intensity values only. Sincesome color transitions are not detectable in gray-valued images, Heidemann [19]adapted the isotropic symmetry operator to the color symmetry operator. This operatoruses three color channels, red, green and blue. Equation (3) is adapted so that not onlythe gradients of pixels in one channel, but also between different channels are compared.(5)Mcol ( x, y ) c(i, j , ki , k j )( i , j ) Γ ( ki , k j ) KWhere K contains all combinations of color channels, and c(i, j , ki , k j ) is the symmetrycontribution calculated by comparing pixel i in color channel ki with pixel j in colorchannel kj. Furthermore, equation (2) is altered top(i, j ) cos 2 (γ i γ j ) cos 2 (γ i ) cos 2 (γ j )(6)
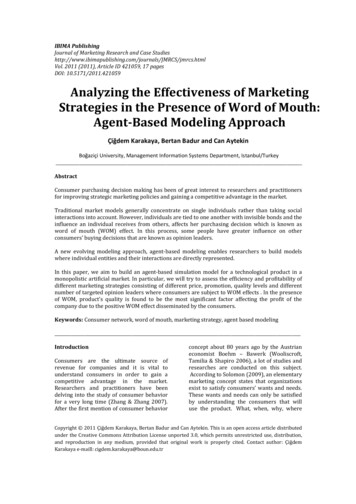
so that the function becomes π-periodic in the first term, giving the same result forgradients that are rotated 180 . The second term keeps the same functionality as thesecond term in equation (2).2.2Symmetry saliency modelsFigure 3: Examples of images used in our experiments, one for each image category:flowers,streetscenes, ratorsonanda singlespatial scale. However, most existingsaliency models operate on multiple scales, and the human visual system is also thoughtto process on multiple spatial scales. We therefore developed the operators into multiscale symmetry saliency models, similarly to Itti et al’s model [1].The process to calculate the symmetry maps is depicted in figure 2c. First, five spatialscales of the input image are created by progressively applying a Gaussian filterfollowed by a down scaling of the image by a factor two. The different scales are thenprocessed to symmetry feature maps using the symmetry operators as discussed in theprevious section, where we use r 24 and σ 36 . Next, the five feature maps arenormalized using the normalization operator, N, used in [1]. This normalization consistsfirst of scaling the feature map values to the range [0.1], and then multiplying thefeature map with (1 m) 2 , where m is the average value of all local maxima in the map.This normalization promotes feature maps that contain a small number of symmetricalpatterns that really stand out, as opposed to feature maps that contain many patterns withsimilar symmetry values. Finally, the feature maps are combined into a symmetrysaliency map by resizing all feature maps to the same size and summing them.4S N (Ms )s 0(7)Where is the summation operator that resizes all parts to the same size, and Ms isthe symmetry feature map at scale s. This procedure results in three symmetry saliencymaps: S iso for isotropic symmetry, S rad for patterns with multiple symmetry axes, andS col which uses color information.2.3Eye tracking experimentWe recorded human fixation data during an eye tracking experiment using the Eyelinkhead-mounted eye tracking system (SR research). Fixation locations were extractedusing the accompanied software. The images were displayed full-screen with aresolution of 1024 by 768 pixels on an 18’’ crt monitor of 36 by 27 cm at a distance of70 cm from the participants. The visual angle was approximately 29º horizontally by 22ºvertically. Before the experiment, the eye tracker was calibrated using the Eyelinksoftware. The calibration was verified prior to each session, and recalibrated if needed.The participants were asked to free view the images. We did not give the participantsa task, since we are interested in the bottom-up components of visual attention. A taskwould give a strong top-down influence on the eye movements. Our approach is similarto [16, 20].The experiment was carried out by 31 students of the University of Groningen. Theparticipants ranged from 17 to 32 years old, among them 15 females and 16 males withnormal or corrected-to-normal vision. In the experiment, 99 images in five differentcategories were presented, 12 image of animals in a natural setting, 12 images of street
scenes, 16 images of buildings, 40 images of natural environments, and 19 images ofnatural symmetries, e.g., flowers, plants and butterflies (see figure 3). All these imageswere taken from the McGill calibrated colour image database [21]. The experiment wassplit up into sessions of approximately 5 minutes. Between the sessions, theexperimenter had a short relaxing conversation with the participants, in order to getthem motivated and focused for the next session. Before starting a new session, thecalibration of the eye tracker was verified. After each presented images, drift wasmeasured and corrected if needed using the Eyelink software. The participants coulddecide when to continue and were allowed to take a short break.2.4Comparison methodsWe used two methods to compare the saliency models with the human data. The firstmethod is a correlation method similar to [15, 16]. In this method we correlate thesaliency maps with fixation density maps calculated from the human fixation data forevery single trial. For every single trial, the fixation density map is constructed byplacing Gaussian distributions for every fixation with the mean equal to the point offixation and a standard deviation of 18 pixels. This value is chosen to fit the angular sizeof the fovea. The resulting value of this comparison method is given by the correlationcoefficient, ρ, as calculated by equation (8).( ( F ( x, y ) µ F ) ( S ( x, y ) µ S ) ) x, yρ (8)σ F2 σ S2Where F is the fixation density map, S is the saliency map and µ and σ2 are respectivelythe mean and the variance of these maps. The correlation coefficient has a valuebetween -1 and 1. ρ 0 means that there is no correlation between the two maps, whichis true when correlating with random fixation density maps. A value for ρ close to zeroindicates that a model is a poor predictor of human fixation locations. Positivecorrelations show that there is a similar structure in the saliency map and the humanfixation map.The second comparison method, the fixation saliency method, measures the averagesaliency at the points of human fixation compared to the average saliency at a largenumber of randomly chosen points. This method is similar to that used by Parkhurst etal. [14]. The method puts an emphasis on the analyses of the fixation points more thanon the comparison of the complete saliency maps. The fixation saliency score λ iscalculated by
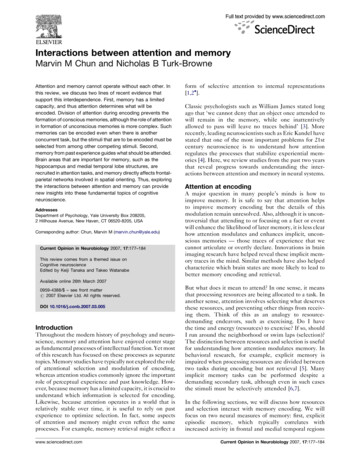
Figure 4: The results of correlation method. The groups show the results for thedifferent image categories. The error bars give the 95% confidence intervals. Thehorizontal gray bars with the solid line show the mean and 95% confidence interval ofthe inter subject correlation. The dashed lines show the correlation of the human datawith random fixations (close to zero). λ ni 1mj 1s( f i )(9)s(rnd)Where fi is the ith human fixation location and rnd is a randomly determined location.We used an m of 1000 in our analysis. Furthermore, s( p) is the average saliency valuein a patch of the saliency map centered at point p and with a radius r 28 . If λ 1 , thesaliency at the human fixation points is higher than in the rest of the image, which meansthat the given saliency model has predictive power.3 ResultsIn figure 4, the results of the correlation method are shown. The five groups contain theresults for the different categories. Within each group, the bars show the meancorrelation coefficient, as calculated by equation (8), for every method. The error barsgive the 95% confidence intervals. To put the scores into perspective, the plotfurthermore shows the inter subject correlation, and the correlation of the human datawith random fixations. The first is depicted by the horizontal gray bars with a solid linegiving the mean and 95% confidence interval. The later is depicted by the horizontaldashed line. All means and confidence intervals are calculated using multi-levelbootstrapping analysis.The inter-subject correlation is calculated for every image by correlating the fixationdensity maps of the participants with the maps of all other participants. This correlationshows how well the human fixations can be predicted using the fixations of otherparticipants. This value gives a relative indication of the performance of the models. Therandom fixation scores are calculated by correlating random fixation density mapscontaining 15 random fixations with the human fixation density maps. Fifteen fixationsare used since this compares to the average number of human fixations per image.
Figure 5: The saliency at human fixation points relative to the average saliency atrandom points. The bars show the mean fixation saliency for the different saliencymodels. The error bars are the 95% confidence intervals.It is important to note that the correlation values are relatively low. The reason for thisis that the photographic images are complex stimuli that generate many fixations. Someof these appear to be random, and pull down the correlation. Some, on the other hand reoccur for every subject, and also have high values for symmetric saliency. This causessignificantly higher than random correlations. To measure the significance of thecorrelations between the model data and human data, they are compared with therandom case for minimal correlation and the inter-subject case for a top performance.The difference between the performance of all models and the random fixations ishighly significant. Figure 4 furthermore shows that the performance for the imagescontaining natural symmetries is significantly higher for the three symmetry models thanfor the saliency model of Itti and Koch. The performance of the symmetry models iseven comparable to the inter-subject correlation. Not only for the images containingexplicit symmetrical forms, also for the other categories have the symmetry modelssignificantly outperformed the contrast model. For these categories too, the performanceis similar to the inter-subject correlation.Among the three symmetry models, there is no significant difference in performance.However, the performance of the radial symmetry model is somewhat higher for theimages containing natural symmetries.Remarkably, for the nature images, the correlations for the symmetry models arehigher than the inter-subject correlation. This can be explained by the higher diversity offixation locations among the participants viewing these images. The images apparentlycontain many similarly interesting points. However, the higher values for the symmetrymodels suggest that the participants do primarily attend to the locally symmetrical parts.For the animal images, there is no significant difference between the symmetrymodels and the contrast model. Different from other images in our experiment, theseimages contain objects on low-contrast backgrounds. This explains the higher consensusamong the participants, and also explains the higher correlation for Itti and Koch’smodel.The results of the fixation saliency analysis are shown in figure 5. The bars show themean fixation saliency as calculated by equation (9). The error bars are the 95%confidence intervals calculated using multi-level bootstrapping. The results confirm the
previous results with the correlation method. For most image categories, the saliency athuman fixation points measured by the symmetry models is significantly higher than thatmeasured by the contrast saliency model. Again, the results are not significantlydifferent for the animal category. Between the symmetry models, no clear differencesexist, although the radial symmetry model performs slightly better.The fact that both methods show a better performance for the symmetry modelsstrengthens the conclusion that local symmetry is a highly significant feature for humans,and that it plays a considerable role in the guidance of eye movements.4 DiscussionInvestigating the role of local symmetry in guiding eye fixations, we developed threesymmetry models and compared them to human fixation data. The performance of themodels was analyzed using two methods and compared to the performance of thecontrast saliency model of Itti and Koch. The results of both analyses show that humanspay attention to local symmetrical patterns more than they pay attention to contrast whenviewing complex photographic images. Furthermore, the correlation results of thesymmetry models are comparable to the inter-subject correlation, which indicates thatsymmetry is a good predictor for human eye fixations.There is no significant difference between the three symmetry models. However, forthe natural symmetries, we see a slightly better performance of the radial symmetrymodel, suggesting a preference of humans for patterns containing multiple symmetryaxes. The addition of color processing, in any case, does not improve the performance.To further investigate the role of symmetry in human vision, we will conduct similarexperiments with artificial stimuli. For instance in line drawings, the role of structuralfeatures like symmetry is expected to be larger since it contains information about form.We furthermore plan to investigate the role of symmetry in artificial vision systems.Specifically, in current robotics, robots navigate in man-made environments containingmany symmetrical patterns. We therefore hypothesize that our symmetry models arewell suited to select interesting visual information for visual navigation.To conclude, the symmetry saliency models that we developed compare well withhuman fixations. The results show that humans are sensitive to symmetrical patterns andpay attention to symmetry.References[1] L. Itti, C. Koch, and E. Niebur, A Model of Saliency-Based Visual Attention forRapid Scene Analysis, IEEE Transactions on Pattern Analysis and MachineIntelligence, vol. 20, pp. 1254-1259, 1998.[2] K. Grammer and R. Thornhill, Human (Home sapiens) Facial Attractiveness andSexual Selection: The Role of Symmetry and Averageness, Journal of ComparativePsychology, vol. 108, pp. 233-242, 1994.[3] C. W. Tyler, The Human Expression of Symmetry: Art and Neuroscience,presented at ICUS Symmetry Symposium, Seoul, 2000.[4] S. E. Palmer, Goodness, Gestalt, Groups, and Garner: Local Symmetry Subgroupsas a Theory of Figural Goodness, in The Perception of Structure. Essays in Honor
][19][20][21]of Wendell R. Garner, G. R. Lockhead and J. R. Pomerantz, Eds. Washington, DC:American Psychological Association, 1991, pp. 23-40.S. E. Palmer and K. Hemenway, Orientation and Symmetry: Effects of Multiple,Rotational, and Near Symmetries, Journal of Experimental Psychology: HumanPerception and Performance, vol. 4, pp. 691-702, 1978.F. L. Royer, Detection of Symmetry, Journal of Experimental Psychology: HumanPerception and Performance, vol. 7, pp. 1186-1210, 1981.J. Wagemans, Parallel Visual Processes in Symmetry Perception: Normality andPathology, Documenta Ophthalmologica, vol. 95, pp. 359-370, 1999.H. B. Barlow and B. C. Reeves, The Versatility and Absolute Efficiency ofDetecting Mirror Symmetry in Random Dot Displays, Vision Research, vol. 19, pp.783-793, 1979.W. Richards and L. Kaufman, "Center-of-Gravity" Tendencies for Fixations andFlow Patterns, Perception & Psychophysics, vol. 5, pp. 81-84, 1969.L. Kaufman and W. Richards, Spontaneous Fixation Tendencies for Visual Forms,Perception & Psychophysics, vol. 5, pp. 85-88, 1969.P. J. Locher and C. F. Nodine, Symmetry Catches the Eye, in Eye Movements:From Physiology to Cognition, J. K. O'Regan and A. Lévy-Schoen, Eds. NorthHolland: Elsevier Science Publishers B.V., 1987.L. Itti and C. Koch, Computational Modelling of Visual Attention, Nature ReviewsNeuroscience, vol. 2, pp. 194-203, 2001.A. M. Treisman and G. Gelade, A Feature-Integration Theory of Attention,Cognitive Psychology, vol. 12, pp. 97-136, 1980.D. J. Parkhurst, K. Law, and E. Niebur, Modeling the Role of Salience in theAllocation of Overt Visual Attention, Vision Research, vol. 42, pp. 107-123, 2002.N. Ouerhani, R. von Wartburg, H. Hügli, and R. Müri, Empirical Validation of theSaliency-based Model of Visual Attention, Electronic Letters on Computer Visionand Image Analysis, vol. 3, pp. 13-14, 2004.O. Le Meur, P. Le Callet, D. Barba, and D. Thoreau, A Coherent ComputationalApproach to Model Bottom-Up Visual Attention, IEEE Transactions on PatternAnalysis and Machine Intelligence, vol. 28, pp. 802-817, 2006.C. M. Privitera and L. W. Stark, Algorithms for Defining Visual Regions-ofInterest: Comparison with Eye Fixations, IEEE Transactions on Pattern Analysisand Machine Intelligence, vol. 22, pp. 970-982, 2000.D. Reisfeld, H. Wolfson, and Y. Yeshurun, Context-Free Attentional Operators:The Generalized Symmetry Transform, International Journal of Computer Vision,vol. 14, pp. 119-130, 1995.G. Heidemann, Focus-of-Attention from Local Color Symmetries, IEEETransactions on Pattern Analysis and Machine Intelligence, vol. 26, pp. 817-830,2004.D. J. Parkhurst and E. Niebur, Scene Content Selected by Active Vision, SpatialVision, vol. 16, pp. 125-154, 2003.A. Olmos and F. A. A. Kingdom, McGill Calibrated Colour Image Database,http://tabby.vision.mcgill.ca., 2004.
Also in art and decoration, symmetry is usually preferred over asymmetry [3]. Furthermore, symmetry is said to increase the figural . specifically, we investigate whether symmetry is a salient feature that guides eye . of all pixel pairs, Γ( )p,