Transcription
Environmental ConservationConnecting protected areas in the Iberianpeninsula to facilitate climate change trackingMario Mingarro1,2cambridge.org/encand Jorge M Lobo11Departamento de Biogeografía y Cambio Global, Museo Nacional de Ciencias Naturales – CSIC, c/ José GutiérrezAbascal 2, 28006 Madrid, Spain and 2RIAMA: Red de Investigadores Actuando por el Medio Ambiente, c/Luarca 9,28231 Las Rozas de Madrid, SpainSummaryResearch PaperCite this article: Mingarro M, Lobo JM (2021)Connecting protected areas in the Iberianpeninsula to facilitate climate change tracking.Environmental Conservation 48: 182–191.doi: 10.1017/S037689292100014XReceived: 26 October 2020Revised: 11 March 2021Accepted: 11 March 2021First published online: 6 May 2021Keywords:climatic connectivity; climaticrepresentativeness; Iberian Peninsula; nationalparks; recipient areasAuthor for correspondence:Mario Mingarro,Email: mario mingarro@mncn.csic.esProtected areas (PAs) are intended to preserve natural places, aiming to sustain ecosystem functionality and preserve biodiversity. However, PAs are spatially static, while major threats tobiodiversity, such as climate and land-use change, are dynamic. The climatic conditions represented in a PA could vanish in the future and appear in other places more or less far away fromthe PA; these places could be considered as recipient areas potentially suited to receive propagules from the source PAs, which tend to lose the climatic conditions that motivated theirprotection. This study estimates the current and future climatic representativeness of mainlandIberian national parks by identifying future areas with a similar climate to those existing now inthe parks and taking into account the degree of anthropogenic alteration and protection. Weidentify a network of ecological corridors connecting Iberian national parks with their recipientareas, as well as discriminating those most conflicting areas that impede network connectivitydue to their degree of land-use transformation. Our results identify important areas for maintaining the climatic representativeness of Iberian national parks in the future, showing a substantial reduction in the climatic representativeness of the Iberian national parks. Althoughmost of the recipient areas now have forest and semi-natural land uses and more than halfof their whole area has protected status, current land uses in the Iberian Peninsula severelyobstruct the corridor network connecting the parks and recipient areas.Introduction The Author(s), 2021. Published by CambridgeUniversity Press on behalf of Foundation forEnvironmental Conservation. This is an OpenAccess article, distributed under the terms ofthe Creative Commons AttributionNonCommercial-ShareAlike licence ),which permits non-commercial re-use,distribution, and reproduction in any medium,provided the same Creative Commons licenceis included and the original work is properlycited. The written permission of CambridgeUniversity Press must be obtained forcommercial re-use.Human pressure on nature is growing, resulting in unprecedented rates of biodiversity loss andnatural landscape degradation (Laurance et al. 2014, Pimm et al. 2014). At present, the speciesextinction rate outpaces the historical background rate by a thousand times (Barnosky et al.2011). One of the principal approaches to preserve natural places has been the declarationof protected areas (PAs), which represent a key strategy to address some of the global environmental challenges. PAs not only play a key role in mitigating threats related to human activity(Rodrigues et al. 2004, Rodríguez-Rodríguez et al. 2019), but they also sustain functional ecosystems and prevent or slow the loss of biodiversity (Joppa et al. 2008, UNEP-WCMC et al.2018). Several studies have underlined the importance of PAs for mitigating the adverse effectsof human development (Watson et al. 2014) and climate change (Hannah et al. 2002a, 2002b,Gaüzère et al. 2016, Lehikoinen et al. 2019) on biodiversity.Due to socioeconomic and/or legal constraints, networks of PAs are usually the consequenceof unplanned selection strategies that often generate spatially fixed and unconnected reservedesigns (Pressey 1994, Joppa & Pfaff 2009). However, nature is dynamic, and the static characterof PAs seriously hinders their capacity to allow the persistence of biodiversity and the maintenance of the ecological processes for which these PAs were declared (Burns et al. 2003, Araújoet al. 2004). This is particularly true for climate (Monzón et al. 2011) and land-cover changes(Hansen & Defries 2007). The ability of static PAs to conserve biodiversity is often questionedbecause, although they mitigate the negative effects within their boundaries, they are oftenextremely pressured on their borders. This frequently leaves PAs as conservation islands(Hole et al. 2009, Wilson et al. 2015) that may hamper the movement of species towards otherareas with suitable climatic conditions, especially when the surroundings of PAs are humandominated (Wessely et al. 2017). In essence, as climate shifts, PAs may tend to lose the particularclimatic conditions represented in them and, as a result, may lose populations or even speciesassociated with the particular set of conditions existing in them. Conversely, the environmentalconditions formerly represented in a PA can appear in other locations outside this protectedterritory. All of these areas harbouring in the future the general environmental conditions currently hosted by a PA can be considered ‘recipient areas’ able to support individuals comingfrom the PA (sensu Mingarro & Lobo 2018). The ‘real’ distribution of species under changingenvironmental conditions is difficult to predict because of the complexity of the factors thataffecting it (Warren et al. 2001, Lobo 2016). Alternatively, the representative 014X Published online by Cambridge University Press
Environmental Conservationregions of each PA can be located under present and future scenarios (Mingarro & Lobo 2018) as a means of increasing the probability of preserving the ecosystem functions and biodiversityrepresented by PAs (Stralberg et al. 2020). Present representativeand future recipient areas may thus be important from a conservation point of view because their protection could facilitate thesafeguarding of the environmental conditions under which eachPA was declared.The identification of corridors and the connection betweenenvironmentally and biodiversity-important areas is a topic thatis recognized as fundamental for the management of biodiversityand environmental resources in the face of climate change (Heller& Zavaleta 2009, Carroll et al. 2015, Choe et al. 2017, Littlefieldet al. 2017, 2019, Lawler et al. 2020, Parks et al. 2020). The capacityof present representative and future recipient areas to act as refugesfor the organisms inhabiting a PA will depend on the availability ofcorridors allowing their connectivity. Thus, it is vital not only tolocate where these climatically representative areas would appearin the future, but also to estimate where the corridors are thatwould connect these PAs with their future recipient areas(Alagador et al. 2012). We believe that performing these two tasksis essential to improving the sustainability of the biodiversity thatPAs seek to safeguard and preserve. In this study, by consideringseveral climatic variables, we delimit the current representative andthe future recipient areas for all of the mainland Iberian nationalparks (INPs) to subsequently delimit the corridors that are able toconnect these parks with their representative and recipient areas.Thus, the main aims of this study are: (1) to estimate the locationand extent of the present and future climatically representativeareas for all of these INPs; (2) to describe the current land coverand conservation status of these areas; and (3) to delimit a networkof corridors to connect these representative (present) and recipient(future) areas with their respective parks. Through all of thesetasks, we hope to offer some guidelines to improve the future sustainability of the Iberian PAs.MethodsStudy areaGeographically isolated in south-western Europe (latitude 36–44 ,longitude 10 and 5 ), the Iberian Peninsula covers an area ofc. 580 000 km2 at the western limit of the Palaearctic region, acrossroads between Africa and Europe, and influenced both bythe North Atlantic Ocean and by the Mediterranean Sea. Thesecharacteristics, together with an orography defined by large mountain ranges, mostly west–east orientated and with elevationgradients spanning 3000 m, have a strong influence on the climate.Thus, the Iberian Peninsula harbours a wide range of climates,including desert, Mediterranean, Alpine and Atlantic.Furthermore, the Iberian Peninsula encompasses two main biogeographical regions: the Mediterranean and Atlantic, with a longitudinal gradient of precipitation and a latitudinal gradient ofprecipitation and temperature (Rivas-Martínez 2005). It is alsoone of the European regions with the greatest diversity of ecosystems, habitats and biodiversity (Ramos et al. 2001), where themountain geography has favoured the occurrence of isolatedendemic species.The INP protection status is among the most restrictive concerning land management according to Spanish legislation. There are tenINPs (Fig. 1(a)); nine belong to Spain (Aigüestortes i Estany de SantMaurici, Ordesa y Monte Perdido, Cabañeros, Monfragüe, Sierrahttps://doi.org/10.1017/S037689292100014X Published online by Cambridge University Press183Nevada, Doñana, Sierra de Guadarrama, Tablas de Daimiel, Picosde Europa) and one to Portugal (Peneda-Gerês). The total INP areais 3982.5 km2 (0.68% of the Iberian Peninsula; Table 1), of which theSierra Nevada is the biggest (859 km2) and Tablas de Daimiel is thesmallest (30 km2). In terms of elevational representativeness, onlytwo of these INPs (Table 1) are below the mean elevation of theIberian Peninsula (1229.46 m above sea level); most of the INPsare in high and mountainous areas, as indicated by their mean elevation and elevational range (Table 1).Current and future INP climatic representativenessWe used the monthly average values of maximum daily temperatures, minimum daily temperatures and total accumulated rainfallduring each month, at 1 km2 resolution, from 1950 to 2007 (seeFelicísimo et al. 2011). The data of these three variables and theequations provided by Valencia-Barrera et al. (2002), LópezFernández and López (2008) and Hijmans et al. (2005) allowedus to build 23 bioclimatic variables. Briefly, we submitted all ofthese variables to a principal component analysis (PCA) that generates three non-correlated factors with eigenvalues higher thanunity, representing 93.5% of all the climatic variability in theIberian Peninsula (see Mingarro & Lobo 2018 for details).Considering each one of these three factors, we selected the originalvariable with the highest factor loading in order to use variableswith clear interpretability. Furthermore, the original variables thatwere poorly represented by the three selected PCA factors were alsoincluded (see Mingarro & Lobo 2018). This process enabled thefinal selection of five climatic variables with little or no correlationto each other: precipitation during the wettest month; annual average temperature; thermal contrast; isothermality; and averagemonthly maximum temperature.Iberian future climatic data are from the WorldClim database(Hijmans et al. 2005) with a 0.86 km2 resolution at the equator. Thedata provide two different temporal scenarios (2050 and 2070)and we chose six different global climate models (GCMs):BCC-CSM1-1 (Xin et al. 2013), CCSM4 (Gent et al. 2011),GISS-E2-R (Nazarenko et al. 2015), HadGEM2-ES (Jones et al.2011), IPSL-CM5A-LR (Dufresne et al. 2013) and MRI-CGCM3(Yukimoto et al. 2012). As the data of the two temporal scenariosoffer very similar results (see Supplementary Figs S1–S4, availableonline), we chose to average them. Thus, we averaged the values ofthe three previously mentioned primary climatic variables (meanmonthly values of maximum daily temperatures, mean monthlyvalues of minimum daily temperatures and monthly precipitation)considering these 12 datasets (2 temporal scenarios 6 climaticmodels) to offer a general picture of the future climate. We assumethat the recipient areas identified using these averaged data couldbe important in the future, regardless of the scenario or time window and despite uncertainties in climate models. We used thederived climatic data to estimate the same five climatic variablesselected in the case of the current climate (precipitation of the wettest month, annual average temperature, thermal contrast, isothermality and average monthly maximum temperature).All of the considered future climatic simulations were generatedin the fifth evaluation report (AR5) according to two scenarios ofrepresentative concentration routes. The RepresentativeConcentration Pathway (RCP) 4.5 scenario represents a population stabilization scenario, with stable or decreasing future greenhouse gas emissions that are associated with increased carbonstocks in forests and a decrease of agricultural land (van Vuurenet al. 2011). In contrast, in the RCP 8.5 scenario, high human
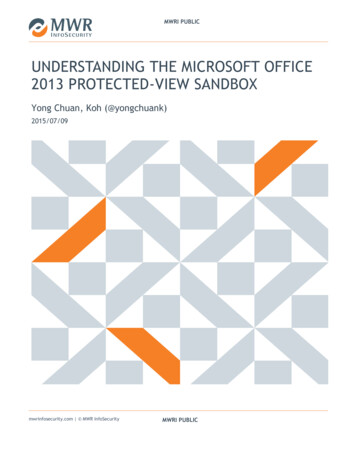
184Mario Mingarro and Jorge M LoboFig. 1. (a) Iberian areas with similar climatic conditions at present to those in at least two Iberian national parks (INPs; in black). (b) Recipient areas (areas that, in the future, willharbour the climatic conditions currently represented by the INPs) for at least two INPs (core areas, in black). The contours of all of the INPs are shown (white polygons), named inorder from north to south OM (Ordesa y Monte Perdido), AE (Aigüestortes i Estany de Sant Maurici), PE (Picos de Europa), PG (Peneda-Geres), SG (Sierra de Guadarrama), M(Monfragüe), C (Cabañeros), TD (Tablas de Daimiel), SN (Sierra Nevada) and D (Doñana). The main Iberian mountain ranges are also shown: P (Pyrenees), L-C (LeonCantabric), D-U (Demanda-Urbión), I (Iberian Central System), G (Gredos), T (Montes de Toledo) and B (Baetics). The following principal valley systems are mentioned in thetext: E (Ebro), D (Duero), J (Júcar) and G 00014X Published online by Cambridge University Press
Environmental Conservation185Table 1. Main geophysical characteristics of the Iberian national parks and Euclidean distances, in kilometres, between each Iberian national park and the Iberianareas that, in the present and future, harbour the climatic conditions currently represented by them. When an Iberian national park loses its climate representativenessin the future, it will not have recipient areas, being represented as D. The acronyms of the Iberian national parks are those of Figure 1. Percentages are based on thetotal area of the Iberian peninsula (583 113 34214256113460700210DDD25662038055924552280185A area in km2; D disappear; E mean elevation (in metres above sea level); ER elevation range (in metres); Max maximum distance; Mean mean distance; Min minimum distance.population growth rate is expected, with constant emissions andboth population and anthropogenic land cover increases (Hurttet al. 2011, van Vuuren et al. 2011). Climatic variables were thuscalculated independently for each one of these two RCP scenarios.We delimited representative (present) and recipient (future)climatic areas for each INP following a previously published methodology (Mingarro & Lobo 2018). The values of the five selectedclimatic variables were used to estimate the Mahalanobis distance(MD) between the conditions in the 1 km2 cells of each INP and thecells of the whole Iberian Peninsula. MD was chosen to measureclimate similarity because this multidimensional measure takesinto account the correlations of the variables and it is scale-invariant regardless of the units used for each variable (Farber &Kadmon 2003, Xiang et al. 2008). The 95th percentile of theMD values obtained in the cells located inside each INP was chosenas the decision threshold to delimit the areas with a climate similarto the one experienced in each INP (hereafter referred as climatically representative areas). In order to facilitate the design of corridors (see below), we reduced the selected MD threshold to the80th percentile in the case of the climatically heterogeneousSierra Nevada National Park to diminish its wide climatically representative area. We added together climatically representativeareas belonging to all of the INPs in order to capture the extentand location of the Iberian areas now harbouring climatic conditions similar to those experienced in the INPs. When these climatically representative areas are shared by at least two INPs, they willbe denominated as ‘core areas’.We used a similar procedure to delimit the recipient areas thatin the future will harbour the climatic conditions currently represented by each INP. In this case, the same five climatic variableswere used to calculate the MD between the current conditionsin the 1-km2 cells of each INP and all of the Iberian cells accordingto the two future RCP climatic scenarios. Once identifiedand mapped, we overlaid the future recipient areas accordingto the RCP 4.5 and RCP 8.5 scenarios to generate a uniquehttps://doi.org/10.1017/S037689292100014X Published online by Cambridge University Pressrepresentation of the probable location of recipient areas(Figs S1–S4 show the locations of recipient areas for each climaticscenario). Afterwards, the derived recipient areas were overlapped with the land-cover data coming from the CORINELand Cover project (2018 data at level 1; see www.eea.europa.eu) to delimit those areas representing in the future the climateof INPs that in turn have a forest or semi-natural land cover.Similarly, we overlapped the obtained recipient areas with theIberian PAs included in the Protected Planet database (www.protectedplanet.net) in order to identify their current conservation status.Creating a corridor networkFor each INP, we created an ecological corridor network by connecting its location and the location of its representative and recipient areas, as described above. We used the Linkage Mapper ArcGIStool for this purpose (McRae & Kavanagh 2011), which is based ona cost–distance methodology considering a resistance surface.Resistance surfaces represent the relative cost, or permeability,of passing through a gridded mapped surface and can be usedto calculate cost-weighted distance away from different patches(Villalba et al. 1998, Zeller et al. 2012). On the one hand, we useda raster file representing the MD between the current conditions inthe 1-km2 cells of each INP and the present conditions of all of theIberian 1-km2 cells. Moreover, we used another raster file representing the MD between the current conditions in the 1-km2 cellsof each INP and the future conditions of all of the Iberian 1-km2cells. These two raster files acted as a resistance surface, thus enabling the creation of corridors. We used cost–distance modelsbecause they are computationally efficient (Adriaensen et al.2003) and allow us to determine routes with the least cost-weighteddistance among the selected patches. The cost value is the cumulative resistance found when moving along the optimal route fromone place to another through the resistance surface (Adriaensen
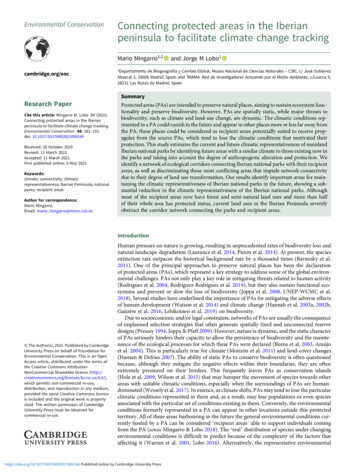
186et al. 2003, McRae et al. 2012). We chose a cost-weighted distancevalue of 10 000 as a threshold to obtain ecological corridors that aremore limited in their extent (see McRae et al. 2012).Once the corridor network was established for each INP, we addedall the corridors together, in accordance with the consideredclimatic scenarios, to obtain a whole corridor network for all of theINPs. In addition, these results are shown, disaggregated by scenarioand by period time, in the Supplementary Material(Figs S4–S8). When two or more corridors overlapped in a 1-km2 cell,we selected the minimum cost value. To reduce the computationaltime, we discarded all of the representative areas with an area smallerthan the smallest INP (Tablas de Daimiel with 30 km2); however, dueto the comparatively small extent of recipient areas, this area limitation was not used. This methodology allowed us to create an ecologicalcorridor network in which all INPs were connected with their corresponding representative and recipient areas.We used the CORINE Land Cover database of 2018 to identifythe possible barriers to the connectivity of INPs with the futurerecipient areas by overlaying this corridor network with the currentanthropogenic land uses. Two kinds of barriers were differentiateddepending on the anthropogenic use of the land: artificial barriersand agricultural barriers. The first is regarded as a land use that actsas a barrier in which return to a natural status is unlikely.Agricultural barriers, on the other hand, are considered a landuse that might become natural.ResultsClimatic representativenessThe current climatic representativeness of the INPs covers 13.6%(c. 79 050 km2) of the total area of the Iberian Peninsula. Most ofthe Iberian mountainous regions are included within this climatically representative area (Fig. 1(a)); the mean elevation of theseareas is 1220 m, with an elevation range of 2199 m. Five areas climatically represent at least two INPs (core areas): the Pyrenees, theLeón-Cantabric Mountains, the Iberian Central System, nearbyareas of the southern Iberian plateau and the Baetic MountainRanges (Fig. 1(a)).Climatically representative areas will decline by 89%(c. 8691 km2) in the future. These future representative or recipientareas will be greatly reduced, both in area and number, or disappear in the south and central part of the Iberian Peninsula as well asin the Pyrenees (Fig. 1(b)). Thus, the main areas in the future arelocated in the Cantabrian and Leon mountains, the GredosMountains and the Demanda and Urbión Mountains.Importantly, the elevational range in these future climatically representative areas declines (1163 m), while the mean elevationincreases notably (1770 m). At present, the distances betweenthe outer border of the INPs and the continuous areas thatrepresent their climate is always zero (Table 1), which means thatall of the INPs have contiguous areas with a similar climate.However, in the future, many of the INPs will lose a large partof these climatically representative areas, and those remaining willappear in places far from the target INP. All of these representativeareas increase their distances from INPs except in the case of theOrdesa y Monte Perdido National Park (Table 1).Present climatically representative areas are almost three-quarters covered by forest and semi-natural areas and a quarter coveredby agricultural areas (Table 2). However, future recipient areas arelocated in areas almost entirely covered by forest and semi-naturalvegetation (Table 2). With regards to the protected status criteria,https://doi.org/10.1017/S037689292100014X Published online by Cambridge University PressMario Mingarro and Jorge M LoboTable 2. Areas of the different land-cover types (km2) for the climaticallyrepresentative areas of all the Iberian national parks in the present andfuture. The percentages in parentheses are calculated based on the totalrepresentative 0 304.8(25.7%)230.4(2.6%)57 3.90(0.61%)5.70(0.07%)Ag agricultural areas; Ar artificial land cover; FsN forest and semi-natural areas;W wetlands; Wb water bodies.future recipient areas covered by forest and semi-natural vegetation that, at the same time, are included in any type of PA categoryrepresent 65% of the total (5481 km2), while c. 2929 km2 (35%)would not be covered by any PA category. The geographical distribution of these areas shows that the Cantabric Mountains atthe north-western region, the Iberian Central System and theUrbión Mountains in the north-central region would be those harbouring the most important recipient areas that are currentlyprotected.Corridor networksThe obtained corridor network allows all of the INPs to connectwith one another, as well as to their corresponding climatically representative areas at present (Fig. 2(a)). The exception is the DoñanaNational Park, which remains isolated in the south-western IberianPeninsula (see Fig. 1), and its representative areas are very close tothe park itself. In total, the INP corridor network connectingpresent climatic representative areas covers almost 36% of theIberian territory (Table 3). Interestingly, this corridor networkconnects most areas of the Iberian Peninsula except the southwestern portion (Fig. 2(a)), and just over half of its area is currentlyunder forest and semi-natural land-cover categories (without agricultural and artificial barriers; Table 3).The area of the corridor network decreases considerablywhen future recipient areas are considered (Fig. 2(b)). Threenational parks (Do ñana, Peneda-Gerês and Aiguestortes) willcompletely lose their climatically representative areas, andindeed, they are located far from the corridor network. Theother two INPs (Picos de Europa and Tablas de Daimiel) willnot have recipient areas in the future, but they could be connected with other PAs due to their proximity to the corridor network. The remaining five INPs will connect with each other andwith their corresponding recipient areas (Fig. 2(b)). All corridors, which at present are spatially dispersed (Fig. 2(a)), couldbe summarized into four main corridors (Fig. 2(b)): (1) thatconnecting the Iberian Central System with the Sierra deGredos to Leon and the Cantabrian mountains range; (2) thatconnecting the Iberian System with the occidental part of thePyrenees; (3) that which joins the Baetic Mountains ranges withthe Iberian System; and (4) that which allows the connectionbetween the Baetic Mountain ranges and the Mediterraneannational parks (Cabañeros and Monfragüe), located in theToledo mountains (see Fig. 1(a)). Although the area of this corridor network decreases moderately in the future scenario, representing 32% of the Iberian area, half of this area is againcurrently covered by forest and semi-natural land uses(Table 3). Furthermore, the global cost-weighted distance meanis lower than in the network corridor connecting INPs at presentwith their climatically representative areas (Table 3).
Environmental Conservation187Fig. 2. Network of corridors climatically connecting Iberian national parks with (a) their present representative areas and (b) their future recipient areas. The light grey (low) todark grey (high) colour gradient indicates cost-weighted distance values. A lower cost-weighted distance value implies a better aptitude for corridor development. Light greypathways show the corridors with lower cost-weighted distance values.The areas most conflicting and preventing of network connectivity with the future recipient areas can be discerned by examiningthe current extent of artificial and agricultural land uses within thehttps://doi.org/10.1017/S037689292100014X Published online by Cambridge University Presscorridor network. These main barriers to connectivity are locatedin the main Iberian basins (Fig. 3): Duero and Tajo (B1), Ebro (B2),Jucar (B3) and Guadalquivir (B4). These valleys, subject to
188Mario Mingarro and Jorge M LoboTable 3. Basic statistics of the corridor network connecting Iberian nationalparks with their climatically representative areas at present and for the future(recipient areas).AAAAAACWCWACWAAPresent214 31821.1712.21193 818121 555(56.72%)99 114(51.14%)21.43Future211 716(98.79%)191 597(98.85%)19.4219.2110.28A total area (in km2); AA total area without artificial barriers (km2 and percentage withrespect to the total corridor network area); AAA total area without artificial and agriculturalbarriers (km2 and percentage with respect to the total corridors network area); CW mean ofthe cost-weighted distance of the total area; CWA mean of the cost-weighted distance of thetotal area without artificial barriers; CWAA mean of the cost-weighted distance of the totalarea without artificial or agricultural barriers.substantial and ancient human impact, would seriously compromise the connectivity of INPs with the areas that in the future willharbour their current climatic conditions.DiscussionAlthough many approaches have been proposed to identify areaswhose conservation would facilitate biodiversity persistence in theface of climate change (Lawler et al. 2015, 2020, Alagador et al.2016, Jones et al. 2016), this study attempts to offer a different perspective. Our approach aims to promote the sustainability andconservation of PAs by considering their abiotic/climatic characteristics and the expected effects of climatic changes in altering theoriginal environmental profile under which these PAs were established. We demonstrate here that the location and extent to whichareas representing the climatic conditions of the Iberian nationalparks could in the future undergo a drastic transformation. Theareas representing in the future the present climatic conditionsof the INPs will be located c. 500 m higher in altitude and couldhave a total area nine times smaller than the areas representingthe contemporary climate. Furthermore, half of the consideredINPs will lack an equivalent climatic area on the IberianPeninsula, and the climatically representative areas of
peninsula to facilitate climate change tracking. Environmental Conservation 48:182-191. doi: 10.1017/S037689292100014X Received: 26 October 2020 Revised: 11 March 2021 Accepted: 11 March 2021 First published online: 6 May 2021 Keywords: climatic connectivity; climatic representativeness; Iberian Peninsula; national parks; recipient areas