Transcription
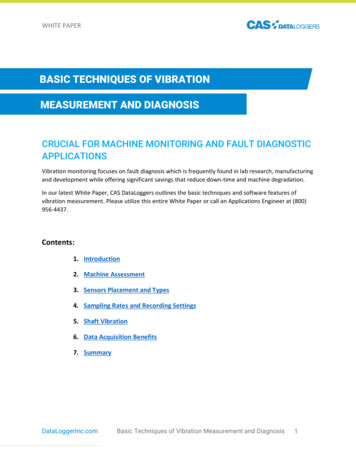
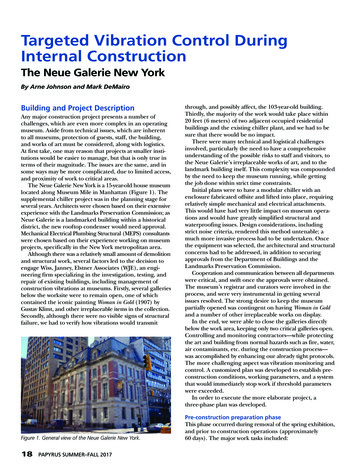
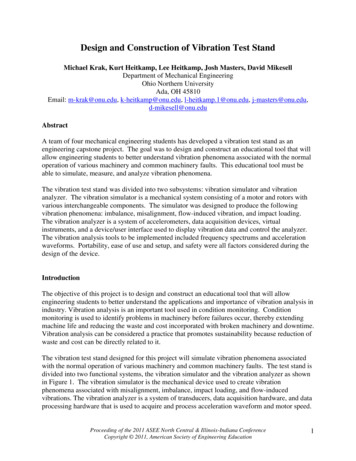
Design and Construction of Vibration Test StandMichael Krak, Kurt Heitkamp, Lee Heitkamp, Josh Masters, David MikesellDepartment of Mechanical EngineeringOhio Northern UniversityAda, OH 45810Email: m-krak@onu.edu, k-heitkamp@onu.edu, l-heitkamp.1@onu.edu, j-masters@onu.edu,d-mikesell@onu.eduAbstractA team of four mechanical engineering students has developed a vibration test stand as anengineering capstone project. The goal was to design and construct an educational tool that willallow engineering students to better understand vibration phenomena associated with the normaloperation of various machinery and common machinery faults. This educational tool must beable to simulate, measure, and analyze vibration phenomena.The vibration test stand was divided into two subsystems: vibration simulator and vibrationanalyzer. The vibration simulator is a mechanical system consisting of a motor and rotors withvarious interchangeable components. The simulator was designed to produce the followingvibration phenomena: imbalance, misalignment, flow-induced vibration, and impact loading.The vibration analyzer is a system of accelerometers, data acquisition devices, virtualinstruments, and a device/user interface used to display vibration data and control the analyzer.The vibration analysis tools to be implemented included frequency spectrums and accelerationwaveforms. Portability, ease of use and setup, and safety were all factors considered during thedesign of the device.IntroductionThe objective of this project is to design and construct an educational tool that will allowengineering students to better understand the applications and importance of vibration analysis inindustry. Vibration analysis is an important tool used in condition monitoring. Conditionmonitoring is used to identify problems in machinery before failures occur, thereby extendingmachine life and reducing the waste and cost incorporated with broken machinery and downtime.Vibration analysis can be considered a practice that promotes sustainability because reduction ofwaste and cost can be directly related to it.The vibration test stand designed for this project will simulate vibration phenomena associatedwith the normal operation of various machinery and common machinery faults. The test stand isdivided into two functional systems, the vibration simulator and the vibration analyzer as shownin Figure 1. The vibration simulator is the mechanical device used to create vibrationphenomena associated with misalignment, imbalance, impact loading, and flow-inducedvibrations. The vibration analyzer is a system of transducers, data acquisition hardware, and dataprocessing hardware that is used to acquire and process acceleration waveform and motor speed.Proceeding of the 2011 ASEE North Central & Illinois-Indiana ConferenceCopyright 2011, American Society of Engineering Education1
Vibration TestStandVibration AnalyzerAccelerometersVibration SimulatorRotors/ShaftConfigurationsMotorData AcquisitionHardwareImbalanceSpeed ControllerVirtual InstrumentImpact/SliderCrankTachometer andDisplayDisplay ibrationFigure 1: Vibration Test Stand ComponentsThe vibration test stand is being designed and constructed by four mechanical engineeringstudents. Two students are primarily designing and constructing the vibration simulator. Theother two students are primarily designing the vibration analyzer.CapabilitiesTo better define the functions of the vibration test stand, the following capabilities wereidentified: The vibration test stand must be able to demonstrate vibration phenomena associated withthe following common machine faults: Rotating imbalance Shaft misalignment Parallel Angular Parallel and angular combined Impact and slider crank vibration Flow-induced vibrationThe vibration test stand must be able to demonstrate vibration phenomena associated withnormal machine operation (i.e. healthy operation).The vibration test stand must be able to collect, process, and display vibration data.The vibration test stand must be able to display vibration data in both the time domainand frequency domain.Proceeding of the 2011 ASEE North Central & Illinois-Indiana ConferenceCopyright 2011, American Society of Engineering Education2
The vibration test stand is to be used as a lab tool and should conform to a “table top”layout.RequirementsTo fulfill the desired capabilities, the following design requirements were determined: The vibration test stand should fit and fully operate on a table top.The vibration test stand should be easily assembled and disassembled.The vibration test stand must be able to change between functional configurations withina time of 10 minutes.The vibration test stand must not weigh more than 70 lb to maintain portability.The vibration test stand must be powered by standard 120V AC. Accelerometer powersupplies will be powered by 9V batteries.The vibration test stand must be operable at various speeds and the operating speed mustbe monitored by a tachometer.Viable DesignsThree viable designs were considered for both the vibration simulator and the vibration analyzer.Variations in the vibration simulator designs included component choice and component layout.Variations in the vibration analyzer designs included the number and type of accelerometers,necessary power supplies and type of data acquisition hardware. Pugh‟s Method was used todetermine the best design for each system.Pugh‟s Method is a design selection strategy which compares characteristics of competingdesigns. The first step in Pugh‟s Method is to determine all characteristics relevant to fulfillingthe purpose and desired abilities of the design. One of the competing designs is then selected asa reference and the characteristics of all other designs are compared to this reference. If adesign‟s specific characteristic is considered less desirable than the reference then the designreceives a score of -1 for that characteristic. If a design‟s characteristic is considered moredesirable than the reference then the design receives a score of 1 for that characteristic. Thedesign with the greatest total score is considered to be the best design.Vibration Simulator – Viable DesignsThe first vibration simulator will include a motor coupled to one of three shafts. The first shaftwill be used to simulate imbalance. It will have an inertial disk with threaded holes locatedradially around the shaft so that various degrees of imbalance can be represented. This shaft willalso be used to transmit power to a fan, to demonstrate flow-induced vibration. The second shaftwill be used to simulate the inertial loading of a slider crank. The third shaft will simulate threetypes of shaft misalignment: axial, angular, and a combination of the two. For each condition theProceeding of the 2011 ASEE North Central & Illinois-Indiana ConferenceCopyright 2011, American Society of Engineering Education3
vibrations will be measured and the frequency spectrum will be found and recorded using aLabVIEW virtual instrument.The second design of the vibration simulator is similar to the first design in every aspect exceptflow-induced vibration will be demonstrated by a centrifugal water pump instead of a fan. Thethird design of the vibration simulator is similar to the first design except the number of shafts isreduced from three to two. One shaft will be used to demonstrate rotating imbalance, slidercrank, and flow-induced vibrations and the second shaft will be used to demonstrate shaftmisalignment.The three vibration simulator designs were evaluated on five characteristics: weight, cost, safety,motor placement, and portability. A better design was considered to have lower weight, lowercost, higher safety, fewer motor positions, and more portability. The best design was found to beDesign #3. Full results of the evaluation are in Table 1.Table 1: Pugh’s Method for the Vibration SimulatorEngineeringCharacteristics andDesignDesignDesignCustomerOption 1Option 2 Option 3RequirementsWeight Cost SafetyS SEase of Motor PlacementPortability Sum of „ ‟004Sum of „-‟-400Total S-304Reference (value 0)Less desirable than reference (value -1)More desirable than reference (value 1)Equally desirable to reference (value 0)Vibration Analyzer – Viable DesignsThe first vibration analyzer design consists of two tri-axis accelerometers, each requiring adedicated power supply. The accelerometers will be equipped with magnets for mounting to teststand components. The National Instruments data acquisition module for these accelerometerswill be a 16-bit analog input module (NI 9215). This module has pin connections and will notprovide excitation voltage to the accelerometers.The second design of the vibration analyzer consists of one tri-axis accelerometer equipped witha magnet for mounting to test stand components. The National Instruments data acquisitionProceeding of the 2011 ASEE North Central & Illinois-Indiana ConferenceCopyright 2011, American Society of Engineering Education4
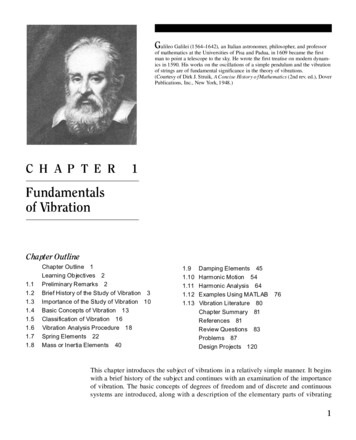
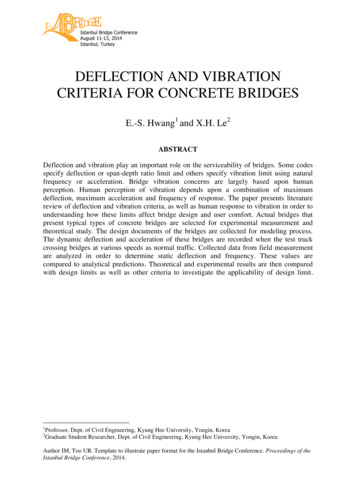
module for this accelerometer will be a module specified for accelerometers, NI 9233. The NI9233 uses bulkhead connectors and provides excitation voltage for the accelerometer,eliminating the need for a dedicated accelerometer power supply.The third design consists of two single axis accelerometers, each requiring a dedicated powersupply. The accelerometers will be equipped with magnets for mounting to test standcomponents. The National Instruments data acquisition module for these accelerometers will bea 16-bit analog input module (NI 9215). This module has pin connections and will not provideexcitation voltage to the accelerometers.The three vibration analyzer designs were evaluated on three characteristics: cost, number ofaccelerometer axes, and complexity. A better design was considered to have lower cost, lowercomplexity, and a greater number of axes. The best design was found to be Design #3. Fullresults of the evaluation are in Table 2.Table 2: Pugh’s Method for the Vibration AnalyzerEngineeringCharacteristics andDesignDesignDesignCustomerOption 1Option 2 Option 3RequirementsCost Complexity Number of Axes Sum of „ ‟102Sum of „-‟-20-1Total S-101Reference (value 0)Less desirable than reference (value -1)More desirable than reference (value 1)Equally desirable to reference (value 0)Vibration Simulator – Proposed DesignThe proposed design of the vibration test stand compromises of vibration simulator design #3and vibration analyzer design #3. The design of the vibration simulator will include a motorcoupled to one of two shafts. One shaft will be used in three different configurations. The firstconfiguration will have inertial disks with threaded holes located on a bolt circle around the shaftso that various degrees of imbalance can be demonstrated (Figure 2). The next configurationwill transmit power to a fan to demonstrate a flow-induced vibration (Figure 3). The fan willhave a removable partial louver to cause resistance against the fan blades. Fan blade resistancewill demonstrate a vibration phenomenon known as vane pass vibration. The third configurationwill be used to simulate the inertial loading of a slider-crank (Figure 4). This configurationconsists of a crank mounted to the end of the shaft, slider, and spring.Proceeding of the 2011 ASEE North Central & Illinois-Indiana ConferenceCopyright 2011, American Society of Engineering Education5
Figure 2: Vibration Simulator Imbalance ConfigurationBoth shafts are ½” diameter steel and are coupled to the motor with a flexible spider coupling.The spider coupling was chosen so that vibrations from the motor would be dampened and itprovides for quick change over between configurations. The imbalance, slider-crank, and flowinduced vibration configurations use self-aligning ball bearings. Self-aligning ball bearings werechosen to compensate for misalignment. The imbalance configuration uses two inertial diskswhich can be located at any position between the bearings. The inertial disks have eight ½”tapped holes on a 2” bolt circle into which ½” set screws may be threaded. These set screws areused as imbalance masses. The different types of imbalance can be achieved through thelocation of the inertial disks on the shaft and the location of the set screws on the disks.Proceeding of the 2011 ASEE North Central & Illinois-Indiana ConferenceCopyright 2011, American Society of Engineering Education6
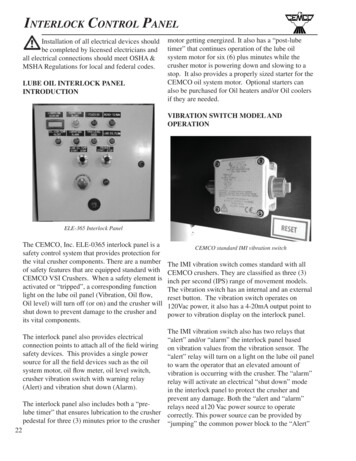
Figure 3: Vibration Simulator Flow-Induced ConfigurationThe flow-induced vibration configuration (Fig. 3) uses a 6” diameter 4-blade fan which producesa flowrate of 320 cfm at 4200 rpm1. The fan will not operate at rated speed, but at the maximumspeed of the motor (1800 rpm). A four blade fan was chosen because the vane pass vibrationphenomenon occurs at a frequency equal to the product of the shaft frequency and number ofvanes of the rotating element. Using a fan with few blades lessens the need for an extremelyhigh sampling rate for accelerometers, data acquisition hardware, and data processers. Becausethe fan requires a 3/16” shaft attachment, a removable ½” to 3/16” adapter was designed toattach to the end of the main driving shaft. The fan is covered in a protective shroud to preventuser injury. A removable partial louver was designed to cover the lower half of the fan outlet.The partial louver will cause resistance on the fan blades and thereby increase the magnitude ofthe vane pass vibration.Proceeding of the 2011 ASEE North Central & Illinois-Indiana ConferenceCopyright 2011, American Society of Engineering Education7
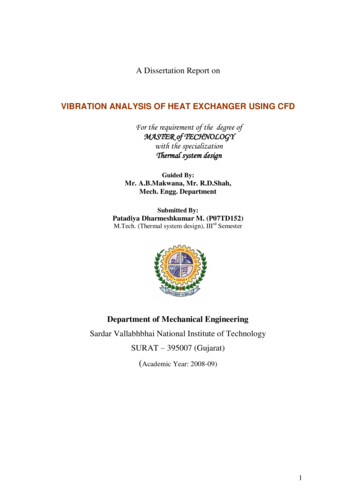
Figure 4: Vibration Simulator Slider-Crank ConfigurationThe slider-crank configuration (Fig. 4) consists of a crank, coupler, slider, mounting block, andbronze bushings. The crank has a 2” stroke-length, the coupler is 3.25” from pin-to-pin, and theslider is 7.125” from pin-to-end. Bronze bearing inserts were used for the pin-joints and slidingjoint. A clevis rod end was used to connect the slider to the coupler.Proceeding of the 2011 ASEE North Central & Illinois-Indiana ConferenceCopyright 2011, American Society of Engineering Education8
Figure 5: Vibration Simulator Misalignment ConfigurationThe misalignment configuration (Fig. 5) consists of two shafts connected by a helical beam shaftcoupling, one permanent bearing block, one interchangeable bearing block (four options), andradial ball bearings. The helical beam shaft coupling was chosen because it allows for 10 ofangular misalignment and 0.04” of parallel misalignment between shafts2. Misalignment is to besimulated through the use of four different bearing blocks. Each block is designed to simulateone of the following phenomena: parallel misalignment, angular misalignment, parallel andangular misalignment, and no misalignment. The blocks were designed to utilize 50% of theangular misalignment tolerance and 100% of the parallel misalignment tolerance of the coupling.The motor used to drive the vibration simulator was chosen based on requirements of the systemand requirements of other simulator components. The motor was required to be variable speed(100-1800 rpm), be powered by 120V AC, and provide a minimum torque of 0.5 lb-ft. Theminimum torque was determined by finding the maximum torque required by the vibrationsimulator. The maximum torque was equivalent to the sum of the maximum torque required bythe slider-crank and the rolling resistance of the self-aligning bearings. The maximum torque ofthe slider-crank was found through calculation and the rolling resistance of the bearings wasfound through measurement.The motor chosen for the vibration simulator was a 0.25 hp Marathon microMAXTM AC InverterDuty Motor. An inverter duty motor was chosen to prevent overheating at low operating speeds.The motor requires 230V three phase input which will be provided by a three phase variablefrequency drive which requires 120V single phase input3. The variable frequency drive will beused to vary the speed of the motor.Proceeding of the 2011 ASEE North Central & Illinois-Indiana ConferenceCopyright 2011, American Society of Engineering Education9
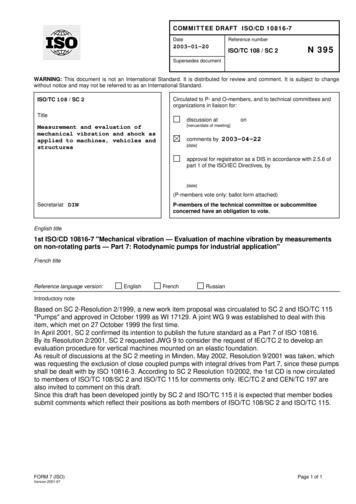
Vibration Analyzer – Proposed DesignThe vibration analyzer design consists of two single axis accelerometers, each requiring adedicated power supply. The accelerometers chosen for the vibration analyzer are PCBPiezotronics industrial grade accelerometers. These accelerometers are integrated circuitpiezoelectric accelerometers and are capable of measuring a range from 1 to 10,000 Hz. Theaccelerometers will be equipped with magnets for mounting to test stand components. Theaccelerometers are powered with a 9 volt battery powered signal conditioner4.A proximity sensor was chosen to serve as the tachometer. It was chosen because it was a nonobstructive way of measuring the motor speed.The National Instruments data acquisition module chosen for the vibration analyzer is the 16-bitanalog input module5. The carrier chosen for the data acquisition module is Hi-Speed USBCarrier. The module and carrier provide communication between the transducers and the dataprocessor6.The data processor and user interface is a LabVIEW Virtual Instrument. The virtual instrumentallows the user to select the sampling rate of the data acquisition hardware and the period toexamine acceleration data. Based on voltage input from the data acquisition hardware the dataprocessor calculates motor speed and converts the acceleration data from time domain tofrequency domain.Motor speed is calculated by comparing the voltage output from the proximity sensor to athreshold voltage. Digital logic is used to determine the number of voltage spikes per samplingperiod. This data is then converted to revolutions per minutes. Acceleration data was convertedfrom time domain to frequency domain using a Hanning Digital Fourier Transform. Theamplitude of the acceleration in frequency domain is the root mean square of the acceleration inthe time domain.The virtual instrument front panel, shown in Figure 6, consists of acceleration waveforms andfrequency spectrums, tachometer display, knobs for period and sampling rate adjustment, dataexport option, and an on/off switch.Proceeding of the 2011 ASEE North Central & Illinois-Indiana ConferenceCopyright 2011, American Society of Engineering Education10
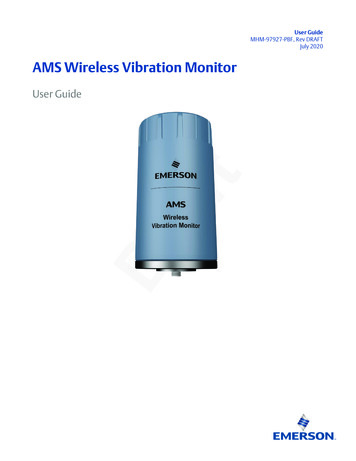
Figure 6: Vibration Analyzer Front PanelValidationSystem testing was conducted after the completion of the vibration analyzer and the rotatingimbalance portion of the vibration simulator. A photograph of the vibration simulator in therotating imbalance configuration is shown in Figure 7. A set screw was placed in each inertialdisk in identical positions. The disks were placed so that there was equal distance between thebearings and disks. The simulator was set to run at full operating speed of 1800 rpm (30 Hz).The tachometer displayed a rotational speed that varied between 1750 rpm and 1800 rpm. Anaccelerometer was placed on top of each bearing to measure vibration in the vertical direction.The acceleration waveform and frequency spectrum were similar for each. As expected, a largeacceleration was detected at running speed (30 Hz), as shown in Figure 9.Figure 7: Vibration Test Stand with Imbalance ConfigurationProceeding of the 2011 ASEE North Central & Illinois-Indiana ConferenceCopyright 2011, American Society of Engineering Education11
Figure 8: Acceleration Waveform of Bearing in Vertical Direction Under Rotating Imbalance (1800 rpm)Figure 9: Acceleration Frequency Spectrum of Bearing in Veritcal Direction Under Rotating Imbalance (1800 rpm)Future WorkProposed additions to the vibration test stand include the installation of a centrifugal pump, ordertracking filter, and modal analysis option. The inclusion of a centrifugal pump will be used todemonstrate the vibration phenomena associated with cavitation. Vibration caused by cavitationis non-synchronous and has a “raised floor,” meaning that the vibration frequency spectrum willnot return to a near zero value over a range of frequencies. Non-synchronous vibration occurs atfrequencies which are not multiples of the operating speed of the machine. These multiples ofoperating speed are also called orders.An order tracking filter eliminates vibrations which occur between multiples of the operatingspeed which will allow users to more easily identify synchronous vibrations. The inclusion of amodal analysis function, which uses an impulse mallet, will allow students to measure the naturalfrequencies of static elements.ConclusionThe objective of this project is to design an educational tool that will allow engineering studentsto better understand vibration phenomena associated with the normal operation of variousmachinery and common machinery faults. Students will use acceleration waveforms andfrequency spectrums to observe shaft misalignment, imbalance, impact loading, and flowinduced vibrations. The vibration test stand will teach students the use of vibration analysis as aProceeding of the 2011 ASEE North Central & Illinois-Indiana ConferenceCopyright 2011, American Society of Engineering Education12
condition monitoring tool. Condition monitoring is a common practice in industry and is acrucial part to improving machine health. This vibration test stand demonstrates the industrialapplication of engineering principles.The vibration test stand is divided into two functional subsystems, the vibration simulator andthe vibration analyzer. The vibration simulator is a mechanical system that will demonstratevibration phenomena and the analyzer is a system of accelerometers, data acquisition hardware,and data processing software. The division of the vibration test stand allows it to be priced astwo separate systems.References[1]Part No. 17545K31, McMaster-Carr, http://www.mcmaster.com/#17545k31/ bhjarj, Accessed October 15,2010.[2]Part No. 6208K9, McMaster-Carr, http://www.mcmaster.com/#6208k9/ bhjd30, Accessed October 8,2010.[3]Part No. Y500, AutomationDirect, smicromax.pdf,Accessed January 22, 2011.[4]Model 608A11, PCB Piezotronics, http://www.pcb.com/spec sheet.asp?model 608A11&item id 10434,Accessed October, 25, 2010.[5]NI 9215 4-Channel, 100 kS/s/ch, 16-bit, 10 V Analog Input Module, National Instruments, 793, Accessed October 1, 2010.[6]NI USB-9162 C Series USB Single-Module Carrier, National Instruments, 178, Accessed October 1, 2010.Proceeding of the 2011 ASEE North Central & Illinois-Indiana ConferenceCopyright 2011, American Society of Engineering Education13
The vibration test stand must not weigh more than 70 lb to maintain portability. The vibration test stand must be powered by standard 120V AC. Accelerometer power supplies will be powered by 9V batteries. The vibration test stand must be operable at various speeds and the operating speed must be monitored by a tachometer. Viable Designs