Transcription
Some Measurements on DVB-T Dongles with E4000 and R820T Tuners:Image Rejection, Internal Signals, Sensitivity, Overload, 1dB Compression, IntermodulationAugust 2013HB9AJGContents:1. Motivation2. Test Setup3. Image Rejection4. Internal Signals5. Sensitivity6. Overload and 1dB Compression7. Intermodulation8. Aliasing9. Summary10. What do we learn from these tests?1. MotivationAfter having read quite a few posts in the user group http://uk.groups.yahoo.com/group/SDRSharp about the sensitivity or "deafness" of these dongles, but not having come across any figures, I feel constrained to post the results ofmy tests. I have measured two types of dongles:- a Terratec dongle, containing an E4000 tuner and the RTL2832,VID PID 0CCD 00D7, designated E4000 further down.- a "no name" dongle marked "DVB-T DAB FM ", containing an R820T tuner and the RTL2832,VID PID 0BDA 2838, designated R820 further down.2. Test SetupInstruments used:- HF Signal Generators HP8657A (0.1 1040MHz) and HP8640B (0.5 520MHz)- AF Voltmeter HP333A.Software used: SDR# v1.0.0.135Settings:- Configure: 2.048MSPS, RTL AGC off, Tuner AGC off, RF Gain max (49dB for the R820, 42dB for the E4000)- Radio: CW-U, Bandwidth 500Hz, Filter Order 300- AGC off- FFT Display: Window Blackman-Harris, Resolution 262144.- In the spectrum display the noise floor appears at about -40dBm. In order to display the levels of received signalscloser to reality, in SDRSharp.exe.Config I modified the value -40.0 in line add key "fftOffset"value "-40.0" to"-120.0".Having been an HF engineer and a ham radio operator for over 40 years, I am used to measure receiver sensitivity indBm. I am aware of those UHF enthusiasts who are used to rate their receivers by Noise Figure (NF). It is easy to gofrom dBm to NF, however, by using the formula:NF Power of the MDS (dBm) 174dBm - 10log(Bandwidth) - Measured S/N.Example:MDS (Minimum Discernible Signal) Signal giving an (S N)/N of 3dB (measured with the AF Voltmeter).10log(Bandwidth) in my measurements is 10log(500) 27dB.For (S N)/N 3dB, S is equal to N. Thus, S/N is 0dB.So, for an MDS of, say, -140dBm: NF -140 174 - 27 - 0 7dB.Remark 1: The dongles have a nominal input impedance of 75 Ohms, whereas my signal generators have outputimpedances of 50 Ohms. My dBm figures take account of the difference of 1.6dB.Remark 2: The measurements were carried out on one dongle of each type only. Of course, the results may vary byseveral dBs between individual dongles.Remark 3: In such measurements uncertainties of /-1 2dB are common.
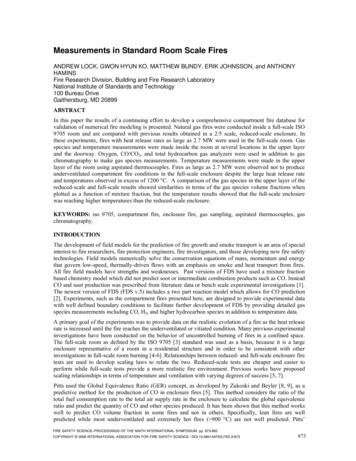
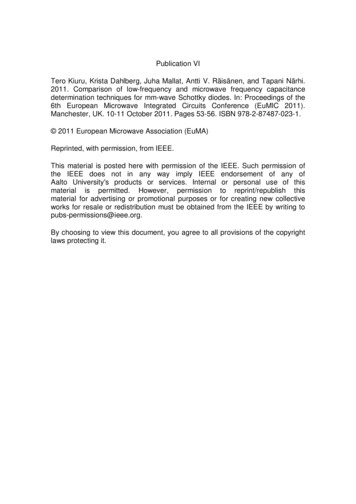
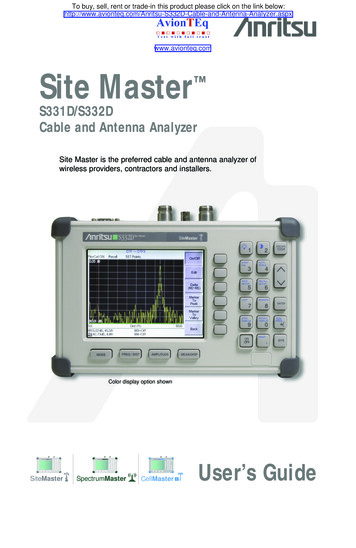
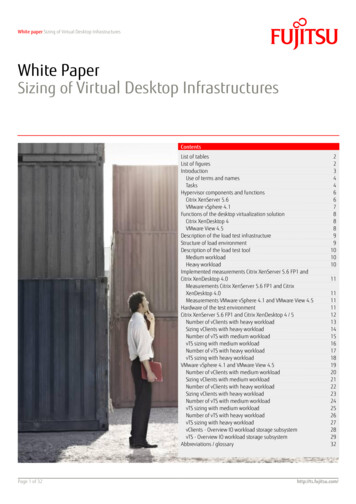
3. Image RejectionThe E4000 is a direct conversion receiver; therefore, a "hump" is clearly visible in the center of the spectrumdisplay. It is mostly due to noise on the power source of the dongle, and could probably be reduced by a well filtered,external power supply (I did not try this). The R820 first mixes down to an IF of a few MHz, and, therefore, does notshow such a hump.Both dongles present a peak in the center of the spectrum display of SDR#, which for the E4000 can be reduced, andfor the R820 can be (almost) eliminated by marking Correct IQ.For the E4000, marking Correct IQ improves the image rejection by about 30dB. Without Correct IQ the image rejecttion of the E4000 is a poor 21dB (measured on 435MHz), with Correct IQ it reaches a more or less acceptable 50dBs.This means that for signals lower than about -90dBm no image will be visible any more in the spectrum display.Because of the different technology, the R820 does not have the same image rejection problem. Therefore, markingCorrect IQ has no effect (except for the peak in the center of the spectrum display).4. Internal signalsIn digital receivers clock signals, poor shielding (space requirements!) and digital processing produce internal signalsactually not present at the antenna input ("birdies" in ham speak). Since the dongles are not shielded, I wrapped themin aluminum foil connected to the PC ground. Figures 1 and 2 show typical examples. Harmonics of the clock frequency are quite strong and clearly visible up to at least 1GHz. Regarding birdies, the R820 is much cleaner than theE4000.Figure 1E4000: 7th harmonic of the clock frequency 28.8MHz and other "birdies".Figure 2R820: 7 harmonic of the clock frequency 28.8MHz and a few, weak birdies.Also note the missing "hump" in the center.thIt is easy to recognize birdies: most of them (except the harmonics of the clock, of course) vary their frequency whenmoving the spectrum window in frequency. Many of them even move up if you move the window down in frequency.5. SensitivityDefinition of sensitivity:MDS (Minimum Discernible Signal) 3dB (S N)/N, measured with the HP333A.My signal generators only go up to 1040MHz, therefore no measurements were possible on higher frequencies. Usingharmonics of the generators, I was able to verify that my E4000 had a range of 51.850 2080MHz, with a gap of1105 1268MHz. My R820 had a range of 24 1766MHz without a gap.
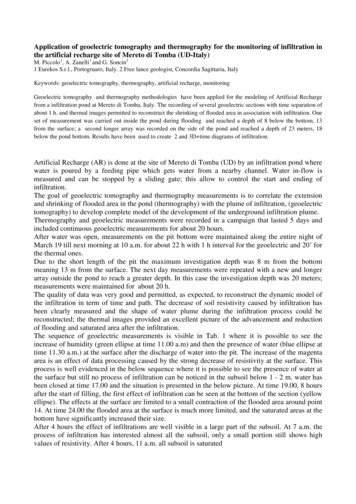
FrequencyMHz24521101454357001000Table 1Sensitivity E4000dBmn.a.-139-139-141-139-136-129Sensitivity rk: The figures are for signals about in the middle between the left edge and the center of the spectrum display.At the edges the sensitivity is a few dBs less.Both dongles are very sensitive. Between 50 and about 500MHz the E4000 is about 5dB more sensitive than theR820, but at 1000MHz the E4000 is about 8dB less sensitive compared to the R820.6. Overload and 1dB Compression6.1 OverloadFigures 3 and 4 show the effects of a single, strong signal within the window of the spectrum display:Figure 3 E4000: Just before overload at 145MHz/-64dBm (the other signals are "birdies" and aliasing products)Figure 4 E4000: Overload at 145MHz/-63dBm: a multitude of "phantom signals" pop upThe "phantom signals" pop up suddenly, within an increase of the level of the strong signal of only 1dB.At 145 MHz turning on RTL AGC surprisingly degrades the overload limit by about 5dB. Then reducing the gainimproves the overload limit, but not by the same amount the gain is reduced. Turning on Tuner AGC and maintainingfull gain has no effect on the overload limit. And if the gain is then reduced, the overload limit does not improve at all.At 435MHz the behavior is the same.The effects of overload of the R820 are similar to Figure 4. At 145MHz turning on RTL AGC and maintaining full gaindegrades the overload limit by 1 2dBs. Then reducing the gain improves the overload limit by about the sameamount the gain is reduced. Turning on Tuner AGC is to be avoided: it degrades the overload limit by about 10dBs,independent of the gain setting.At 435MHz turning on RTL AGC and maintaining full gain improves the overload limit by 1 2dBs. Then reducing thegain improves the overload limit by about the same amount the gain is reduced. Turning on Tuner AGC is to beavoided: it degrades the overload limit by about 10dBs, independent of the gain setting.For both dongles it seems there is nothing to be gained from activating RTL AGC or Tuner AGC.
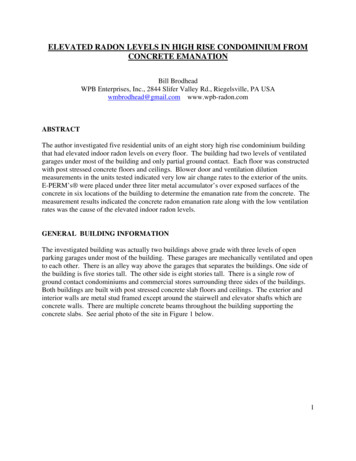
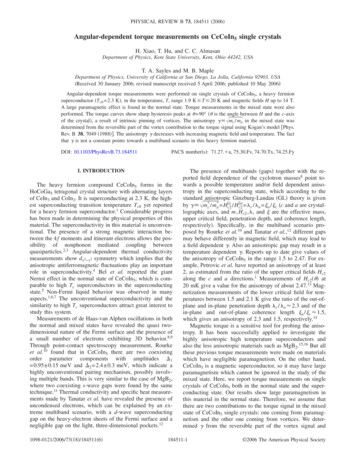
6.2 1dB CompressionThe block diagrams of both dongles show an RF filter after the preamplifier. These filters (and also the subsequentdigital signal processing) should help to improve the overload limit as the strong signal is moved away from the centerfrequency of the spectrum display.But the level of such a strong input signal cannot be increased without limits, because the preamplifier will saturate atsome point (and, ultimately, will give smoke signals), hence reducing the S/N ratio of a desired signal. It is commonpractice to determine the level of a strong signal that causes a reduction of the S/N ratio of a desired signal by 1dB.I tried to measure the overload limit and/or the 1dB compression limit for two center frequencies of the spectrumdisplay, 145MHz and 435MHz. The desired signal was close to the center frequency with a level of -80dBm. If overload occurs like in Figure 4, the limit can be determined quite accurately (within 1 2dB). For strong signals furtheraway from the desired signal, the limit is not that well defined anymore, because then the effect of overload becomesweaker, and finally only a handful of "new" signals pop up in the display. In these cases I chose the 1dB compressionas the limit. The following figures show overload and/or 1dB compression limits for both dongles, and for centerfrequencies of 145MHz and -300 -100-10-10MHz 1 10-80 100 300-300 -100Figure 5 Overload/1dB Compression at 145MHzDesired signal -80dBm at 145.03MHzE4000 R820 Figure 6-10-10MHz 1 10 100 300Overload/1dB Compression at 435MHzDesired signal -80dBm at 435.03MHzE4000 R820 For a weaker desired signal of only -120dBm the measured values differed by only about /-1dB for both centerfrequencies and for both dongles. I was very surprised by these results; I had expected the preamplifier to overload atmuch lower signal levels.The figures show that the digitally tuned filters (and the subsequent digital signal processing) of both dongles improvethe overload/1dB compression limit considerably. The filters are more or less symmetric.The filter of the E4000 is about /-0.8MHz wide, but less steep than the filter of the R820. Surprisingly, at 435MHz thefilter is a bit steeper than at 145MHz. Within this bandwidth a signal of about -64 -62dBm causes overload. At about /-5MHz 1dB compression becomes the limiting effect.The filter of the R820 is about /-3MHz wide, but steeper than the filter of the E4000. Up to about /-1MHz the effectsof overload caused by a signal of about -62 -68dBm are very similar to those of the E4000. Up to about /-3MHz theeffects of overload are still the same, but getting weaker. At about /-10MHz 1dB compression becomes the limitingeffect.For the E4000 the overload/1dB compression limit is not linearly dependent of the gain set in Configuration of SDR#:if the gain is reduced by 13/20/30dB, the overload limit is improved by only 7/14/25dB (measured on 145MHz only).For the R820 the overload/1dB compression limit is nearly linearly dependent of the gain set in Configuration of SDR#:if the gain is reduced by 11/20/30dB, the overload limit is improved by 12/20/30dB (measured at 145MHz only).
7. IntermodulationIf strong signals are fed to a nonlinear amplifier (they all are nonlinear to a certain extent), intermodulation productsare generated.Their general form is: fIM /-n f1 -/ m f2where n m is called the order of the intermodulation.Example for Intermodulation of third order (IM3) with f1 145.1MHz and f2 145.2MHz:and for IM5:fIM3 2 145.1 - 1 145.2 145.0MHz and -1 145.1 2 145.2 145.3MHzfIM5 3 145.1 - 2 145.2 144.9MHz and -2 145.1 3 145.2 145.4MHzSo, if the two signals are spaced by x kHz, the IM products are appearing every x kHz to the left and to the right ofthese signals.IM3 is the strongest. IM levels decrease as their order increases.7.1 Intermodulation in the E4000Figure 7 shows intermodulation products generated in the E4000 by two signals at 145.1 and 145.2MHz. The manysignals to both sides of the IM products are due to overload occurring at the same time: The signals at 145.1 and145.2MHz each have a level of -67dBm. Thus, both signals together exceed the overload level at 145MHz. Thethhighest signal at the far left is the 5 harmonic of the clock, and is always present.Figure 7E4000, Intermodulation products and overload caused by two signals of -67dBmat 145.1 and 145.2MHzFigure 8 shows what happens with two strong signals at 147.5 and 147.6MHz, i.e. outside the bandwidth of the filter ofthe E4000. The IM products, evenly spaced at 100kHz are clearly visible. At the same time additional signals pop up,because the two strong signals together reach the overload limit. The same happens if the two strong frequencies areeven further away from the center frequency: IM products become visible at about the same level overload occurs.Figure 8E4000, Intermodulation products and overload caused by two signals of -42dBmat 147.5 and 147.6MHz (outside the spectrum display and the filter bandwidth)
Figure 9 shows what happens if the two strong signals are far away ( 50MHz) from the center of the spectrum display:IM products begin to appear already at levels of about -40dBm each, i.e. at much lower levels than the overload/1dBcompression limit of -24dBm.Figure 9E4000, effects of two strong signals of -40dBm at 195.0 and 195.1MHz (far off the center frequency)At 435MHz the IM in the E4000 is similar to 145MHz (accounting for the differing overload/1dB compression limits).7.2 Intermodulation in the R820Figure 10 shows the R820 with two strong signals of -65dBm each at 145.1 and 145.2MHz. IM products begin tothappear, but at the same time both signals together exceed the overload limit. The highest signal at the far left is the 5harmonic of the clock, and is always present.Figure 10 R820, intermodulation products and overload caused by two signals of -65dBmat 145.1 and 145.2MHzFigure 11 shows how the R820 copes with two strong signals of -37dBm each at 150.0 and 150.1MHz (outside thefilter bandwidth): a few IM products begin to appear.Figure 11 R820, effects of two strong signals of -37dBm at 150.0 and 150.1MHz(outside the spectrum display and the filter bandwidth)
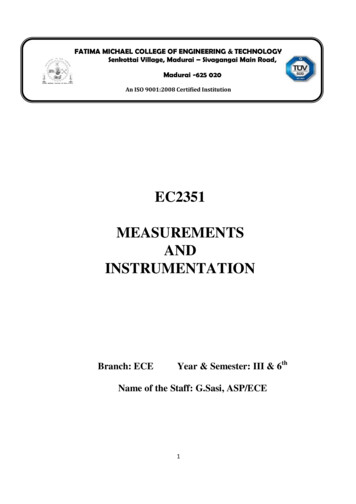
Figure 12 shows what happens in the R820 with two strong signals far away from the center of the spectrum display atthe overload/1dB compression limit: the noise floor rises by about 3dB, and a few "new" signals appear.Figure 12 R820, effects of two strong signals of -20dBm (at the overload/1dB compression limit)at 195.0 and 195.1MHz (far off the center frequency)At 435MHz the IM in the R820 is similar to 145MHz (accounting for the differing overload/1dB compression limits).It seems that for frequencies far off the center frequency the R820 is less prone to IM than the E4000.8. AliasingAliasing always occurs if an insufficiently band limited signal is sampled, i.e. if the signal to be sampled containsfrequencies above half the sampling frequency. Thus, aliasing is an effect showing up in many SDRs, not only in thesedongles. In both types of dongles there is not much space for brickwall filters, hence aliasing is to be expected. As anexample, Figure 13a shows a desired signal of -80dBm at the far left, and a corresponding aliased signal in the center.If the spectrum display is moved to higher frequencies (by sliding it to the left), the desired signal will disappear at theleft, but at the right it will reappear as Alias 2, whereas Alias 1 moves to the right (see Figure 13b). If moving to stillhigher frequencies, Alias 2 will move more to the left, maintaining its frequency, while its level will decrease because ofthe effect of the (non-perfect) filtering. At the same time Alias 1 will slide more to the right, maintaining more or less itslevel, because the filter does not have better wide band attenuation, but increasing in frequency. So, some aliasedsignals can be recognized by the fact that they are not constant in frequency when the spectrum display is moved.Others are constant in frequency, but not in level. Both types will show the same modulation, e.g. no modulation at thesame time.Aliasing effects are similar in both types of dongles.desired signalAlias 2Alias 1Alias 1Figure 13b R820, Example for aliasing effects:desired signal and an aliased signalFigure 13bTuned to a higher frequency, the desiredsignal disappears at the left and an aliasedsignal reappears at the right9. SummaryGeneral notes- The measurements were carried out on one dongle of each type only. The results may vary by several dBs betweenindividual dongles.- In such measurements uncertainties of /-1 2dB are common.Image RejectionBecause the E4000 is a Direct Conversion Receiver, it has an Image Rejection problem. By switching on Correct IQin SDR# a more or less acceptable 50dBs are reached. For the same reason, a "hump" shows in the center of thespectrum display. By using a well filtered external power supply (not from the USB connector) the hump might bereduced.
Internal signalsThe E4000 shows many signals actually not present at its input ("birdies"). Birdies are easy to recognize: most of them(except the harmonics of the clock) vary their frequency when moving the spectrum window in frequency. Many ofthem even move up if you move the window down in frequency.The R820 is much cleaner in this respect: besides the harmonics of the clock (28.8MHz) only few birdies show up.SensitivityBoth dongles have a very high sensitivity. Between about 50 and 450MHz the E4000 is about 5dB better than theR820 (-139dBm vs -134dBm). At 1000MHz the E4000 is about 8dB less sensitive (-129dBm vs -137dBm). Nomeasurements could be made above 1040MHz.Overload and 1dB CompressionIf a signal is strong enough, it may cause overload, i.e. many (unwanted) signals show up on the spectrum display thatare not present at the antenna input. Also, if we listen to a desired signal, another signal (if strong enough) may causea reduction of the S/N ratio of the desired signal.Both dongles have a digitally tuned RF filter after the preamplifier that (together with the following digital signalprocessing) improves the overload/1dB compression limit considerably.- The filter of the E4000 is about /-0.8MHz wide, but less steep than the filter of the R820.- The filter of the R820 is about /-3MHz wide, but steeper than the filter of the E4000.For the E4000 the overload/1dB compression limit is not linearly dependent of the gain set in Configuration of SDR#:if the gain is reduced by 13/20/30dB, the overload limit is improved by only 7/14/25dB (measured on 145MHz only).For the R820 the overload/1dB compression limit is quite linearly dependent of the gain set in Configuration of SDR#:if the gain is reduced by 11/20/30dB, the overload limit is improved by 12/20/30dB (measured at 145MHz only).For both dongles it seems there is nothing to be gained from activating RTL AGC or Tuner AGC.IntermodulationIntermodulation products in general show up close to the overload/1dB compression limits. However, if the strongsignal is on the roll off of the filter, they appear well before this limit.AliasingAliasing always occurs if an insufficiently band limited signal is sampled, i.e. if the signal to be sampled containsfrequencies above half the sampling frequency. Thus, aliasing is an effect showing up in many SDRs, not only in thesedongles. In both types of dongles there is not much space for brickwall filters. Therefore, aliasing effects are wellvisible with both dongles.10. What do we learn from these tests?- Both types of dongles are very sensitive. The choice depends on which frequency range you are most interested in.- Considering birdies and image rejection, the R820 is much cleaner than the E4000.- Set the spectrum display to show a range of not more than 60db above the noise floor. If a signal is close to the top,you know you are close to overload.- Both types of dongles are prone to overload by strong signals within their filter bandwidth: /-0.8MHz for the E4000, /-3MHz for the R820. Therefore, keep signals within this bandwidth to not more than about 60dB above the noisefloor by reducing the gain. If increasing the gain does not audibly increase the signal to noise ratio of the desiredsignal any more, reduce the gain by one step. Do not switch on RTL AGC or Tuner AGC, as it seems there isnothing to be gained.- Outside their filter bandwidth both types of dongles can live with much higher signals without showing seriousdegradation. Use the gain control as explained above to check a possible reduction of signal to noise ratio of thedesired signal or the appearance of "new" signals not present at the antenna input.- Intermodulation occurs if several strong signals are present within the bandwidth of the dongle. Their individualvoltage levels add up (add 6dB per equally strong signal). Therefore, in frequency bands with many strong signals,e.g. broadcast bands, the gain must be reduced even further. Watch for "new" signals appearing when increasingthe gain, and then reduce the gain by one step.- If very strong signals are present at the antenna input ( -40dBm), they should be attenuated by bandstop or notchfilters.Of course these neat, little toys are no match for "real" software defined receivers. They do have some limitations, butyou get a LOT of radio for almost no money! They are fun to experiment with, and to learn more about SDR technologies.
Software used: SDR# v1.0.0.135 Settings: - Configure : 2.048MSPS, RTL AGC off, Tuner AGC off, RF Gain max (49dB for the R820, 42dB for the E4000) - Radio : CW-U, Bandwidth 500Hz, Filter Order 300 - AGC off - FFT Display : Window Blackman-Harris, Resolution 262144. - In the spectrum display the noise floor appears at about -40dBm.