Transcription
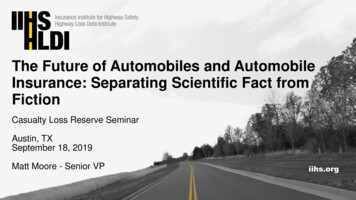
The Future of Automobiles and AutomobileInsurance: Separating Scientific Fact fromFictionCasualty Loss Reserve SeminarAustin, TXSeptember 18, 2019Matt Moore - Senior VPiihs.org
IIHS is an independent, nonprofit scientific andeducational organization dedicated to reducing the losses— deaths, injuries and property damage — from crasheson the nation’s roads.HLDI shares this mission by analyzing insurancedata representing human and economic losses fromcrashes and other events related to vehicle ownership.Both organizations are wholly supported by auto insurers.
IIHS and HLDI member groupsAAA CarolinasAcceptance InsuranceAlfa InsuranceAllstate Insurance GroupAmerican Agricultural Insurance CompanyAmerican Family InsuranceAmerican NationalAmeriprise Auto & HomeAmica Mutual Insurance CompanyAuto Club EnterprisesAuto Club GroupAuto-Owners InsuranceBITCO Insurance CompaniesCalifornia CasualtyCelina Insurance GroupCentral States Health & Life Co. of Omaha andAffiliatesCHUBBColorado Farm Bureau Mutual Insurance CompanyCommonwealth Casualty CompanyConcord Group Insurance CompaniesCOUNTRY FinancialCSAA Insurance GroupDesjardins InsuranceDTRIC InsuranceECM Insurance GroupElephant Insurance CompanyEMC Insurance GroupErie Insurance GroupEsuranceFarm Bureau Financial ServicesFarm Bureau Insurance Company of MichiganFarm Bureau Insurance of TennesseeFarm Bureau Mutual Insurance Company of IdahoFarmers Insurance GroupFarmers Mutual of NebraskaFlorida Farm Bureau Insurance CompaniesFrankenmuth InsuranceGainsco InsuranceGEICO CorporationThe General InsuranceGeorgia Farm Bureau Mutual Insurance CompanyGoodville Mutual Casualty CompanyGrange InsuranceGrinnell MutualHallmark Financial Services, Inc.The Hanover Insurance GroupThe HartfordHaulers Insurance Company, Inc.Horace Mann Insurance CompaniesImperial Fire & Casualty Insurance CompanyIndiana Farm Bureau InsuranceIndiana Farmers InsuranceInfinity Property & CasualtyKemper CorporationKentucky Farm Bureau Mutual InsuranceCompaniesLa Capitale General InsuranceLiberty Mutual InsuranceLouisiana Farm Bureau Mutual InsuranceCompanyThe Main Street America GroupMAPFRE Insurance GroupMercury Insurance GroupMetLifeMississippi Farm Bureau Casualty InsuranceCompanyMMG InsuranceMunich Reinsurance America, Inc.Mutual Benefit Group Mutual of Enumclaw Insurance CompanyNationwideNJM Insurance GroupNodak Insurance CompanyThe Norfolk & Dedham Group North Carolina Farm Bureau Mutual InsuranceCompanyNorth Star Mutual Insurance CompanyNorthern Neck Insurance CompanyNYCM InsuranceOhio Mutual Insurance GroupOregon Mutual Insurance CompanyPekin InsurancePEMCO InsurancePlymouth Rock AssuranceProgressive InsurancePURE InsuranceQualitas Insurance CompanyRedpoint County Mutual Insurance CompanyThe Responsive Auto Insurance CompanyRider InsuranceRockingham InsuranceRoot Insurance CoRSA CanadaSafe Auto Insurance CompanySafeco InsuranceSamsung Fire & Marine Insurance CompanySECURA InsuranceSelective Insurance Company of AmericaSentry InsuranceShelter Insurance Sompo InternationalSouth Carolina Farm Bureau Mutual InsuranceCompany Southern Farm Bureau Casualty InsuranceCompanyState Farm Insurance CompaniesStillwater Insurance GroupSwiss Reinsurance Company LtdTexas Farm Bureau InsuranceThe Travelers Companies, Inc.United EducatorsUSAAUtica National Insurance GroupVirginia Farm Bureau Mutual InsuranceWest Bend Mutual Insurance CompanyWestern National Insurance GroupWestfieldFunding AssociationsAmerican Property Casualty Insurance AssociationNational Association of Mutual InsuranceCompanies
Haddon matrixRecognizing opportunities to make a differencepeoplepre-crashduring crashafter crashgraduated licensingsafety beltsmedical braceletsimpaired driving lawshelmetsgeneral healthairbagsautomatic collision notificationcrashworthinessfuel system integrityautomated enforcementcrash avoidance technologyvehiclestruck underride guardsenvironmentroundaboutsroadside barriersemergency medical servicesrumble stripsbreakaway poleslong-term rehabilitation
HLDI data providers insure approximately 85% share of PPA21st Century InsuranceKemper PreferredAlfa Alliance Insurance CorporationKentucky Farm Bureau InsuranceAllstate Insurance GroupLiberty Mutual Insurance CompanyAmerican Family Mutual InsuranceMetLife Auto and HomeAmerican National Family of CompaniesNational GeneralAmica Mutual Insurance CompanyNationwideAuto Club GroupNew Jersey Manufacturers Insurance GroupAutomobile Insurers Bureau of MassachusettsPEMCO InsuranceChubb & SonPlymouth Rock AssuranceCOUNTRY FinancialProgressive CorporationCSAA Insurance GroupRockingham GroupErie Insurance GroupSafeco Insurance CompaniesEsuranceSECURA InsuranceFarm Bureau Financial ServicesSentry InsuranceFarmers Insurance Group of CompaniesState Farm Insurance CompaniesFlorida Farm Bureau Insurance CompaniesTennessee Farmers Mutual Insurance CompanyForemostTexas Farm BureauGEICO CorporationThe Travelers CompaniesHanover Insurance GroupUSAAThe Hartford
Evaluations of AdvancedDriver AssistanceSystems (ADAS)
Vehicles with forward collision warning2000Mercedes-Benz S Class 73,0952018Chevrolet Spark 18,015
HLDI collision avoidance analysis The HLDI database includes data from companies that representabout 85% of private passenger auto insurance in the U.S. On a monthly basis, HLDI processes 320 million insurance datatransactions The insurance data includes the garaging zip code and rateddriver demographics Manufacturers shared with us 17 digit VINs and information aboutcollision avoidance systems fitted to those vehicles Our collision avoidance analysis used the manufacturer suppliedfeature data along with our geographic and demographic data Large amount of timely data Limited information on crash circumstances
Effect of crash avoidance systems on claim frequencyResults pooled across automakers40%CollisionProperty damage liabilityBodily injury ningfrontautobrakecurve-adaptive lane departureheadlightswarningblind spotwarningparkingsensorsrearcamerarearautobrake
Effect of crash avoidance systems on claim frequencyResults pooled across automakers40%CollisionProperty damage liabilityBodily injury ningfrontautobrakecurve-adaptive lane departureheadlightswarningblind spotwarningparkingsensorsrearcamerarearautobrake
Effect of crash avoidance systems on claim frequencyResults pooled across automakers40%CollisionProperty damage liabilityBodily injury ningfrontautobrakecurve-adaptive lane departureheadlightswarningblind spotwarningparkingsensorsrearcamerarearautobrake
Effect of crash avoidance systems on claim frequencyResults pooled across automakers40%CollisionProperty damage liabilityBodily injury ningfrontautobrakecurve-adaptive lane departureheadlightswarningblind spotwarningparkingsensorsrearcamerarearautobrake
Effect of crash avoidance systems on claim frequencyResults pooled across automakers40%CollisionProperty damage liabilityBodily injury ningfrontautobrakecurve-adaptive lane departureheadlightswarningblind spotwarningparkingsensorsrearcamerarearautobrake
Effect of crash avoidance systems on claim frequencyResults pooled across automakers40%CollisionProperty damage liabilityBodily injury ningfrontautobrakecurve-adaptive lane departureheadlightswarningblind spotwarningparkingsensorsrearcamerarearautobrake
HLDI and police-reported crash dataInsurance data Large amount of timely data Limited information on crash circumstancesPolice-reported crash data More detailed information on crash type Limitations– Some crashes not reported to police– Delay in obtaining data– Data collected not uniform among states, and not all states haveinformation to determine crash types
Most crash avoidance technologies are living up to expectationsEffects on relevant police-reported crash typesall severitiesinjurystatistically significant20%0%-20%-40%-60%-80%forward collision warninglow-speed autobrakeFCW with autobrakelane departure warningside-view assist(blind spot)
Summary of technology effects on collision claim severityResults pooled across automakers10%5%0%-5%forward collision warningfcw with autobrakeadaptive headlights
GM collision avoidance features
Change in insurance losses for GM vehiclesWith parking sensors and rearview ision-9.3%-7.1%-4.8% 151 283 418- 21- 7 9property damage liability-19.9%-16.6%-13.2% 7 139 277- 20- 15- quencybodily injury .7%18.2%medical 6%4.7%personal injury 7%4.0%
Change in insurance losses for GM vehiclesWith rear automatic lision-17.2%-13.1%-8.7% 537 846 1,173- 21 7 37property damage liability-32.1%-26.3%-20.1% 300 601 926- 22- 13- quencybodily injury 1%34.8%medical %34.9%personal injury 6%44.7%
Change in collision claim frequencyBy severity range40%parking sensors and rear camera20%rear automatic braking0%-20%-40%-60%low severity( 2,000)mid-severity( 2,000 - 11,999)high severity( 12,000 )
Front crash preventiontesting and rating
Front crash prevention ratingsvehicles without forward collision warning or autobrake; orvehicles equipped with a system that doesn’t meet NHTSA orIIHS criteriavehicles earning 1 point for forward collision warningor 1 point in either 12 or 25 mph testvehicles with autobrake that achieve 2-4 points for forwardcollision warning and/or performance in autobraking testsvehicles with autobrake that achieve 5-6 points for forwardcollision warning and/or performance in autobraking tests
Front crash prevention ratings2013-19 models, as of September 1410
20 automakers have committedto make AEB a standard feature bySeptember 202299 % ofU.S. market
Headlight testingand ratings
Toyota Prius v LED and BMW 3 series halogenOn-road comparison
Headlight ratings (as of September 2019)2016-19 model years – all headlight 622019
Evaluations of system status
On-off status of front crash prevention systemsBy manufacturerpercent withsystem 239Mazda9520Volvo9452total93659
On-off status of lane-maintenance systemsBy manufacturerpercent withsystem o75105total51983
On-off status by maximum observablelane-maintenance intervention levelPercent with system on806040200lane departure warning(n 547)lane departure prevention(n 288)active lane keeping(n 146)
GM lane departure warning on-off status by warning modalitybeepvibrating seatpercent withsystem Cadillac58142Chevrolet4949total56191
Park assist systems
Distribution of collision claims, 2017 calendar yearBy claim size, 1981–2018 models25%20%15%10%5%0% 0-999 5,000-5,999 10,000-10,999 15,000-15,999 20,000
Drivers must respond to sensors for them to work
Objects are not always easy to see in the camera display
Rearview cameras can help drivers avoid backing overobjects in reverse
Technology influences the way we lookaround the vehicle while backingPercentage of time spent looking at different fields of view100No irrorsshoulderscamera display/center consoleforward/other
Rear automatic braking
Rear automatic brakingChange in claim baru
Benefit of rear autobrake
Benefit of rear autobrake
Insurance resultsfor Level 2 systems
Tesla Model S claim frequencies with and without driverassistance technology versus large luxury vehiclesEffect of driver assistance technology, including Autopilot60%40%20%0%-20%-40%without driver assistance technology-60%with driver assistance technology, including Autopilot-80%collisionPDLBILMedPayPIP
Estimated effect of Tesla Model S Autopilot on claim frequencyDriver assistance technology plus Autopilot vs. early driver assistance technology MedPayPIP
Effect of Audi Traffic Jam Assist, adaptive cruise control,active lane assist and high-beam assist on claim frequency2017 Audi A4 and Q7, by insurance coverage type10%0%-10%-20%-30%collisionproperty damage liability
Effect of Nissan ProPilot Assist on claim frequency2016–18 Leaf and 2017–18 Rogue, by insurance coverage ty damage liability
Experiences with drivingautomation
Opinions of level 2 driving automation technology afterbrief use 17-20 employees drove each vehicle on a 20-mile route while using level 2 drivingautomation the entire drive Completed a survey about their experience after the drive Five vehicles:– 2017 BMW 5 series with “Driving Assistant Plus”– 2017 Mercedes E-Class with “Drive Pilot”– 2016 Tesla Model S with “Autopilot”– 2018 Volvo S90 with “Pilot Assist”– Pre-production 2019 Infiniti QX50 with “Pro Pilot Assist”
Adaptive cruise control trusted more than active lane keepingPercentage of drivers who agreed or strongly agreedI trust the automation to maintain speed and distance to vehicle ahead100I trust the automation to keep me in center of lane806040200Tesla Model S"Autopilot"Volvo S90"Pilot Assist"BMW 5-series"Driving AssistantPlus"Infiniti QX50"Pro Pilot Assist"Mercedes E-class"Drive Pilot"
Functional performanceof adaptive cruise control
Functional performance testing of adaptive cruise control2016 Tesla Model Swith Autopilotsoftware ver. 7.12017 BMW 5 serieswith DrivingAssistant Plus2018 Volvo S90with Pilot Assist2017 MercedesE-Class withDrive Pilot2018 Tesla Model 3with Autopilotsoftware ver. 8.1
Functional performance testing of adaptive cruise control Combination of track and on-road tests Adaptive cruise control scenarios– Stopped lead vehicle– Vehicle exiting lane– Acceleration/deceleration profiles
Approach stationary target with ACC on
Test track performance was not necessarily replicated on roadOn-road testing – approaching stationary vehicles
Less common hazards may or may not be detectedOn-road testing
Functional performanceof lane-keeping systems
Lane keeping in curves
Lane keeping in curves100%80%60%disengagedcrossed lane lineon lane line40%remained in lane20%0%BMW 5 seriesn 16Volvo S90n 17Mercedes E-Classn 17Tesla Model Sn 18Tesla Model 3n 18
Lane keeping on hills
Lane keeping on hills100%80%60%disengagedcrossed lane lineon lane line40%remained in lane20%0%BMW 5 seriesn 14Tesla Model Sn 18Volvo S90n 17Mercedes E-Classn 18Tesla Model 3n 18
Can automation eliminate allcrashes caused by human error?
Human error contributes to most crashesNecessary conditions for automation to be safer than human drivers Better than human driver crash rates.1 Fewer than.– 560 people in police-reported crashes– 99 injuries– 1.2 fatalities.per 100 million miles travelled The critical precrash event was attributed to drivers in 94 percent of crashes21. NHTSA, Police-Reported Motor Vehicle Traffic Crashes in 2016 (DOT HS 812 501)2. NHTSA, Critical Reasons for Crashes Investigated in the National Motor Vehicle Crash Causation Survey (DOT HS 812 115)
Forty-one percent were recognition errorsAutomated driving systems need to reliably “recognize”and avoid critical situations better than humans Inadequatesurveillance Distraction Inattention Otherwhat humans seewhat robo-cars see
Thirty-three percent were decision errorsADS need to make better decisions, obey traffic laws and predict the futurebetter than humans Speed Wrong assumptions about other road users Illegal maneuver Aggressive driving
Eleven percent performance and 7 percent nonperformance errorsADS need to reliably control the vehicle better than humans No or insufficient braking Over or under steering Freezing Other
Did the Uber self-driving system avoid humanlike errors? Recognition error?– Uber’s AV detected pedestrian and classified her as anunknown object, then a vehicle, finally a bicycle– Paths were converging at 6 seconds before impact, butUber’s AV computed varying expectations of future path Decision error?– Six seconds before impart, Uber’s AV was moving 43 mphin 45 mph zone–Impact speed was 39 mphNTSB preliminary report gives no explanation for speed changeShould Uber’s AV have slowed more? Performance error?–Emergency braking maneuvers were disabled
Fleet fitment of ADAS
New vehicle series with rear cameraBy model optional2012not available20142016
Registered vehicles with rear cameraBy calendar onal20102012not available2014equipped2016
New vehicle series with autonomous emergency brakingBy model onal2014not available2016
Registered vehicles with autonomous emergency brakingBy calendar onalnot available2014equipped2016
Predicted registered vehicles by feature by calendar eadaptiveheadlightsblind iewcamera
Estimated change in claim frequency due to increased fitmentof front autobrake systems30%100%PDLvehicles with nge in claim frequencypredicted equipped
More information at iihs.org and on our social channels:/iihs.org@iihs autosafety@IIHS autosafetyIIHSMatt MooreSenior Vice President – HLDImmoore@hldi.orgiihs.org
Colorado Farm Bureau Mutual Insurance Company Commonwealth Casualty Company Concord Group Insurance Companies . Grange Insurance Grinnell Mutual Hallmark Financial Services, Inc. The Hanover Insurance Group . about 85% of private passenger auto insurance in the U.S. On a monthly basis, HLDI processes 320 million insurance data