Transcription
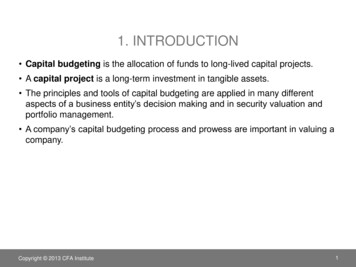
1. INTRODUCTION Capital budgeting is the allocation of funds to long-lived capital projects. A capital project is a long-term investment in tangible assets. The principles and tools of capital budgeting are applied in many differentaspects of a business entity’s decision making and in security valuation andportfolio management. A company’s capital budgeting process and prowess are important in valuing acompany.Copyright 2013 CFA Institute1
2. THE CAPITAL BUDGETING PROCESSStep 1Generating Ideas Generate ideas from inside or outside of the companyStep 2Analyzing Individual Proposals Collect information and analyze the profitability of alternative projectsStep 3Planning the Capital Budget Analyze the fit of the proposed projects with the company’s strategyStep 4Monitoring and Post Auditing Compare expected and realized results and explain any deviationsCopyright 2013 CFA Institute2
CLASSIFYING tory,Safety, andEnvironmentalProjectsCopyright 2013 CFA InstituteNew Productsand ServicesOther3
3. BASIC PRINCIPLES OF CAPITAL BUDGETINGDecisions arebased on cashflows.The timing of cashflows is crucial.Cash flows areincremental.Cash flows are onan after-tax basis.Financing costsare ignored.Copyright 2013 CFA Institute4
COSTS: INCLUDE OR EXCLUDE? A sunk cost is a cost that has already occurred, so it cannot be part of theincremental cash flows of a capital budgeting analysis. An opportunity cost is what would be earned on the next-best use of theassets. An incremental cash flow is the difference in a company’s cash flows withand without the project. An externality is an effect that the investment project has on something else,whether inside or outside of the company.- Cannibalization is an externality in which the investment reduces cash flowselsewhere in the company (e.g., takes sales from an existing companyproject).Copyright 2013 CFA Institute5
CONVENTIONAL AND NONCONVENTIONALCASH FLOWSConventional Cash Flow (CF) PatternsToday12345 –CF CF CF CF CF CF–CF–CF CF CF CF CF CF CF CF CF–CFCopyright 2013 CFA Institute6
CONVENTIONAL AND NONCONVENTIONALCASH FLOWSNonconventional Cash Flow PatternsToday12345 –CF CF CF CF CF–CF–CF CF–CF CF CF CF–CF–CF CF CF CF–CFCopyright 2013 CFA Institute7
INDEPENDENT VS. MUTUALLYEXCLUSIVE PROJECTS When evaluating more than one project at a time, it is important to identifywhether the projects are independent or mutually exclusive- This makes a difference when selecting the tools to evaluate the projects. Independent projects are projects in which the acceptance of one projectdoes not preclude the acceptance of the other(s). Mutually exclusive projects are projects in which the acceptance of oneproject precludes the acceptance of another or others.Copyright 2013 CFA Institute8
PROJECT SEQUENCING Capital projects may be sequenced, which means a project contains an optionto invest in another project.- Projects often have real options associated with them; so the company canchoose to expand or abandon the project, for example, after reviewing theperformance of the initial capital project.Copyright 2013 CFA Institute9
CAPITAL RATIONING Capital rationing is when the amount of expenditure for capital projects in agiven period is limited. If the company has so many profitable projects that the initial expenditures intotal would exceed the budget for capital projects for the period, the company’smanagement must determine which of the projects to select. The objective is to maximize owners’ wealth, subject to the constraint on thecapital budget.- Capital rationing may result in the rejection of profitable projects.Copyright 2013 CFA Institute10
4. INVESTMENT DECISION CRITERIANet Present Value (NPV)Internal Rate of Return (IRR)Payback PeriodDiscounted Payback PeriodAverage Accounting Rate of Return (AAR)Profitability Index (PI)Copyright 2013 CFA Institute11
NET PRESENT VALUEThe net present value is the present value of all incremental cash flows, discountedto the present, less the initial outlay:CFtnσNPV t 1 Outlay(2-1)(1 r)tOr, reflecting the outlay as CF0,CFtnNPV σt 0(2-2)(1 r)twhereCFt After-tax cash flow at time tr Required rate of return for the investmentOutlay Investment cash flow at time zeroIf NPV 0: Invest: Capital project adds valueIf NPV 0: Do not invest: Capital project destroys valueCopyright 2013 CFA Institute12
EXAMPLE: NPVConsider the Hoofdstad Project, which requires an investment of 1 billioninitially, with subsequent cash flows of 200 million, 300 million, 400 million,and 500 million. We can characterize the project with the following end-of-yearcash flows:Cash FlowPeriod (millions)0– 1,0001200230034004500What is the net present value of the Hoofdstad Project if the required rate ofreturn of this project is 5%?Copyright 2013 CFA Institute13
EXAMPLE: NPVTime Line01234 – 1,000 200 300 400 500Solving for the NPV:NPV – 1,000 2001 0.05 1 3001 0.05 2 4001 0.05 3 5001 0.05 4NPV 1,000 190.48 272.11 345.54 411.35NPV 219.47 millionCopyright 2013 CFA Institute14
INTERNAL RATE OF RETURNThe internal rate of return is the rate of return on a project.- The internal rate of return is the rate of return that results in NPV 0.CFtσnt 1 (1 IRR)t Outlay 0(2-3)Or, reflecting the outlay as CF0,CFtnσt 0 0(1 IRR)t(2-4)If IRR r (required rate of return): Invest: Capital project adds valueIf IRR r: Do not invest: Capital project destroys valueCopyright 2013 CFA Institute15
EXAMPLE: IRRConsider the Hoofdstad Project that we used to demonstrate the NPVcalculation:Cash FlowPeriod (millions)0– 1,0001200230034004500The IRR is the rate that solves the following: 0 1,000 Copyright 2013 CFA Institute 2001 IRR1 3001 IRR2 4001 IRR3 5001 IRR416
A NOTE ON SOLVING FOR IRR The IRR is the rate that causes the NPV to be equal to zero. The problem is that we cannot solve directly for IRR, but rather must eitheriterate (trying different values of IRR until the NPV is zero) or use a financialcalculator or spreadsheet program to solve for IRR. In this example, IRR 12.826%: 0 1,000 2001 0.12826Copyright 2013 CFA Institute1 3001 0.128262 4001 0.128263 5001 0.12826174
PAYBACK PERIOD The payback period is the length of time it takes to recover the initial cashoutlay of a project from future incremental cash flows. In the Hoofdstad Project example, the payback occurs in the last year, Year 4:Cash FlowPeriod01234Copyright 2013 CFA Institute(millions)– 1,000200300400500AccumulatedCash flows– 1,000– 800– 500– 100 40018
PAYBACK PERIOD: IGNORING CASH FLOWSFor example, the payback period for both Project X and Project Y is three years,even through Project X provides more value through its Year 4 cash flow:YearCopyright 2013 CFA InstituteProject XCash FlowsProject YCash Flows0– 100– 1001 20 202 50 503 45 454 60 019
DISCOUNTED PAYBACK PERIOD The discounted payback period is the length of time ittakes for the cumulative discounted cash flows to equal theinitial outlay.- In other words, it is the length of time for the project to reach NPV 0.Copyright 2013 CFA Institute20
EXAMPLE: DISCOUNTED PAYBACK PERIODConsider the example of Projects X and Y. Both projects have a discountedpayback period close to three years. Project X actually adds more value but isnot distinguished from Project Y using this approach.Cash FlowsYear01234Project X– 100.0020.0050.0045.0060.00Copyright 2013 CFA InstituteProject Y– 100.0020.0050.0045.000.00DiscountedCash FlowsAccumulatedDiscountedCash FlowsProject X Project Y Project X Project Y– 100.00 – 100.00 – 100.00 – –35.6038.8738.873.273.2749.360.0052.633.2721
AVERAGE ACCOUNTING RATE OF RETURN The average accounting rate of return (AAR) is the ratio of the average netincome from the project to the average book value of assets in the project:AAR Copyright 2013 CFA InstituteAverage net incomeAverage book value22
PROFITABILITY INDEXThe profitability index (PI) is the ratio of the present value of future cash flowsto the initial outlay:PI Present value of future cash flowsNPV 1 Initial investmentInitial investment(2-5)If PI 1.0: Invest Capital project adds valueIf PI 0: Do not invest Capital project destroys valueCopyright 2013 CFA Institute23
EXAMPLE: PIIn the Hoofdstad Project, with a required rate of return of 5%,Cash FlowPeriod01234(millions)- 1,000200300400500the present value of the future cash flows is 1,219.47. Therefore, the PI is: 1,219.47PI 1.219 1,000.00Copyright 2013 CFA Institute24
NET PRESENT VALUE PROFILEThe net present value profile is the graphical illustration of the NPV of a projectat different required rates of return.NetPresentValueThe NPV profile intersects thevertical axis at the sum of thecash flows (i.e., 0% requiredrate of return).The NPV profile crosses thehorizontal axis at the project’sinternal rate of return.Required Rate of ReturnCopyright 2013 CFA Institute25
NPV PROFILE: HOOFDSTAD CAPITAL PROJECT 500 400 300NPV 200(millions) 100 0- 100- 2000%Copyright 2013 CFA Institute2%4%6% 8% 10% 12% 14% 16% 18% 20%Required Rate of Return26
500 400 300 200NPV(millions) 100 0- 100 400 361 323 287 253 219 188 157 127 99 72 46 20– 4– 28– 50– 72– 93– 114– 133– 152NPV PROFILE: HOOFDSTAD CAPITAL PROJECT- 2000%Copyright 2013 CFA Institute2%4%6% 8% 10% 12% 14% 16% 18% 20%Required Rate of Return27
RANKING CONFLICTS: NPV VS. IRR The NPV and IRR methods may rank projects differently.- If projects are independent, accept if NPV 0 produces the same result aswhen IRR r.- If projects are mutually exclusive, accept if NPV 0 may produce a differentresult than when IRR r. The source of the problem is different reinvestment rate assumptions- Net present value: Reinvest cash flows at the required rate of return- Internal rate of return: Reinvest cash flows at the internal rate of return The problem is evident when there are different patterns of cash flows ordifferent scales of cash flows.Copyright 2013 CFA Institute28
EXAMPLE: RANKING CONFLICTSConsider two mutually exclusive projects, Project P and Project Q:End of Year Cash FlowsYearProject PProject Q0–100–100103320333033414233Which project is preferred and why?Hint: It depends on the projects’ required rates of return.Copyright 2013 CFA Institute29
DECISION AT VARIOUS REQUIREDRATES OF RETURNProject PProject QDecisionNPV @ 0% 42 32 Accept P, Reject QNPV @ 4% 21 20 Accept P, Reject QNPV @ 6% 12 14 Reject P, Accept QNPV @ 10%– 3 5 Reject P, Accept QNPV @ 14%– 16– 4 Reject P, Reject QIRRCopyright 2013 CFA Institute9.16%12.11%30
NPV PROFILES: PROJECT P AND PROJECT QNPV of Project P 50NPV of Project Q 40 30 20NPV 10 0- 10- 20- 300%Copyright 2013 CFA Institute2%4%6%8%10% 12%Required Rate of Return14%31
THE MULTIPLE IRR PROBLEM If cash flows change sign more than once during the life of the project, theremay be more than one rate that can force the present value of the cash flowsto be equal to zero.- This scenario is called the “multiple IRR problem.”- In other words, there is no unique IRR if the cash flows are nonconventional.Copyright 2013 CFA Institute32
EXAMPLE: THE MULTIPLE IRR PROBLEMConsider the fluctuating capital project with the following end of year cash flows,in millions:Year01234Cash Flow– 550 490 490 490– 940What is the IRR of this project?Copyright 2013 CFA Institute33
EXAMPLE: THE MULTIPLE IRR PROBLEM 40IRR 34.249% 20 0- 20IRR 2.856%NPV- 40(millions)- 60- 80- 100- 1200%Copyright 2013 CFA Institute8%16% 24% 32% 40% 48% 56% 64%Required Rate of Return34
POPULARITY AND USAGE OF CAPITALBUDGETING METHODS In terms of consistency with owners’ wealth maximization, NPV and IRR arepreferred over other methods. Larger companies tend to prefer NPV and IRR over the payback periodmethod. The payback period is still used, despite its failings. The NPV is the estimated added value from investing in the project; therefore,this added value should be reflected in the company’s stock price.Copyright 2013 CFA Institute35
5. CASH FLOW PROJECTIONSThe goal is to estimate the incremental cash flows of the firm for each year in theproject’s useful life.012345 InvestmentOutlayAfter-TaxOperatingCash FlowAfter-TaxOperatingCash FlowAfter-TaxOperatingCash FlowAfter-TaxOperatingCash FlowAfter-TaxOperatingCash Flow TerminalNonoperatingCash Flow Total AfterTax CashFlow Total AfterTax CashFlowCopyright 2013 CFA Institute Total AfterTax CashFlow Total AfterTax CashFlow Total AfterTax CashFlow Total AfterTax CashFlow36
INVESTMENT OUTLAYCopyright 2013 CFA InstituteStart withCapital expenditureSubtractIncrease in workingcapitalEqualsInitial outlay37
AFTER-TAX OPERATING CASH FLOWStart withSalesSubtractCash operating expensesSubtractDepreciationEqualsOperating income before taxesSubtractTaxes on operating incomeEqualsOperating income after taxesPlusDepreciationEqualsAfter-tax operating cash flowCopyright 2013 CFA Institute38
TERMINAL YEAR AFTER-TAXNONOPERATING CASH FLOWStart withAfter-tax salvage valueAddReturn of net working capitalEqualsNonoperating cash flowCopyright 2013 CFA Institute39
FORMULA APPROACHInitial outlayOutlay FCInv NWCInv – Sal0 T(Sal0 – B0)(6)After-tax operatingcash flowCF (S – C – D)(1 – T) D(7)CF (S – C)(1 – T) TD(8)TNOCF SalT NWCInv – T(SalT – BT)(9)Terminal year after-taxnonoperating cash flow(TNOCF)FCINV Investment in new fixed capitalS SalesNWCInv Investment in working capitalC Cash operating expensesSal0 Cash proceedsD DepreciationB0 Book value of capitalT Tax rateCopyright 2013 CFA Institute40
EXAMPLE: CASH FLOW ANALYSISSuppose a company has the opportunity to bring out a new product, the VitaminBurger. The initial cost of the assets is 100 million, and the company’s workingcapital would increase by 10 million during the life of the new product. The newproduct is estimated to have a useful life of four years, at which time the assetswould be sold for 5 million.Management expects company sales to increase by 120 million the first year, 160 million the second year, 140 million the third year, and then trailing to 50million by the fourth year because competitors have fully launched competitiveproducts. Operating expenses are expected to be 70% of sales, anddepreciation is based on an asset life of three years under MACRS (modifiedaccelerated cost recovery system).If the required rate of return on the Vitamin-Burger project is 8% and thecompany’s tax rate is 35%, should the company invest in this new product? Whyor why not?Copyright 2013 CFA Institute41
EXAMPLE: CASH FLOW ANALYSISPieces: Investment outlay – 100 – 10 – 110 million. Book value of assets at end of four years 0.- Therefore, the 5 salvage represents a taxable gain of 5 million.- Cash flow upon salvage 5 – ( 5 0.35) 5 – 1.75 3.25 million.Copyright 2013 CFA Institute42
EXAMPLE: CASH FLOW ANALYSISYearInvestment outlaysFixed capitalNet working capitalTotalCopyright 2013 CFA Institute0– 100.00–10.00– 110.0043
EXAMPLE: CASH FLOW ANALYSISYearAnnual after-tax operating cash flowsSalesCash operating expensesDepreciationOperating income before taxesTaxes on operating incomeOperating income after taxesAdd back depreciationAfter-tax operating cash flowCopyright 2013 CFA Institute1234 120.00 160.00 140.00 50.0084.00 112.0098.00 35.0033.3344.4514.817.41 2.67 3.55 27.19 7.590.931.249.522.66 1.74 2.31 17.67 4.9333.3344.4514.817.41 35.07 46.76 32.48 12.3444
EXAMPLE: CASH FLOW ANALYSISYear4Terminal year after-tax nonoperating cash flowsAfter-tax salvage value 3.25Return of net working capital10.00Total terminal after-tax non-operating cash flowsCopyright 2013 CFA Institute 13.2545
EXAMPLE: CASH FLOW ANALYSISYearTotal after-tax cash flow01234– 110.00 35.07 46.76 32.48 25.59Discounted value, at 8%– 110.00 32.47 40.09 25.79 18.81Net present valueInternal rate of return 7.1511.068%Copyright 2013 CFA Institute46
6. MORE ON CASH FLOW PROJECTIONSDepreciation IssuesReplacementDecisionsInflationCopyright 2013 CFA Institute47
RELEVANT DEPRECIATION The relevant depreciation expense to use is the expense allowed for taxpurposes.- In the United States, the relevant depreciation is MACRS, which is a set ofprescribed rates for prescribed classes (e.g., 3-year, 5-year, 7-year, and 10year).- MACRS is based on the declining balance method, with an optimal switch tostraight-line and half of a year of depreciation in the first year.Copyright 2013 CFA Institute48
EXAMPLE: MACRSSuppose a U.S. company is investing in an asset that costs 200 million and isdepreciated for tax purposes as a five-year asset. The depreciation for taxpurposes is (in millions):Year123456TotalCopyright 2013 CFA InstituteMACRS eciation 40.0064.0038.4023.0423.0411.52 200.0049
PRESENT VALUE OF DEPRECIATIONTAX SAVINGS The cash flow generated from the deductibility of depreciation (which itself is anoncash expense) is the product of the tax rate and the depreciation expense.- If the depreciation expense is 40 million, the cash flow from this expense is 40 million Tax rate.- The present value of these cash flows over the life of the project is thepresent value of tax savings from depreciation.Copyright 2013 CFA Institute50
PRESENT VALUE OF DEPRECIATIONTAX SAVINGSContinuing the example with the five-year asset, the company’s tax rate is 35%and the appropriate required rate of return is 10%.Therefore, the present valueof the tax savings is 55.89 million.(in millions)Year123456MACRS Rate20.00%32.00%19.20%11.52%11.52%5.76%Copyright 2013 CFA InstituteDepreciation Tax Savings 40.00 03 200.00 69.99Present Valueof DepreciationTax Savings 12.7318.5110.105.515.014.03 55.8951
CASH FLOWS FOR A REPLACEMENT PROJECT When there is a replacement decision, the relevant cash flows expand toconsider the disposition of the replaced assets:- Incremental depreciation expense (old versus new depreciation)- Other incremental operating expenses- Nonoperating expenses Key: The relevant cash flows are those that change with the replacement.Copyright 2013 CFA Institute52
SPREADSHEET MODELING We can use spreadsheets (e.g., Microsoft Excel) to model the capitalbudgeting problem. Useful Excel functions:- Data tables- NPV- IRR A spreadsheet makes it easier for the user to perform sensitivity and simulationanalyses.Copyright 2013 CFA Institute53
EFFECTS OF INFLATION ON CAPITALBUDGETING ANALYSIS Issue: Although the nominal required rate of return reflects inflationexpectations and sales and operating expenses are affected by inflation,- The effect of inflation may not be the same for sales as operating expenses.- Depreciation is not affected by inflation.- The fixed cost nature of payments to bondholders may result in a benefit or acost to the company, depending on inflation relative to expected inflation.Copyright 2013 CFA Institute54
7. PROJECT ANALYSIS AND EVALUATIONWhat if we are choosing among mutually exclusiveprojects that have different useful lives?What happens under capital rationing?How do we deal with risk?Copyright 2013 CFA Institute55
MUTUALLY EXCLUSIVE PROJECTSWITH UNEQUAL LIVES When comparing projects that have different useful lives, we cannot simplycompare NPVs because the timing of replacing the projects would be different,and hence, the number of replacements between the projects would bedifferent in order to accomplish the same function. Approaches1. Determine the least common life for a finite number of replacements andcalculate NPV for each project.2. Determine the annual annuity that is equivalent to investing in each projectad infinitum (that is, calculate the equivalent annual annuity, or EAA).Copyright 2013 CFA Institute56
EXAMPLE: UNEQUAL LIVESConsider two projects, Project G and Project H, both with a required rate ofreturn of 5%:End-of-YearCash FlowsYear01234Project G– 10030303030Project H– 100383940NPV 6.38 6.12Which project should be selected, and why?Copyright 2013 CFA Institute57
EXAMPLE: UNEQUAL LIVESNPV WITH A FINITE NUMBER OF REPLACEMENTSProject G: Two replacementsProject H: Three replacementsProject GProject H0123456789101112 6.38 6.12 6.38 6.12 6.38 6.12 6.12NPV of Project G: original, plus two replacements 17.37NPV of Project H: original, plus three replacements 21.69Copyright 2013 CFA Institute58
EXAMPLE: UNEQUAL LIVESEQUIVALENT ANNUAL ANNUITYProject GProject HPV 6.38PV 6.12N 4N 3I 5%I 5%Solve for PMTSolve for PMTPMT 1.80PMT 2.25Therefore, Project H is preferred (higher equivalent annual annuity).Copyright 2013 CFA Institute59
DECISION MAKING UNDERCAPITAL RATIONING When there is capital rationing, the company may not be able to invest in allprofitable projects. The key to decision making under capital rationing is to select those projectsthat maximize the total net present value given the limit on the capital budget.Copyright 2013 CFA Institute60
EXAMPLE: CAPITAL RATIONING Consider the following projects, all with a required rate of return of 4%:ProjectOneTwoThreeFourFiveInitialOutlay– 100– 300– 400– 500– 200NPV 20 30 40 45 15PI1.201.101.101.091.08IRR15%10%8%5%5%Which projects, if any, should be selected if the capital budget is:1. 100?2. 200?3. 300?4. 400?5. 500?Copyright 2013 CFA Institute61
EXAMPLE: CAPITAL RATIONINGPossible decisions:Budget 100 200 300 400 500ChoicesOneOneOne FiveOne TwoOne ThreeNPV 20 20 35 50 60Choices NPVChoicesTwoTwoThreeFourTwo Five 15 15 40 45NPV 45Optimal choicesKey: Maximize the total net present value for any given budget.Copyright 2013 CFA Institute62
RISK ANALYSIS: STAND-ALONE METHODS Sensitivity analysis involves examining the effect on NPV of changes in oneinput variable at a time. Scenario analysis involves examining the effect on NPV of a set of changesthat reflect a scenario (e.g., recession, normal, or boom economicenvironments). Simulation analysis (Monte Carlo analysis) involves examining the effect onNPV when all uncertain inputs follow their respective probability distributions.- With a large number of simulations, we can determine the distribution ofNPVs.Copyright 2013 CFA Institute63
RISK ANALYSIS: MARKET RISK METHODSThe required rate of return, when using a market risk method, is the return that adiversified investor would require for the project’s risk.- Therefore, the required rate of return is a risk-adjusted rate.- We can use models, such as the CAPM or the arbitrage pricing theory, toestimate the required return.Using CAPM,ri RF βi [E(RM) – RF]whereri RF βi [E(RM) – RF] (10)required return for project or asset irisk-free rate of returnbeta of project or asset imarket risk premium, the difference between the expectedmarket return and the risk-free rate of returnCopyright 2013 CFA Institute64
REAL OPTIONS A real option is an option associated with a real asset that allows the companyto enhance or alter the project’s value with decisions some time in the future. Real option examples:- Timing option: Allow the company to delay the investment- Sizing option: Allow the company to expand, grow, or abandon a project- Flexibility option: Allow the company to alter operations, such as changingprices or substituting inputs- Fundamental option: Allow the company to alter its decisions based onfuture events (e.g., drill based on price of oil, continued R&D depending oninitial results)Copyright 2013 CFA Institute65
ALTERNATIVE TREATMENTS FOR ANALYZINGPROJECTS WITH REAL OPTIONSUse NPV without considering real options; if positive,the real options would not change the decision.Estimate NPV NPV – Cost of real options Value ofreal options.Use decision trees to value the options at differentdecision junctures.Use option-pricing models, although the valuation ofreal options becomes complex quite easily.Copyright 2013 CFA Institute66
COMMON CAPITAL BUDGETING PITFALLS Not incorporating economic responses into the investment analysisMisusing capital budgeting templatesPet projectsBasing investment decisions on EPS, net income, or return on equityUsing IRR to make investment decisionsBad accounting for cash flowsOverhead costsNot using the appropriate risk-adjusted discount rateSpending all of the investment budget just because it is availableFailure to consider investment alternativesHandling sunk costs and opportunity costs incorrectlyCopyright 2013 CFA Institute67
8. OTHER INCOME MEASURES ANDVALUATION MODELS In the basic capital budgeting model, we estimate the incremental cash flowsassociated with acquiring the assets, operating the project, and terminating theproject. Once we have the incremental cash flows for each period of the capitalproject’s useful life, including the initial outlay, we apply the net present valueor internal rate of return methods to evaluate the project. Other income measures are variations on the basic capital budgeting model.Copyright 2013 CFA Institute68
ECONOMIC AND ACCOUNTING INCOMEAccountingIncome Focus on income Depreciationbased on originalcostCopyright 2013 CFA InstituteEconomicIncome Focus on cashflow and changein market value Depreciationbased on loss ofmarket valueCash Flows forCapital Budgeting Focus on cashflow Depreciationbased on taxbasis69
ECONOMIC PROFIT, RESIDUAL INCOME,AND CLAIMS VALUATION Economic profit (EP) is the difference between net operating profit after tax(NOPAT) and the cost of capital (in monetary terms).EP NOPAT – WACC(12) Residual income (RI) is the difference between accounting net income and anequity charge.- The equity charge reflects the required rate of return on equity (re) multipliedby the book value of equity (Bt-1).RIt NIt – reBt–1(15) Claims valuation is the division of the value of assets among security holdersbased on claims (e.g., interest and principal payments to bondholders).Copyright 2013 CFA Institute70
EXAMPLE:ECONOMIC VS. ACCOUNTING INCOMEConsider the Hoofdstad Project again, with the after-tax cash flows as before,plus additional information:YearAfter-tax operating cash flowBeginning market value (project)Ending market value (project)DebtBook equityMarket value of equity1234 35.07 10.00 15.00 50.00 47.74 55.00 46.76 15.00 17.00 50.00 46.04 49.74 32.48 17.00 19.00 50.00 59.72 48.04 12.34 19.00 20.00 50.00 60.65 60.72What is this project’s economic and accounting income?Copyright 2013 CFA Institute71
EXAMPLE:ECONOMIC VS. ACCOUNTING INCOMESolution:YearEconomic incomeAccounting incomeCopyright 2013 CFA Institute1 40.07– 2.262 48.76– 1.693 34.48 13.674 13.34 0.9372
RESIDUAL INCOME METHOD The residual income method requires:- Estimating the return on equity;- Estimating the equity charge, which is the product of the return on equity andthe book value of equity; and- Subtracting the equity charge from the net income.RIt NIt – reBt–1(15)whereRIt Residual income during period tNIt Net income during period treBt–1 Equity charge for period t, which is the required rate of return onequity, re, times the beginning-of-period book value of equity, Bt–1Copyright 2013 CFA Institute73
EXAMPLE: RESIDUAL INCOME METHODSuppose the Boat Company has the following estimates, in millions:YearNet incomeBook value of equityRequired rate of return on equityThe residual income for each year, in millions:YearStep 1Start with Book value of equityMultiply by Required rate of return on equityRequired earnings on equityEquals1234 46 49 56 56 78 81 84 8512% 12% 12% 12%1234 78 81 84 8512% 12% 12% 12% 9 10 10 10Step 2Start withSubtractEqualsNet incomeRequired earnings on equityResidual incomeCopyright 2013 CFA Institute 46 49 56 569 10 10 10 37 39 46 4674
EXAMPLE: RESIDUAL METHOD The present value of the residual income, discounted using the 12% requiredrate of return, is 126 million. This is an estimate of how much value a project will add (or subtract, ifnegative).Copyright 2013 CFA Institute75
CLAIMS VALUATION The claims valuation method simply divides the “claims” of the suppliers ofcapital (creditors and owners) and then values the equity distributions.- The claims of creditors are the interest and principal payments on the debt.- The claims of the owners are the anticipated dividends.Copyright 2013 CFA Institute76
EXAMPLE: CLAIMS VALUATIONSuppose the Portfolio Company has the following estimates, in millions:YearCash flow before interest and taxesInterest expenseCash flow before taxesTaxesOperating cash flow1 804 7630 462 853 8233 493 952 9337 564 951 9438 56Principal payments 11 12 13 141. What are the distributions to owners if dividends are 50% of earnings afterprincipal payments?2. What is the value of the distributions to owners if the required rate of return is12% and the before-tax cost of debt is 8%?Copyright 2013 CFA Institute77
EXAMPLE: CLAIMS VALUATION1.Distributions to Owners:YearStart withAddEqualsInterest expensePrincipal paymentsTotal payments to bondholdersOperating cash flowSubtractPrincipal payments to bondholdersEqualsCash flow after principal paymentsMultiply by Portion of cash flow distributedEqualsEquity distributionStart withCopyright 2013 CFA Institute1234 4 3 2 111 12 13 14 15 15 15 15 46 49 56 5611 12 13 14 35 37 43 4250% 50% 50% 50% 17 19 21 2178
EXAMPLE: CLAIMS VALUATION2.Value of ClaimsPresent value of debt claims 50Present value of equity claims 59Therefore, the value of the firm 109Copyright 2013 CFA Institute79
NPV σt 1 n CFt (1 r)t Outlay (2-1) Or, reflecting the outlay as CF 0, NPV σt 0 n CFt (1 r)t (2-2) where CF t After-tax cash flow at time t r Required rate of return for the investment Outlay Investment cash flow at time zero If NPV 0: Invest: Capital project adds value If N