Transcription
SparkCruise: Workload Optimization in Managed SparkClusters at MicrosoftAbhishek RoyAlekh JindalPriyanka am@microsoft.comXiating Ouyang Ashit GosaliaNishkam RaviUniversity of oft.comSwinky MannPrakhar Jain r.jain@databricks.comABSTRACTToday cloud companies offer fully managed Spark services. Thishas made it easy to onboard new customers but has also increasedthe volume of users and their workload sizes. However, both cloudproviders and users lack the tools and time to optimize these massive workloads. To solve this problem, we designed SparkCruise thatcan help understand and optimize workload instances by adding aworkload-driven feedback loop to the Spark query optimizer. In thispaper, we present our approach to collecting and representing Sparkquery workloads and use it to improve the overall performance onthe workload, all without requiring any access to user data. Thesemethods scale with the number of workloads and apply learnedfeedback in an online fashion. We explain one specific workloadoptimization developed for computation reuse. We also share thedetailed analysis of production Spark workloads and contrast themwith the corresponding analysis of TPC-DS benchmark. To the bestof our knowledge, this is the first study to share the analysis oflarge-scale production Spark SQL workloads.PVLDB Reference Format:Abhishek Roy, Alekh Jindal, Priyanka Gomatam, Xiating Ouyang, AshitGosalia, Nishkam Ravi, Swinky Mann, and Prakhar Jain. SparkCruise:Workload Optimization in Managed Spark Clusters at Microsoft. PVLDB,14(12): 3122 - 3134, k [4] is a widely popular data processing platform that is usedfor a variety of analytical tasks, including batch processing, interactive exploration, streaming analytics, graph analytics, and machinelearning. At Microsoft, Azure HDInsight [26] offers managed Sparkclusters that allow users to start processing their data processingwithout worrying about managing the underlying infrastructure.This work is licensed under the Creative Commons BY-NC-ND 4.0 InternationalLicense. Visit https://creativecommons.org/licenses/by-nc-nd/4.0/ to view a copy ofthis license. For any use beyond those covered by this license, obtain permission byemailing info@vldb.org. Copyright is held by the owner/author(s). Publication rightslicensed to the VLDB Endowment.Proceedings of the VLDB Endowment, Vol. 14, No. 12 ISSN 2150-8097.doi:10.14778/3476311.3476388However, once the data processing tasks are deployed as production workflows, users are largely responsible for optimizing theirworkloads to achieve better performance at lower costs. This is fastemerging as a major pain in cloud data services, more so due tothe lack of DBAs in the cloud environments [21], leading to severalrecent efforts for building new platforms and features that optimizeend to end workloads in the cloud [22, 27, 29, 30].Performance improvements in Spark have come a long way overthe last decade. It started with the initial proposal of resilient distributed datasets (RDDs) in 2010 for improving the performance ofmultiple parallel operations by reusing a working set of data [33].Later, Shark [31] was proposed in 2013 to run declarative Hivequeries (SQL-on-Hadoop) interactively using the Spark processingbackend. The Shark project evolved into Spark SQL [13] for doing relational data processing along with a query optimizer, calledCatalyst, in 2015. While Catalyst was rule-based in the beginning,query costing and cost-based query optimization was later addedto Spark in 2017 [1]. Most recently, given the broader realizationthat it is often hard to make the right query optimization choicesat compile time [16], adaptive query execution was introduced inSpark in 2020 [3]. However, given the breadth of applications anddeployment scenarios that are typically seen in modern data processing systems like Spark, it is still hard to pre-build the right setof optimizations in the system itself. This has led to a new wave ofthinking to instance optimize a data processing system to a givenworkload [23, 30]. In fact, the presence of hundreds of configurations in current Spark codebase aligns with the above line ofthinking that a Spark deployment could be tuned to different workload needs. Unfortunately, it is incredibly hard, if not impossible, tomanually tune these configs or adapt the system to a given workload. Interestingly, modern cloud deployments of data processingsystems offer an unprecedented opportunity to observe and learnfrom large volumes of workloads. As a result, we could build aworkload-driven feedback loop to automatically (and continuously)tune the system from the workloads seen at hand.We presented our overarching vision on how to improve cloudquery engines in [21]. In this paper, we describe SparkCruise, thenext big step in optimizing Spark workloads that we have built for 3122Work done while at Microsoft.
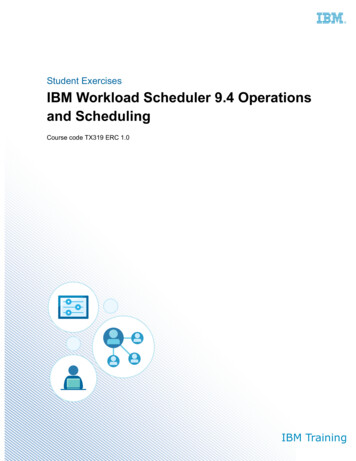
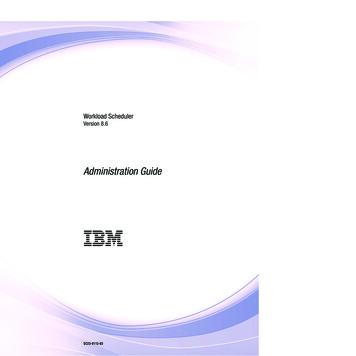
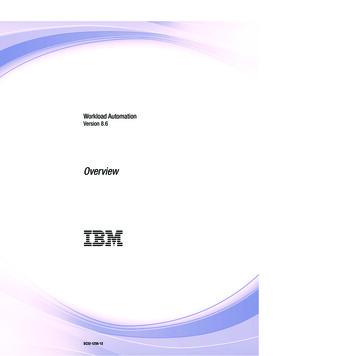
Spark clusters in Azure HDInsight. SparkCruise exposes a workload optimization platform that leverages massive cloud workloadsand provides a feedback loop to the Spark engine for improvingperformance and reducing costs. We demonstrated an early version of the SparkCruise system earlier [28]. Since then we haveadded newer techniques for plan log collection, introduced a scalable telemetry pipeline that runs daily, explored data cleaning andintegration techniques to improve the quality of our common workload representation, analyzed production workloads to characterizethe Spark workloads in HDInsight, provided a notebook for customers to derive insights from their own workloads, and pushedone concrete feature for automatic computation reuse all the way toproduction. We describe the overall system design and extensibilityof SparkCruise, the opportunities for compute reuse in productionSpark workloads, the deployment of SparkCruise in HDInsight,and the experiences from our production journey.Our key contributions can be summarized as follows: We present the SparkCruise platform for adding workloaddriven feedback loop in Spark, and discuss how it transformsSpark engine from optimizing one query at a time to optimizing end to end workloads. (Section 3) We describe a query plan telemetry pipeline for collectinganonymized Spark SQL plans with low overheads and atproduction scale. (Section 4) We introduce a denormalized workload representation forSpark that combines both the compile-time and run-timecharacteristics of the workload and could be used for a variety of optimization features. We discuss the data qualitychallenges in creating this workload representation and showcleaning techniques to overcome them. (Section 5) We present detailed insights from production Spark workloads at Microsoft, including distributions of inputs, applications, queries, operators, cardinalities, selectivities, and planshapes such as width and height. (Section 6) We describe a workload insights notebook that we have builtand released for customers in HDInsight to discover insightsfrom their own workloads. (Section 7) Finally, we drill down into automatic computation reuse as aconcrete workload optimization in Spark that we have builtand released for customers in HDInsight. We discuss thereuse mechanisms and various online and offline policies forview selection and materialization. (Section 8)2SPARK BACKGROUNDThe Spark data processing platform supports a variety of analyticalapplications including batch or interactive analytics over structuredor unstructured data, streaming analytics over constantly arrivingdata, graph analytics over linked data, iterative machine learningalgorithms, and the newer data science applications. Structureddata processing, in particular, has increasingly gained enterpriselevel adoption in the last few years with several large companiesrunning their key ETL workloads using Spark. This has resultedin several trends. First, Spark has become the most active Apacheproject that is visited on GitHub [18], with a vibrant open sourcecommunity of 83 committers [19] and numerous meet-ups aroundthe world [12], Second, there is in-house Spark development at3123several large enterprises such as LinkedIn [24], Facebook [11], andIBM [8], and Third, there are managed Spark services from all majorcloud providers, including Amazon Web Services [5, 9], MicrosoftAzure [6, 7, 26], and Google Cloud [10].At Microsoft, Azure HDInsight allows customers to run popularopen source frameworks — including Apache Hadoop, Spark, Hive,Kafka, and more [26]. Essentially, it abstracts the complexities insetting up and maintaining the cluster, and providing a more managed experience for customers to quickly get started with theiranalytical tasks. For Spark, this means that users can leverage thelatest Spark distributions, easily configure their cluster for differentapplication needs, and monitor and tune the performance and costs.As a result of this better Spark infrastructure experience, we finda large fraction of HDInsight customers running their recurringETL workloads. Others prominent use of HDInsight Spark is forinteractive notebooks that have become very popular for ad-hocanalysis. Interestingly, workload optimization is relevant to boththese usage types: for saving total costs in ETL workloads and forreducing the time to insights in interactive workloads.Spark workloads are made up of applications, each of whichconsist of one or more queries running in the Spark session. Multipleapplications can run in parallel on the same cluster. We focus onSpark SQL queries, i.e, all analytics that compile down to Sparkdataframes and go through the Catalyst query optimizer, whileignoring the programs written directly against the RDDs. This isbecause declarative Spark SQL workloads are more amenable tocharacterization and feedback in the query optimizer layer (withoutaffecting the user expectation on how the programs should beexecuted, as with RDDs), not to mention they also form the majorityof our workloads.In the remainder of the paper, we first provide an overview ofSparkCruise, our workload optimization platform for Spark, beforedescribing each of its components and discussing the features wehave shipped in HDInsight.3SPARKCRUISE OVERVIEWSparkCruise adds a workload-driven feedback loop to Spark toinstance optimize its performance for a given workload. Figure 1shows the overall architecture. As mentioned before, we focus onSpark SQL queries that run through the Catalyst query optimizerand that users expect the system to optimize, as opposed to RDDprograms that are almost like physical execution plans handcraftedby the users. There are four sets of components in Figure 1 that areworth highlighting and we discuss them below.First, SparkCruise provides an elaborate query plan telemetrythat captures Spark SQL query plans in a scalable manner. Thisincludes an additional plan log listener to collect plans in JSONformat, adding identifiers called signatures at each node in thequery plan, anonymizing the plans from any personally identifiableinformation (PII), and collecting the resulting log in both structuredand semi-structured format with varying degree of retention. Thequery plan telemetry is enabled simply via a configuration changeand once collected it could be used for a variety of further analysisby both the service provider and well as the customer themselves.Second, the workload collected above goes through a set of preprocessing to generate a common workload representation that
Figure 1: SparkCruise Architecturecould be used for running the actual workload optimization algorithms. This includes linking the operators in the logical andphysical query plans with the stages in the Spark jobs execution,and cleaning the workload logs for missing or invalid values. Theresulting workload is represented as a denormalized workload table.The workload preprocessing is run over large volumes of workloadsin a distributed manner, i.e., using Spark itself for scaling out thepreprocessing tasks. Furthermore, the preprocessing is done onceand shared across all of the downstream analyses and optimizations.Third, the workload table generated above could be used to derivebetter understanding and insights. Such insights are helpful for boththe service operators as well as the customers. SparkCruise providesa workload insights notebook to quickly analyze the workload tablegenerated for their workloads. The notebook also comes with anumber of pre-canned queries to easily capture the shape, size,performance, and cost of the workload.Finally, the workload table is also used to run optimization algorithms such as materialized view selection [20]. By providing acommon workload representation consisting of both the compiletime and run-time characteristics, SparkCruise democratizes thedevelopment of newer workload optimization algorithms based ona variety of opportunities, e.g., learning cardinality models frompast workloads. We serialize the optimization output into a feedback file and provide that to be loaded into the Catalyst optimizerfor future optimization. The actual optimization action is performedby adding extra optimizer rules using the Spark extensions API,thus turning it into a self-tuning system.In the following sections, we delve into each of the above fourcomponents of SparkCruise in more detail.4QUERY PLAN TELEMETRYWorkload optimizations in SparkCruise are rooted in analyzingand improving the Spark SQL query plans. Therefore, collectingSpark SQL query plans is at the core of SparkCruise. Our designrequirements for adding this observability are five-fold:(1) We do not want to make changes in the core Spark codebase.This is because we want the query plan telemetry to be easily3124(2)(3)(4)(5)collected with open-source Spark as well as with multipledeployments in different Microsoft products.Collecting plan telemetry should have minimal overheads toavoid impact on query performance. This means we shouldbe reusing existing telemetry events and only add additionalinformation wherever required.We need to identify patterns in the query plans in order tolearn from past workloads and apply them in future queries.This requires to annotate query plans with signatures thatcould be used to identify and match interesting patterns.Query plans could contain sensitive information, particularlyin the column and table names. Therefore, we need to scruball such information and protect customer privacy.Finally, we need to support multiple scenarios where thequery plans could be leveraged, from local debugging withinthe cluster to global workload analysis by the cloud provider.Note that in contrast to the recently described Diametrics benchmarking platform at Google [15], SparkCruise captures a rich set ofquery plans (not just the SQL queries) along with associated metadata (run-time statistics to learn from the past behavior of thosequery plans), without copying the customer data. This is becausein contrast to Diametrics, SparkCruise is not limited to internalcustomers and workloads and so access to customer data is notpossible without explicit customer approval.In the remaining of this section, we first describe query plan listener, plan annotations, and plan anonymization, before describingthe telemetry pipeline.4.1Plan ListenerThe first step in adding workload optimization capability to Sparkis to collect the workload traces. Spark already collects telemetryat the level of both applications and tasks, however, the query planlevel details are incomplete. Specifically, the event logs containSpark SQL query plans in text format, same as the one output bythe EXPLAIN command, that is hard to parse and consume later on.Furthermore, many of the lines in the text plans are trimmed in casethey are too long. So we need a more reliable format for query plantelemetry. Fortunately, the LogicalPlan object in Catalyst contains
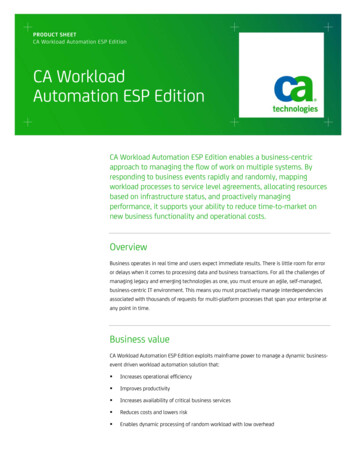
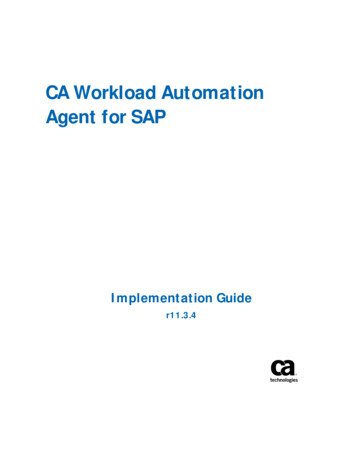
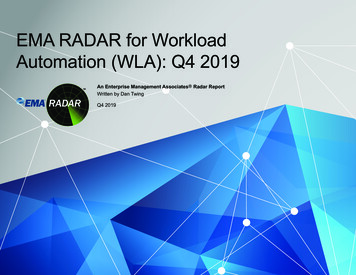
a method to serialize a query expression in JSON format. We haveleveraged this by implementing a custom listener that logs the Sparkquery plans in JSON. The listener is invoked at the end of everyquery execution (i.e., SparkListenerSQLExecutionEnd event). Ourlistener emits the JSON plans from all four stages, namely the parsedplan, analyzed plan, optimized plan, and the physical execution plan.Later on, the workload optimization algorithms ingest workloadtraces and provide feedback to the query optimizer.The above plan listener has very low overhead, e.g., in the order0.5 seconds for TPC-DS queries. Still, we discovered that customerssometimes end up machine generating very large Spark SQL plansin their production workloads. These large plans could contain 10sof thousands of nodes in the parsed query plans, that lead to out ofmemory errors in one specific case. Therefore, we added additionalchecks to limit the plan logging for extremely large query plans. Forexample, if parsed and analyzed plans are found to be too big thenwe attempt to log only the subsequent plans (optimized, physical)as they are typically smaller than the initial plans.4.2Plan AnonymizationSparkCruise only analyzes workload metadata, with no access tocustomer data. Still, the filenames, table names, and column namescould potentially contain keywords or identifiers relevant to different customer businesses. Therefore, SparkCruise anonymizesSpark SQL query plans by obfuscating the column and table names.Furthermore, we also obfuscate any literal values in the querypredicates (filter or join predicates) to avoid leaking any customeridentifiable information. We apply the same obfuscation to parsed,analyzed, optimized, and physical plans. However, we preserve thecolumn reference ids that track columns within a query plan fromleaf to the root of the plan.4.45WORKLOAD REPRESENTATIONIn this section, we describe the steps to transform raw events into ashared workload representation. A shared workload representationremoves the time consuming step of data collection and integrationfrom each optimization algorithm. We also explain the relationalformat of the workload representation and why it has been widelyadopted by downstream optimization algorithms.Plan AnnotationsGiven that the goal of SparkCruise is to learn from the past Sparkworkloads and apply feedback to future queries, we want to identifypatterns in query plans for future feedback. Therefore, we annotateevery node in the query plan with identifiers, called signatures,that can be used for providing targeted feedback to future queries.Signatures are recursive hashes of the query plan nodes that captureboth the node-level details as well as the query plan structure. Wecould further decide on which nodes and what levels of detailsin those nodes to include in the signature hash, thus capturingdifferent kinds of query plan patterns. We describe the two kinds ofsignatures that we provide by default, although, our design allowsto easily add newer signatures: (1) Strict Signatures capture thecomplete information at the node level and its children. At the leaflevel it also includes the dataset version. (2) Recurring Signaturesalso capture the information at the node level and its children.However, it ignores the literal values and the dataset version.4.3each event and all plans and other metadata as JSON values in thatrow. We then push these event rows into several backends: (1) anoptional user defined Azure Blob Filesystem location for users torun their own workload analysis later on, (2) Azure Data Explorertables for interactive analysis, typically by the service operators,with a smaller retention window, and (3) Cosmos storage (compressed formats) for historical analysis over larger time windows.The above Spark events are also collected in the application logon the local cluster, for any real-time debugging or analysis by theusers themselves.Telemetry PipelineWe feed the annotated and anonymized query plans into a telemetry pipeline consisting of several end points, each for different setof scenarios, as shown in Figure 1. The annotated and anonymizedquery plans are emitted as Spark events that are captured by theSparkFirehoseListener and converted into rows, with one row for31255.1Plan LinkingAt the end of query execution, SparkCruise collects different plansrelated to query processing, namely parsed plan, analyzed plan, optimized plan, physical plan, and executed plan. Each plan in this listis derived from the previous plan. However, Spark does not preservethe provenance information between individual nodes of the different plans. This makes it impossible to get the runtime cardinalitiesand costs for logical operators. Specifically, SparkCruise appliesview materialization and reuse based on signatures computed onoptimized logical plan, but the cost-based view selection needs toconsider the cost of logical operators as well. So, we attempt to linkthe nodes from different plans during workload preprocessing.We include two plan linking algorithms for logical and physicalquery plans: (1) Top-down heuristic based - This method starts fromthe root node and links nodes from two query plans using a setof predefined heuristics. For example, this method skips the Exchange operator that is present in physical plans but not in logicalquery plans. Similarly, a logical Join operator can be convertedinto Exchange, Sort, and SortMergeJoin physical operators. Thismethod uses lexical similarity when matching nodes in logicalplans and their corresponding physical implementations such asAggregate and HashAggregate. (2) Bottom-up similarity based - Weextended Cupid [25], a generic schema matching system for SQLtables, to match query plans. Cupid uses weighted lexical similarityand structural similarity score for every pair of sub-trees in logicaland physical plans to find the best match between nodes. We usethe same set of rules for lexical similarity as the top-down heuristicmethod. From our experience, we have found (1) to be preferable,especially as it is easier to debug. Going ahead, we would like tomaintain the provenance information inside the Spark optimizeritself to avoid this post-processing linking of plans.The next linking between nodes in Spark physical plans andexecuted plans involves a simple tree traversal. Figure 2 showsan example of the links between optimized logical plans and theexecuted plan. After the plans linked together, we can assign signatures computed on optimized logical plans to the cost of the
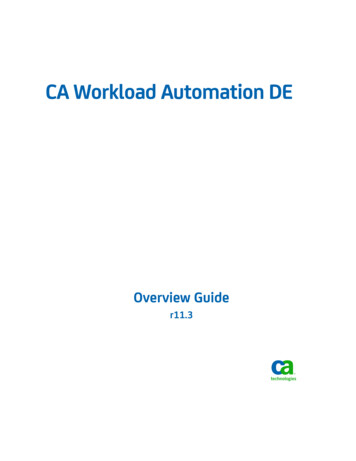
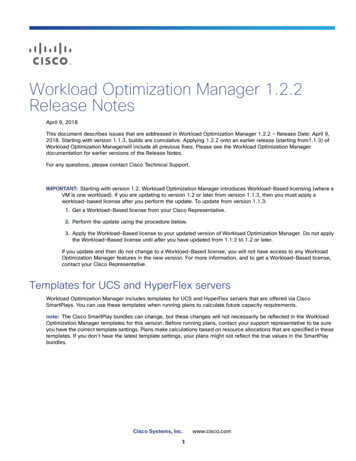
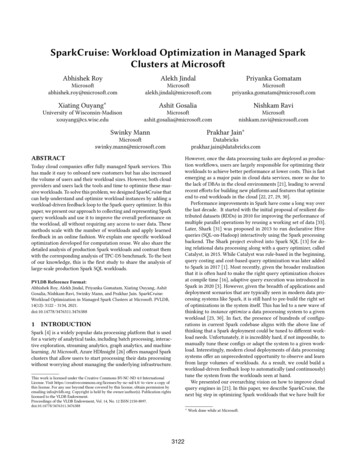
(2) Spark reports the running time for every stage in query plan.We divide the stage-level running time among the operatorswith missing running times in the stage node . With the imputed running time per operator, we can calculate the serialtime cost of a subexpression in plan as the sum of times fromindividual operators. The serial time of subexpressions alongwith output cardinality is used by the cost-based view selection algorithms to select views with high savings potentialand low materialization costs.5.3Figure 2: Linking of nodes in optimized logical plan (left)and executed plan (right).Figure 3: Linking different entities in Spark workloads.corresponding physical operator. This allows us to develop costbased workload optimization algorithms and apply feedback duringquery optimization using signatures.5.2Data CleaningAt the end of query execution, Spark reports runtime metrics suchas cardinality, time, and memory. However, these metrics are mostlyat the stage level (multiple operators combined together) and fewmetrics are reported for individual operators. Thus, even after linking query plans we do not have metrics for most of the logicaloperators. To solve this problem we perform a few data imputationsteps to assign metrics to individual operators. We describe twoimputation strategies for row cardinalities and running time –(1) Spark provides runtime cardinality metrics at different nodesin the query plans, generally for operators where cardinalitychanges such as scan, filter, aggregates, and joins. To getthe cardinalities for remaining operators, we perform a postorder traversal of query plans and, if cardinality is missing,then we copy the cardinalities from the child node. For someoperators such as Join, in case of missing cardinality, we takethe maximum cardinality among all child nodes.3126Workload TableWorkload table is the foundation for workload optimization algorithms. The workload table combines different entities in Sparkapplications, such as application metadata, query metadata, metrics,query plans, and annotations to create a tabular representation ofthe workload. In this section, we will describe the steps performedto create the workload table from raw events.As explained in Section 4.4, the anonymized telemetry data canbe stored in multiple locations (from storage accounts to databases)depending on the type of analysis. The collected telemetry is transformed to workload table by the Workload Parser Spark job. TheWorkload Parser job has connectors to read and write the datafrom different sources. Workload Parser can independently processthe telemetry belonging to each Spark application. This allows theWorkload Parser job to scale with the number of applications inthe workload.The Workload Parser job recreates the hierarchy of entities in aSpark workload. Figure 3 shows the typical entities in a Workloadthat include Applications, Queries, Plans, Metadata, and Metrics.These entities are parsed from the events in JSON format. For example, the preorder traversal of query plans is serialized in JSONformat and the Workload Parser job recreates the query plan graphfrom the serialized format. The Workload Parser also performs thenecessary plan linking and data imputation steps. Then, these linkedentities in the workload are exported as a denormalized workloadtable. The workload table has one row per physical operator. Eachrow of the workload table contains the details of physical operator, application-level metadata, query-level metadata, linked logicaloperator details, and compile-time and run-time statistics. Table 1shows a subset from the workload table. There is a lot of repeatedmetadata information in the workload table. We have found thathaving a single denormalized workload table with all the availableinformation removes the need for complex data processing steps bydownstream workload optimization algorithms. After this step, theworkload table is available for processing by workload optimizationalgorithms and for visualization via Workload Insights Notebook.6PRODUCTION INSIGHTSIn this section, we show insights from production Spark workloads at Microsoft with the goal to understand the volume, shapes,sizes, costs, and other aspects of production Spark SQL queries.Later in the next section, we contrast these with TPC-DS queries, apopular benchmark for analytical workloads. We consider a largesubset of daily workloads from HDInsight consisting of 176 clusters from 114 Azure subscriptions, and consisting of 34,834 Sparkapplications with 349,366 Spark SQL query statements (a mix of
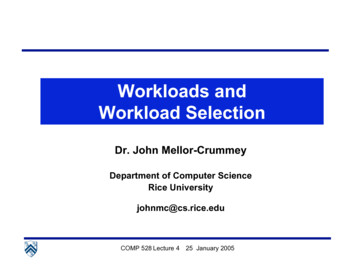
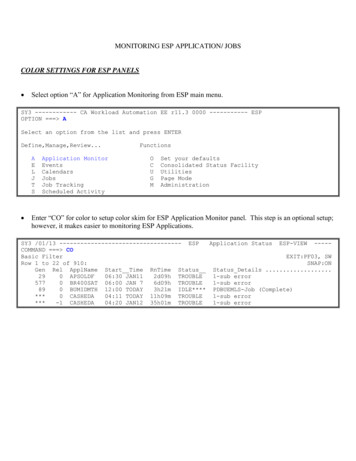
Table 1: Illustrating a subset of attributes and rows from the workload table for TPC-DS workload. Each row in workload tablecorresponds to a physical operator. The columns include application-level metadata, query-level metadata, linked logicaloperator details (e.g., Signatures), compile-time (e.g., EstCard, RowLen) and run-time statistics (e.g., ActualCard, a) CDF of tenants per 226018446744071904119269(b) CDF of applications per Len64420124OpTime21733218223(c) CDF of queries per applicationFigure 4: Distribution of tenants, applications, and queries among HDInsight customers.(a) CDF of input cardinalities(b) CDF of sum of input cardinalities per query(c) CDF of filter selectivitiesFigure 5: Input and filter cardinalities for Spark workloads.streaming and non-streaming queries) and a total 1,438,411 querysub-expressions. Note that we already segregate all catalog queries,and so the above workload consists of purely the DML operations.We applied the same workload steps to this workload as describedin the previous section, i.e., plan linking and data cleaning, and derive several insights from the resulting workload table. To the bestof our knowledge, this is the first study showing detailed analysisfrom large-scale production Spark SQL workloads.(see Figure 4a). We see a similar skew in the number of applicationsper tenant (see Figure 4b). Many tenants have very few applications,yet almost 30% tenants have 100𝑠 of applications per tenant and 5%have 1000𝑠 of applications per tenant. Finally, the number of queriesper application demonstrates the largest skew (see Figure 4c). Mostapplications have less than 10 queries and only 5% have queriesin double digits. It is interesting to note that the bulk of workloadconsists of shorter (in number of queries) applications.6.16.2Subscriptions, Tenants, ApplicationsHDInsight customers with Azure subscriptions can create one ormore tenants (or clusters). Each tenant can run multiple applications, and application can have multiple Spark SQL queries. Figure 4shows the CDFs for the number of tenants per subscriptions, application per tenants, and Spark SQL queries per application. Wecan see that while most customers work with just one tenant persubscription, about 30% have multiple tenants for each subscription3127InputsWe now analyze the size of the inputs that are processed by theSpark SQL queries. Figure 5 shows the CDFs for input table cardinalit
queries (SQL-on-Hadoop) interactively using the Spark processing backend. The Shark project evolved into Spark SQL [13] for do-ing relational data processing along with a query optimizer, called Catalyst, in 2015. While Catalyst was rule-based in the beginning, query costing and cost-based query optimization was later added to Spark in 2017 [1].