Transcription
Sample ProposalUpdated 03/2020RDC Research ProposalDate:Title of Project:NCHS Data System and Years:Non-NCHS Data Files:Mode of Access:Statistical Software:(Check all that apply)Proposed Start Date:Funding Source:Billing Address:(include contact person)General InformationNovember 22, 2019;The Association Between Serum Vitamin D Levels and ChildhoodObesityNHANES 2003-2006N/A[X] NCHS RDC, Hyattsville, MD[ ] NCHS RDC, Rockville, MD[ ] NCHS RDC, Washington, DC (Government Only)[ ] NCHS RDC, Atlanta, GA[ ] Federal Statistical RDC, specify:[X] SAS/SUDAAN [ ] Stata [ ] Other, specify:May 1, 2020Funded by the National Institute for Obesity Research, Grant No. 555Ima Business ManagerUniversityDepartment1234 Research Way, Room 789City, State, 12345imabusiness@email.com555-555-78901
Sample ProposalUpdated 03/2020List the name, institution, contact information, and role for anyone who will contribute to publications resultingfrom this project. Everyone listed must submit a C.V or resume. Add sections as needed.Research TeamRole:Principal InvestigatorCo-InvestigatorSSS Status?US Citizen? Y or Mailing AddressNameEmailPhoneInstitutionMailing AddressSSS Status?US Citizen? Y or NNameEmailPhoneInstitutionMailing AddressSSS Status?US Citizen? Y or NLee 234 Research Way, Room 789City, State 12345Dolce 234 Research Way, Room 789City, State 12345Jake ent1234 Research Way, Room 789City, State 12345YYAdvisor (For Students and Post-Docs)[ ] RDC-Student-Advisor Form2Other, specify:
Sample ProposalUpdated 03/2020Complete as applicable for your project. Address any “Yes” responses in the body of the proposal.RDC Proposal Summary InformationYESNOGeographic variablesLevel of geography to be shown in output (check all that apply)NationalRegionalStateMSACountyUrban/rural classificationCensus tractLatitude/LongitudeOther*Will geographic identifier(s) be removed after mergeIf yes, can true geographic identifiers be replaced with masked versions of these variablesIs GIS or mapping proposedXXXXXXXXXXXXDates and Temporal informationAre exact dates requested other than to calculate time of follow-upIf more than 1 year/cycle, will years/cycles be presented separatelyXXMerging of data with NCHS restricted dataAre external data being merged with NCHS dataXLinked Data ProductsAre you requesting linked Medicare/Medicaid filesIf yes, are you using multiple yearsAre you using public-use mortality dataXXX*Explanation: LAT Location (latitude) of residence will be used to control for sun exposure. After the RDCanalyst creates a derived variable for latitude of sun exposure with two values (North and South), the LAT will beremoved from the analytic file.3
Sample ProposalUpdated 03/2020A. Abstract: Please limit the project description abstract to 300 words.Obesity has been linked to vitamin D deficiency in adults and adolescents. We aim to determine if an associationexists between obesity and inadequate serum vitamin D levels among U.S. children. We will use serum 25hydroxyvitamin D (vitamin D) and body measurement data from U.S. children aged 6–18 years examined in theNational Health and Nutrition Examination Survey (NHANES) from 2003–2006 and evaluate the relationshipbetween serum vitamin D levels and obesity, defined as a body mass index (BMI) 95th percentile. Vitamin Dlevels will be dichotomized as deficient ( 15ng/ml) or not deficient in logistic regression models to assess oddsof vitamin D deficiency accounting for age, sex, race/ethnicity, poverty status, and vitamin D-containingsupplement use. We seek to adjust for two additional factors associated with serum vitamin D levels that mayinfluence our results: latitude of residence and season of lab testing. These variables are restricted and onlyavailable through the Research Data Center.B. Research Question: Describe study purpose, hypotheses, goals, or research questions. What is the relationship between vitamin D deficiency and obesity in US children aged 6-18 years?How does latitude of residence and season of lab testing influence this relationship?C. Background: Include a short literature review, no more than 2 pages, focusing on papers that discuss yourtopic and address the methodology that you plan to use. Please limit your reference list to 10 items orless.Vitamin D is a fat-soluble vitamin needed for promoting calcium absorption in the gut andultimately enabling normal bone mineralization. It is also needed for bone growth and remodeling and has morerecently been discovered to be involved in other physiologic processes, including modulation of neuromuscularand immune function, as well as reduction of inflammation. It may also play a role in modulating cancer cellproliferation. The growing evidence that vitamin D may help prevent several chronic diseases prompts the needto identify individuals at risk for vitamin D deficiency.Humans get vitamin D from their diet, in dietary supplements, and from exposure to sunlight. People living athigher latitudes have been shown to have lower levels of serum vitamin D compared with those living in lowerlatitudes, and levels of serum vitamin D are highest during the summer months when sun exposure is greater.Examination of the relationship between serum vitamin D levels and obesity is done using logistic regressionanalysis, with vitamin D deficiency as the binomial outcome and obesity as the binomial primary explanatoryvariable. Other important covariates we have adjusted for in our analyses thus far (using publicly accessibleNHANES data) include: age, sex, race/ethnicity, poverty status, and the use of vitamin D-containingsupplements. Because exposure to sunlight is also an important factor to account for when measuring serumvitamin D levels, we want to adjust for latitude of residence and month/season of lab draw, in addition to theother mentioned covariates. These variables are only available through the RDC.D. Public Health Benefit: In one paragraph, how does your research benefit public health?Our study seeks to examine the relationship between serum vitamin D levels, measured as 25- hydroxyvitamin Dand dichotomized as vitamin D deficient or not, and obesity, defined as a BMI 95th percentile for age, inchildren aged 6–18 years. Prior research in adolescents and adults has shown a positive association between4
Sample ProposalUpdated 03/2020vitamin D deficiency and obesity. By establishing an association between low serum vitamin D levels and obesityin children across a wider age range, we aim to identify an easy- to-obtain and objective measure with which totarget children who may be at greater risk for vitamin D deficiency. Using this measure, children deficient invitamin D may be more readily identified and started on supplementation to correct it. Because vitamin D maybe involved in improving other health measures or preventing other chronic diseases or conditions, treatingdeficiency may have benefits that extend beyond improved bone health.E. Data Requirements:Please address the four items below and provide an explanation for “yes/checked” responses from the RDCProposal Summary Information Table.1. Survey, Years, Files:List survey name(s) and survey years you would like to access. For examples, NHIS 2005-2007Household, Person and Sample Adult Files, NAMCS 2005-2006 Provider and Patient Visit Files, orNHANES 2005-2006 Examination and Demographic Files.NHANES 2003-2006Demographic variables and sample weightsPhysical examination measurementsLab component: Vitamin DDietary supplements questionnaire2. Restricted-use Data:List and describe the restricted-use variables that you will need. These variables must be listed in theData Dictionary section of this proposal. Explain why each variable is needed and how you will includethem in your analysis. Specify how geographic variables, if applicable, will be used to merge files,analyze the data and/or be presented in output.LAT Location (latitude) of residence will be used to control for sun exposure.Here are categories for the derived variable:ifLAT is missing then assign the value . to the new variable;else if LAT Xthen assign the value 1 to the new variable;else if LAT is Xthen assign the value 2 to the new variable.LAT can be dropped after the derived variable for sun exposure is created.Month of MEC exam/lab draw will be used to control for season.Here are categories for the derived season variable:Ifmonth of exam in (1, 2, 12)then Season Winter;else if month of exam in (3, 4, 5)then Season Spring;else if month of exam in (6, 7, 8)then Season Summer;else if month of exam in (9, 10, 11)then Season Fall;else Season .Month of MEC exam/lab draw can be dropped after the derived variable Season is created.3. Non-NCHS Data:5
Sample ProposalUpdated 03/2020If you plan to provide data from another source (such as Census or EPA) to merge to the restricted-usedata, please describe the source, list the filename(s), and provide a general description of the nonNCHS data. The variables from the non-NCHS data must be listed in the Data Dictionary section.N/A4. Merge Variables:In detail, please describe the merge procedures needed to produce your analytic dataset(s). Highlightthe variables used in the merge routine in the Data Dictionary. Leave blank if not applicable (e.g.NHDS, NAMCS/NHAMCS, Mortality, Natality, and DHHS Hosted Data Users). Note: The RDC Analystwill merge the data for you.SEQN will be used to merge the public and restricted data files.F. Methodology:We highly recommend you familiarize yourself with the analytic guidelines of the data you intend to use. Anydeviations from the methodology suggested in the guidelines will require explanation as it may pose adisclosure risk. Please address these three items in your proposal:1. Unit or Level of Analysis and Subpopulation(s):There can be many levels of analysis: be as detailed as possible in your description. A commonexample for an analysis using NHANES data is where the unit of analysis is the person while thesubpopulation is adults ages 18-64. A common example involving geography is when the researcheraggregates persons to the state level to make comparisons between state policies.Unit of Analysis – individualSubpopulation – Children 6-18, excluding pregnant females, those with implausible BMIs, and those withmissing covariate data.2. Analysis Plan: Provide an overall analysis plan that specifies what analytic procedures or models youwill use, such as prevalence estimates, logistic regression, or log-linear modeling. Also, list the specificstatistical package procedures you will use.We have already performed logistic regression analyses using SAS-callable SUDAAN on the public useNHANES data for 2003–2006. The outcome is serum vitamin D level and is dichotomized into “deficient”( 15ng/ml or the 10th percentile) or “not deficient” ( 15ng/ml). The primary explanatory variable isobesity (or BMI 95th percentile for age) and is categorized as yes or no. The remaining covariatesinclude: age (as a continuous variable, in years, for one analysis), age group (categorized into 6–9 years, 10–12 years, 13–15 years, and 16–18 years, for aseparate analysis), sex (male or female), race/ethnicity (categorized as Non-Hispanic white, Non-Hispanic black, Mexican American, andother races, including multiracial), poverty status (categorized as 2.0 PIR or 2.0 PIR), and vitamin D-containing supplement use (yes or no),6
Sample ProposalUpdated 03/2020 latitude of residence (North vs South);season of MEC lab draw (Winter, Spring, Summer, Fall).3. Complex Survey Design: Indicate how you will address sample weights, design variables, and otheradjustments for the use of complex survey data, if applicable, using the statistical software listed inthe General Information area. A detailed description per weight, design variables, and otheradjustments are required and central to understanding the limitation of the data. This is a criticalelement to describe and is central to the proposal review process.Our codes account for weighting and a complex sample design, where WTMEC4YR 1/2x WTMEC2YR for this 4-year sample. Example logistic regression code follows:proc rlogist data out.vitdobese 4 filetype sas design wr;nest sdmvstra sdmvpsu/missunit;weight wtmec4yr;subpopn include 1/name "6-18 year olds, no pregnant females";class obese sex raceth fampir vitdsup/nofreqs;reflevel obese 0 sex 1 raceth 1 fampir 2 vitdsup 2;model vitd10 obese sex raceth fampir vitdsup examageyr;etc.G. Output:Please describe in full detail all the output you need to look at in order to ensure that the data file created foryou is correct and complete. NCHS will only provide you with a SAS proc contents as the default if you do notspecify any additional output needed.Please describe in full detail all the output you would like to take out of the RDC that is needed for the finalproduct you wish to create. Please be very specific in describing your output needs (i.e., state groupings,levels of output and how restricted-use data will be displayed) as this section is necessary for the ReviewCommittee to assess disclosure risk of your output. Your examples should reflect the geographic variables youwill use in your output. Note: Any output produced in the RDC that is not listed in your proposal will not beallowed out of the RDC.1. Output Needed to Confirm Accuracy of Analytic Dataset: Since your RDC Analyst will create youranalytic dataset, please describe what output you need to review to ensure that your dataset wasconstructed accurately and is complete (e.g., need to review univariate frequencies of certainvariables – please specify).We request SAS code of the merge, log file, and PROC CONTENTS of the merged datasets. Also, wewould like univariate frequencies of the following variables, all the years of the survey combined:SDDSRVYR, AGEGROUP, SEX, latitude of residence (North, South, missing), and season of MEC lab draw(Winter, Spring, Summer, Fall, missing).2. Table Shells: Include detailed examples of all table shells, models, and/or graphs with titles. Indicatethe subsample and unit of analysis used in each type of table, model, or graphs. No graphical output isreleased by the RDC; you need to provide a table from which you can create graphs. Your proposalwill not be approved without this information.7
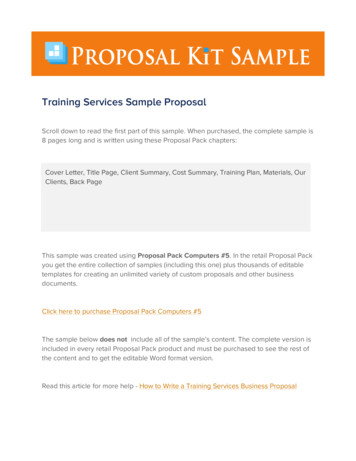
Sample ProposalUpdated 03/2020Table 1: Weighted histogram of serum vitamin D levels in the sample population, NHANES 2003-2006.We will present 2 additional histograms by age group as well (e.g., 6–12 years old and 13–18 years old).Total 3 tables.Histograms will be created from output that looks like this:BMI PercentileVitamin D 15ng/mlVitamin D 15ng/ml5102550758859095
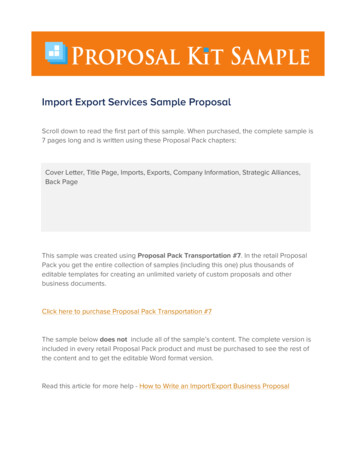
Sample ProposalUpdated 03/2020Table 2: Summary statistics of the weighted percentage breakdown for each covariate and theoutcome (vitamin D deficiency) in the sample population of 6–18-year-old, NHANES 2003-2006.CovariatesUnweighted NVitamin D 15 hnicityNon-Hispanic white,Non-Hispanic black,Mexican American,other races, including multiracialPoverty status 2.0 PIR 2.0 PIRVitamin D Supplement outh9Vitamin D 15 ng/ml
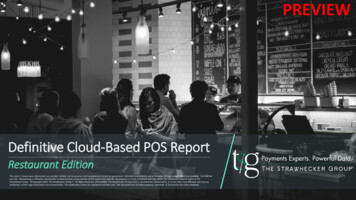
Sample ProposalUpdated 03/2020Table 3: Results of any significant univariate analyses for vitamin D deficiency status and eachcovariate, presented in odds ratios, NHANES Race/EthnicityNon-Hispanic white,Non-Hispanic black,Mexican American,other races, including multiracialVitamin D 15 ng/mlVitamin D Supplement outh10Vitamin D 15 ng/ml
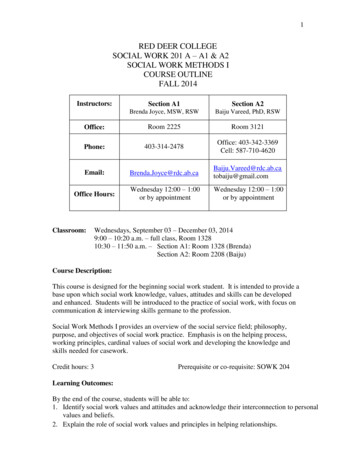
Proposal FormatUpdated 09/2019Table 4: Results of logistic regression analyses for vitamin D deficiency, adjusted for age, sex,race/ethnicity, poverty status, latitude of residence, season of exam, vitamin D supplement usepresented as adjusted odds ratios. NHANES 2003-2006.If any significant interactions are found, they will also be presented, with corresponding p-values.Vitamin D 15 ng/mlBMI 95th PercentileInteractions:Vitamin D 15 ng/ml3. Presentation of Results: Describe how you will present the results (in a report, publication in a peerreviewed journal, presentation at a scientific meeting, or used for internal policy analysis).Presentation to EIS officers and potential peer-review publication.H. Data Dictionary:Include a data dictionary for each data source. Provide a public-use and restricted-use data dictionary forNCHS survey data. This should be a listing of variables you would like in your dataset. Also, provide a datadictionary for any non-NCHS data you want to use. See instructions and examples for creating the datadictionary. When asking for multiple years of data, make sure to reflect the public-use file layout for each yearas variable names can change over years. Include all explanations in Section E. Data Requirements.Note: NHDS, NAMCS/NHAMCS, Mortality, Natality, and DHHS Hosted Data Users: Provide a single datadictionary that includes all the variables (public-use and restricted-use) you would like extracted for youranalytic data set.1. NCHS Restricted Data DictionaryVariable NameSEQNLATEXAMDATEVariable DescriptionSequence Number – Used for Merging to Public DataLatitude of residenceDate of MEC exam/lab draw2. NCHS Public Use Data DictionaryVariableVariable DescriptionSEQNSDMVSTRASequence Number – Used for Merging to Restricted DataPseudo-stratum, used to identify segment in individualcountiesPseudo-primary sampling unit, used to identifyhouseholdsSurvey year (3 2003–2004, 4 2005–2006)½ x WTMEC2YR, used to extrapolate sample data toentire population for the entire 4-year study periodPregnancy status of participantSerum 25-OH vitamin D level, in ng/mlSDMVPSUSDDSRVYRWTMEC4YRRIDEXPRGVIT DData availability, by cycle2003-20042005-2006XXXXXXXXXXXXXX
Sample ProposalUpdated FAMPIRVITDSUPINCLUDEVitamin D deficiency: yes (serum 25-OH vitamin D 15ng/ml or 10th percentile), or no (serum 25-OHvitamin D 15ng/ml or 10th percentile)BMI percentile for age (in months), calculated with a prewritten program using height (BMXHT) and weight(BMXWT) variables measured on bmx data setsObesity status, categorized as yes (BMIPCT 95thpercentile) or no (BMIPCT 95th percentile)Age, in years (converted from RIDAGEEX or age, inmonths, at time of MEC exam, divided by 12)Age, in years (EXAMAGEYR), categorized as 6-12 years,13-18 yearsGender, 1 - male, 2 - femaleRace/ethnicity (same as RIDRETH1, except for adding“Other Hispanic” into the “Other race, includingmultiracial” category)Poverty status (INDFMPIR categorized as a povertyincome ratio 2.0 or 2.0)Vitamin D-containing supplement use (determined byfinding any dietary supplements taken by eachparticipant that contained an ingredient of vitamin D),categorized as yes or noSample selection variable, excluding pregnant females,those with implausible BMIs, and those with missingcovariate dataXXXXXXXXXXXXXXXXXXXX3. Non-NCHS Data Dictionary: N/AI. Literature References: Please provide a list of up to 10 references that are relevant to your project.J. Resumes/C.V.: Please include a 2-page C.V. for each member of the research team (not as attachments).12
latitudes, and levels of serum vitamin D are highest during the summer months when sun exposure is greater. Examination of the relationship between serum vitamin D levels and obesity is done using logistic regression analysis, with vitamin D deficiency as the binomial outcome and obesity as the binomial primary explanatory variable.