Transcription
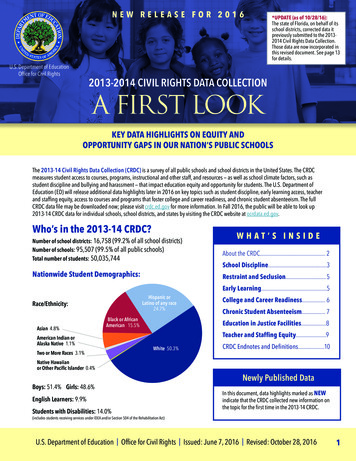
NEW RELEASE FOR 2016U.S. Department of EducationOffice for Civil Rights*UPDATE (as of 10/28/16):The state of Florida, on behalf of itsschool districts, corrected data itpreviously submitted to the 20132014 Civil Rights Data Collection.Those data are now incorporated inthis revised document. See page 13for details.2013-2014 CIVIL RIGHTS DATA COLLECTIONA FIRST LOOKKEY DATA HIGHLIGHTS ON EQUITY ANDOPPORTUNITY GAPS IN OUR NATION’S PUBLIC SCHOOLSThe 2013-14 Civil Rights Data Collection (CRDC) is a survey of all public schools and school districts in the United States. The CRDCmeasures student access to courses, programs, instructional and other staff, and resources — as well as school climate factors, such asstudent discipline and bullying and harassment — that impact education equity and opportunity for students. The U.S. Department ofEducation (ED) will release additional data highlights later in 2016 on key topics such as student discipline, early learning access, teacherand staffing equity, access to courses and programs that foster college and career readiness, and chronic student absenteeism. The fullCRDC data file may be downloaded now; please visit crdc.ed.gov for more information. In Fall 2016, the public will be able to look up2013-14 CRDC data for individual schools, school districts, and states by visiting the CRDC website at ocrdata.ed.gov.Who’s in the 2013-14 CRDC?Number of school districts: 16,758 (99.2% of all school districts)Number of schools: 95,507 (99.5% of all public schools)Total number of students: 50,035,744Nationwide Student Demographics:Asian 4.8%Black or AfricanAmerican 15.5%American Indian orAlaska Native 1.1%Two or More Races 3.1%School Discipline.3Early Learning.5College and Career Readiness. 6Chronic Student Absenteeism. 7Education in Justice Facilities.8Teacher and Staffing Equity.9White 50.3%Native Hawaiianor Other Pacific Islander 0.4%Boys: 51.4% Girls: 48.6%English Learners: 9.9%Students with Disabilities: 14.0%About the CRDC. 2Restraint and Seclusion. 5Hispanic orLatino of any race24.7%Race/Ethnicity:WHAT’S INSIDECRDC Endnotes and Definitions.10Newly Published DataIn this document, data highlights marked as NEWindicate that the CRDC collected new information onthe topic for the first time in the 2013-14 CRDC.(includes students receiving services under IDEA and/or Section 504 of the Rehabilitation Act)U.S. Department of Education Office for Civil Rights Issued: June 7, 2016 Revised: October 28, 20161
NEW RELEASE FOR 2016About the CRDCWhat’s Coming Next In The CRDC?The purpose of the CRDC is to obtain data related to the obligationof public school districts and of elementary and secondary schoolsto provide equal educational opportunity. Since 1968, the CRDC hascollected a variety of information, including student enrollment andeducational programs and services data that are disaggregated byrace/ethnicity, sex, English learner status, and disability, from publicschools across the nation.The CRDC is a longstanding and important aspect of the Office forCivil Rights' overall strategy for administering and enforcing thecivil rights statutes for which it is responsible. Other ED offices, aswell as policymakers and researchers outside of ED, also use CRDCinformation. Additionally, the CRDC database, with hundreds of dataelements, is fully accessible to the public. School districts self-reportand certify all data presented.The CRDC is a mandatory data collection, authorized under thestatutes and regulations implementing Title VI of the Civil RightsAct of 1964, Title IX of the Education Amendments of 1972, Section504 of the Rehabilitation Act of 1973, and under the Departmentof Education Organization Act (20 U.S.C. § 3413). The regulationsimplementing these provisions can be found at 34 CFR 100.6(b); 34CFR 106.71; and 34 CFR 104.61.For more information about the CRDC, please visit crdc.ed.gov.What’s in the 2013-14 Civil RightsData Collection?n The 2013-14 CRDC provides equity and opportunity data ona wide array of topics, including:Topics collected for the first time in the 2013–14 CRDC asoptional data items, and that will be collected from everyschool in the 2015–16 CRDC, include: Allegations of bullying or harassment on the basesof sexual orientation and religion Discipline-related transfers to alternative schools Number of students participating in education programs injustice (detention, correctional or residential) facilities, bynumber of days of participation Preschool corporal punishment Number of instances of and school days missed due to outof-school suspensions Number of criminal acts committed at school that wouldlead to discipline Number of preschool children enrolled in district who areserved in non-district facilities Number of students enrolled in distance education, dualenrollment/dual credit, and credit recovery programs Access to instructional aides, support services staff,psychologists, social workers, nurses, and schooladministrators Number of security guards and sworn law enforcement/school resource officers Teacher churn/turnovern NEW Data topics now available in the 2013–14 CRDCinclude: Bullying and harassment Chronic student absenteeism Early learning Availability of free or partial-payment preschool in schooldistricts Pathways to college and career readiness (including access tomath/science and AP courses) Restraint and seclusion Educational access in justice (detention, correctional orresidential) facilities Civil rights coordinators in school districts School finance Prevalence of and student participation in interscholasticathletics Student discipline Sworn law enforcement/school resource officers in schools Access to distance education courses, credit recovery, anddual enrollment/dual credit programs Teachers and other school personnel22013-2014 Civil Rights Data Collection A FIRST LOOK
NEW RELEASE FOR 20162013-14 CRDC DATA HIGHLIGHTS: A FIRST LOOK †School Disciplinen Black public preschool children are suspended from school at highrates: Black preschool children are 3.6 times as likely to receive one or moreout-of-school suspensions as white preschool children. Black children represent 19% of preschool enrollment, but 47% ofpreschool children receiving one or more out-of-school suspensions;in comparison, white children represent 41% of preschool enrollment,but 28% of preschool children receiving one or more out-of-schoolsuspensions. Black boys represent 19% of male preschool enrollment, but 45% of malepreschool children receiving one or more out-of-school suspensions. Black girls represent 20% of female preschool enrollment, but 54%of female preschool children receiving one or more out-of-schoolsuspensions.n Most public preschool children suspended are boys: While boysrepresent 54% of preschool enrollment, they represent 78% of preschoolchildren receiving one or more out-of-school suspensions.ED Initiative SpotlightReforming School Discipline Policy and PracticeThe Department has made school discipline reform a toppriority. In the 2016 Investing in Innovation (i3) Program,the Department seeks to support innovative alternatives tosuspension. This priority builds on the #RethinkDisciplinecampaign to increase awareness about the detrimental impacts of exclusionary discipline, our investment in SchoolClimate Transformation Grants to help states and districtsstrengthen behavioral supports for students, and a SchoolDiscipline Guidance Package to clarify schools' obligationnot to discriminate on the basis of race in discipline.For more information on the programs and initiatives appearing inthis document, please visit www.ed.gov.n Children with disabilities and English learners are notdisproportionately suspended in public preschool: Children with disabilities served by the Individuals with Disabilities Education Act (IDEA) represent 20% of preschool enrollment, but15% of preschool children receiving one or more out-of-school suspensions. English learners represent 12% of preschool enrollment, but 7% of preschool children receiving one or more out-of-schoolsuspensions.n Nationwide, 2.8 million K-12 students received one-or-more out of school suspensions: These include approximately 1.1 million black students; 610,000 Latino students; 700,000 students served by IDEA; and 210,000English learners.n Racial disparities in suspensions are also apparent in K-12 schools: While 6% of all K-12 students received one or more out-of-schoolsuspensions, the percentage is 18% for black boys; 10% for black girls; 5% for white boys; and 2% for white girls. Black K-12 students are 3.8 times as likely to receive one or more out-of-school suspensions as white students. Black girls are 8% of enrolled students, but 13% of students receiving one or more out-of-school suspensions. Girls of other races didnot disproportionately receive one or more out-of-school suspensions. American Indian or Alaska Native, Latino, Native Hawaiian or other Pacific Islander, and multiracial boys are also disproportionatelysuspended from school, representing 15% of K-12 students but 19% of K-12 students receiving one or more out-of-schoolsuspensions.†Note: Except where the percentage is below 1%, the percentages listed in these data highlights are rounded to the nearest whole number. Numbers inphrases such as “ times more likely” are rounded to nearest tenth (one decimal place). Black refers to persons who are black or African American; Latinorefers to persons who are Hispanic or Latino of any race; and multiracial refers to persons of two or more races. The numbers in these data highlights reflecta privacy protection protocol and other methodologies for collecting and preparing the data.1 For additional information on the methodology for collectingand preparing the data cited in this document, please visit ocrdata.ed.gov.U.S. Department of Education Office for Civil Rights ocrdata.ed.gov3
NEW RELEASE FOR 2016 11% of American Indian or Alaska Native boys received one or more out-of-school suspensions, as did 10% of multiracial boys, 8%of Native Hawaiian or other Pacific Islander boys, and 7% of Latino boys. Asian and white students did not disproportionately receive one or more out-of-school suspensions.n Students with disabilities in grades K-12 are disproportionatelysuspended from school: Students with disabilities served by IDEA (12%) are more than twice aslikely to receive one or more out-of-school suspensions as students withoutdisabilities (5%). More than one out of five American Indian or Alaska Native (23%), NativeHawaiian or other Pacific Islander (23%), black (25%), and multiracial (27%)boys with disabilities served by IDEA received one or more out-of-schoolsuspensions, compared to one out of ten white (10%) boys with disabilitiesserved by IDEA. More than one in five multiracial girls with disabilities served by IDEA(21%) received one or more out-of-school suspensions, compared to one intwenty white girls with disabilities served by IDEA (5%).n English learners are not disproportionately suspended from school: English learners make up 10% of all students, but they are 7% of those whoreceived one or more out-of-school suspensions.n Black students are expelled from school at disproportionately highrates: Black students are 1.9 times as likely to be expelled from school withouteducational services as white students.ED Initiative SpotlightIncreasing Equity for Students ofColor in Special EducationStudents of color are more likely to be identified as havinga disability and face harsher discipline than their whiteclassmates. To address these inequities, in February 2016,the Department proposed a new rule to improve equityin the Individuals with Disabilities Education Act (IDEA).IDEA requires states to identify districts with "significantdisproportionality" in special education—that is, whendistricts identify, place outside the regular classroom,or discipline children from any racial or ethnic group atmarkedly higher rates than their peers. The proposedEquity in IDEA rule would, for the first time, require statesto implement a standard approach to compare racial andethnic groups, with reasonable thresholds for determining when disparities have become significant, and wouldalso provide identified districts with new flexibility tosupport student needs. Black boys represent 8% of all students, but 19% of students expelledwithout educational services. Black girls are 8% of all students, but 9% of students expelled without educational services.n American Indian or Alaska Native, white, and multiracial boys are also disproportionately expelled from school withouteducational services: White boys represent 26% of all students, but 35% of students expelled without educational services. American Indian or Alaska Native boys represent 0.6% of all students, but 2% of students expelled without educational services. Multiracial boys represent 2% of all students, but 4% of students expelled without educational services.n Latino and Asian boys and girls, as well as Native Hawaiian or other Pacific Islander and white girls, are not disproportionatelyexpelled without educational services from schools. Latino students represent 25% of all students, but 15% of students expelled without educational services. Asian students represent 5% of all students, but 1% of students expelled without educational services. Native Hawaiian or other Pacific Islander girls represent 0.2% of all students, but 0.1% of students expelled without educationalservices. White girls represent 24% of all students, but 12% of students expelled without educational services.n Black students are more likely to be disciplined through law enforcement: Black students are 2.2 times as likely to receive a referralto law enforcement or be subject to a school-related arrest as white students.42013-2014 Civil Rights Data Collection A FIRST LOOK
NEW RELEASE FOR 2016n NEW A significant number of schools have sworn law enforcement officers (SLEOs), including school resource officers (SROs): 24% of elementary schools (grades K-6, excluding justice facilities) have SLEOs; 42% of high schools (grades 9-12, excluding justicefacilities) have SLEOs. 51% of high schools with high black and Latino student enrollment* have SLEOs.Restraint and Seclusionn More than 100,000 students were placed in seclusion or involuntary confinement or were physically restrained at school toimmobilize them or reduce their ability to move freely — including almost 69,000 students with disabilities served by IDEA: Students with disabilities served by IDEA represent 12% of all students,but 67% of students subject to restraint or seclusion.ED Initiative Spotlight American Indian or Alaska Native and multiracial boys represent 2% of allstudents, but 5% of students subject to restraint or seclusion. Black boys and white boys represent 8% and 26% of all students,respectively, but 18% and 43% of students subject to restraint orseclusion. Asian, Latino, and Native Hawaiian or other Pacific Islander boys are notdisproportionately subject to restraint or seclusion; neither are girls of anyrace or ethnicity.Early Learningn More than half of school districts provide public preschool programsbeyond providing those services required by federal law for childrenwith disabilities — but many children are still left without access to earlylearning:Supporting Early Learning EducatorsIn 2014, the U.S. Departments of Education and Healthand Human Services issued a Policy Statement on Expulsion and Suspension Practices in Early Childhood Settingsto assist states and public and private early childhoodprograms in preventing and severely limiting expulsionsand suspensions in early learning settings. In 2016,through the Departments’ Preschool Development GrantsProgram national activities funds, model sites will bedeveloped to implement strategies that improve social,emotional, and behavioral outcomes in preschoolers andsupport preschool teachers, administrators and familiesin addressing and reducing disproportionate disciplinepractices in early learning settings. By law, all school districts must provide special education and related services for preschool children with disabilities under theIndividuals with Disabilities Education Act (IDEA). In addition, 54% of all school districts report providing preschool programs tochildren not served by IDEA.n Among school districts that report offering preschool programs for children not served by IDEA, nearly half provide full-daypreschool: 48% of these school districts offer full-day preschool programs. 70% of these school districts offer part-day preschool programs.(Percentages above do not sum to 100% because districts can offer both full-day and part-day programs.)n Of the school districts that offer preschool programs for children not served by IDEA, 73% extend preschool eligibility to allchildren in the district (but do not necessarily provide preschool programs universally to every child): The remaining 27% of school districts extend preschool eligibility to children from low-income families or children in Title I schools,but not to all children.n NEW Most, but not all, public preschools are free: Of the school districts that provide preschool programs for children not served byIDEA, 86% offer part-day or full-day preschool at no cost; the remaining 14% require parents or guardians to pay for part or all of the costto enroll children in preschool.U.S. Department of Education Office for Civil Rights ocrdata.ed.gov5
NEW RELEASE FOR 2016College and Career Readinessn High-rigor course access is not a reality across all of our nation's schools: Nationwide, 48% of high schools offer calculus; 60% offerphysics; 72% offer chemistry; and 78% offer Algebra II.n Black and Latino students have less access to high-level math and science courses: 33% of high schools with high black and Latino student enrollment* offercalculus, compared to 56% of high schools with low black and Latinostudent enrollment. 48% of high schools with high black and Latino student enrollment*offer physics, compared to 67% of high schools with low black and Latinostudent enrollment. 65% of high schools with high black and Latino student enrollment* offerchemistry, compared to 78% of high schools with low black and Latinostudent enrollment. 71% of high schools with high black and Latino student enrollment* offerAlgebra II, compared to 84% of high schools with low black and Latinostudent enrollment.n Course enrollment rates differ by race/ethnicity, and by disability andEnglish learner status:ED Initiative SpotlightBoosting STEM and Computer Science EducationThe President has proposed a 4.1 billion ComputerScience for All program that would support states’ andschool district’s efforts to expand access for all studentsto computer science instruction and programs. And inApril 2016, the Department issued a Dear Colleagueletter to states, school districts, schools and educationpartners on how to maximize federal funds to support andenhance innovative science, technology, engineering andmath (STEM) education for all students and decrease theequity and opportunity gaps for historically underservedstudents in STEM. Black and Latino students are 38% of students in schools that offer AlgebraII and 37% of students enrolled in Algebra II; they are 36% of students inschools that offer calculus and 21% of students enrolled in calculus; and they are 37% of students in schools that offer physics and35% of students enrolled in physics. White students are 53% of students in schools that offer Algebra II and 53% of students enrolled in Algebra II; they are 55% ofstudents in schools that offer calculus and 61% of students enrolled in calculus; and they are 54% of students in schools that offerphysics and 53% of students enrolled in physics. Students with disabilities served by IDEA are 12% of students in schools that offer Algebra II and 6% of students enrolled in Algebra II;they are 11% of students in schools that offer calculus and 1% of students enrolled in calculus; and they are 11% of students in schoolsthat offer physics and 6% of students enrolled in physics. To close the participation gap in physics, more than 104,000 additional students with disabilities served by IDEA would need toparticipate in physics classes nationwide. English learners are 5% of students in schools that offer Algebra II and 4% of students enrolled in Algebra II; they are 5% of studentsin schools that offer calculus and 1% of students enrolled in calculus; and they are 5% of students in schools that offer physics and 4%of students enrolled in physics. To close the participation gap in physics, more than 16,000 additional English learners would need to participate in physics classesnationwide.n Girls are underrepresented among students enrolled in physics, but not in calculus: Girls represent 49% of all students nationwide and 49% of students enrolled in calculus, but 46% of students enrolled in physics. To close the participation gap in physics, more than 91,000 additional girls would need to participate in physics classesnationwide.62013-2014 Civil Rights Data Collection A FIRST LOOK
NEW RELEASE FOR 2016n Unequal access to accelerated courses or programs: Black and Latino students represent 42% of student enrollment in schoolsoffering gifted and talented education (GATE) programs, yet 28% of the students enrolled in GATE programs. White students are 49% of all students in schools offering GATE programs and 57% of students in GATE programs. While English learners are 11% of students in schools offering GATEprograms, fewer than 3% of GATE students nationwide are Englishlearners. Similarly, students with disabilities served by IDEA are 12% of all studentsin schools offering GATE programs, but represent fewer than 3% of GATEstudents nationwide.n Student enrollment in Advanced Placement (AP) courses is unequal: Black and Latino students represent 38% of students in schools that offerAP courses, but 29% of students enrolled in at least one AP course. English learners represent 5% of students in schools that offer AP courses,but 2% of the students enrolled in at least one AP course. Students with disabilities served by IDEA represent 11% of all students inschools that offer AP courses, but fewer than 2% of students enrolled in atleast one AP course.n English learners, students with disabilities, and students of color aremore likely to be retained or held back in high school: Students withdisabilities served by IDEA and English learners are 12% and 5% of highschool student enrollment , but 22% and 11% of high school students heldback or retained. Black students are 16% of high school students but 30% of high schoolstudents retained, while white students are 53% of high school studentsbut 31% of high school students retained. Latino, American Indian or Alaska Native, Native Hawaiian or otherPacific Islander, and multiracial high school students are also retained atdisproportionately high rates, representing 27% of high school studentsbut 35% of high school students retained.Chronic Student AbsenteeismUsing Data to Ensure Equity in theEvery Student Succeeds Act (ESSA)Under the new law, Congress required that states anddistricts include new information in their annual reportcards, including data about student discipline, schoolarrests, chronic absenteeism, preschool enrollment, accelerated coursework, and per pupil expenditures. Accessto this important data is a critical step forward in ensuringthat school communities are able to have meaningfulconversations about equity in their communities and mayhelp states and districts identify schools and students forsupports to improve student outcomes.ED Initiative SpotlightAddressing Chronic Absenteeism in SchoolsIn 2015, the Obama Administration launched EveryStudent, Every Day: A National Initiative to Address andEliminate Chronic Absenteeism to support coordinatedcommunity action that addresses the underlying causesof local chronic absenteeism affecting millions of childreneach year. A core component of the effort is the MBKSuccess Mentor Initiative — a partnership between the Department and key institutions to match chronically absentstudents with school-linked mentors in 30 communitiesto improve their school attendance and achievement.n NEW Nationwide, more than 6.8 million students – or 14% of allstudents – are chronically absent (absent 15 or more school days during the school year).n NEW More than 3 million high school students – or 19% of all high school students – are chronically absent. 20% or more of American Indian or Alaska Native (27%), Native Hawaiian or other Pacific Islander (25%), black (23%), multiracial(21%), and Latino (21%) high school students are chronically absent. High school students with disabilities served by IDEA are 1.4 times as likely to be chronically absent as high school students withoutdisabilities. 21% of all English learner high school students are chronically absent.*UPDATE (as of 10/28/16): The New York City Department of Education has acknowledged anomaliesin its chronic student absenteeism data that may affect the numbers reported in this document.U.S. Department of Education Office for Civil Rights ocrdata.ed.gov7
NEW RELEASE FOR 2016n NEW More than 3.8 million elementary school students – or 11% of all elementary school students – are chronically absent. American Indian or Alaska Native and Native Hawaiian or other Pacific Islander elementary school students are 1.9 times as likely to bechronically absent as white elementary school students. Black elementary school students are 1.4 times as likely to be chronically absent as white elementary school students. Elementary school students with disabilities served by IDEA are 1.5 times as likely to be chronically absent as elementary schoolstudents without disabilities.n NEW Chronic student absenteeism where the majority of teachers are also frequently absent: Native Hawaiian or other Pacific Islander students represent 0.4% of all students, but 2% of chronically absent students who attendschools where more than 50% of teachers were absent for more than 10 days. Black students represent 16% of all students, but 21% of chronically absent students who attend schools where more than 50% ofteachers were absent for more than 10 days.*UPDATE (as of 10/28/16): The New York City Department of Education has acknowledged anomalies in its chronic studentabsenteeism data that may affect the numbers reported in this document.Education in Justice FacilitiesThe 2013-14 CRDC collected, for the first time, the days and hours of educationalprograms – consisting of credit-granting courses and classroom instruction throughgrade 12 – at justice facilities. Justice facilities are short- and long-term publicor private facilities (including correctional facilities, detention centers, jails, andprisons) that confine (before or after adjudication or conviction) juveniles under 18years of age, adults who are 18 years of age and older, or both; however, the CRDCincluded data only from justice facilities confining individuals up to 21 years ofage.n NEW On average, justice facilities report offering 26 hours per week ofeducational programming during their regular school year. But more thanone in seven (15%) offers less than 20 hours per week during the school year– which is less than four hours each day in a five-day week.ED Initiative SpotlightPromoting Correctional Education and ReentryThe Department has prioritized access to education as atool and resource for incarcerated and formerly incarcerated individuals through Improved Reentry Education (IRE)and Promoting Reentry Success Through the Continuity ofEducational Opportunities (PRSCEO) grants, Reentry Education Toolkit, and Guidance on Correctional Educationin Juvenile Justice Facilities. And through the JuvenileJustice Reentry Education Program, the Departmentis helping schools provide robust Career and TechnicalEducation (CTE) and wraparound reentry supports forjuveniles involved in the justice system.n NEW While state requirements for public schools vary, the majority of statesrequire 180 days of school instruction. More than one in five justice facilities (21%) reports having fewer than 180 days in a regularschool year, and one in 20 (5%) reports having fewer than 170 days. By contrast, 24% of justice facilities report having more than 230days in a regular school year, reflecting the year-round nature of these facilities.82013-2014 Civil Rights Data Collection A FIRST LOOK
NEW RELEASE FOR 2016Teacher and Staffing Equityn Black, Latino, and American Indian or Alaska Native students are morelikely to attend schools with higher concentrations of inexperiencedteachers: 7% of black students, 6% of Latino students, and 6% of AmericanIndian or Alaska Native students attend schools where more than 20%of teachers are in their first year of teaching, compared to 3% of whitestudents and 3% of Asian students. 9% of teachers in schools with high black and Latino student enrollment*are in their first year of teaching, compared to 5% of teachers in schoolswith low black and Latino student enrollment.n Nearly 800,000 students are enrolled in schools where more than20% of teachers have not met all state certification or licensurerequirements: 3% of black students and 2% of Latino and American Indian or AlaskaNative students attend these schools, compared to 1% of white students.n While most teachers are rarely absent, 27% of teachers are absent morethan 10 school days per year for reasons unrelated to school activities: About
2013-2014 CIVIL RIGHTS DATA COLLECTION. The . 2013-14 Civil Rights Data Collection (CRDC) is a survey of all public schools and school districts in the United States. The CRDC measures student access to courses, programs, instructional and other staff, and resources — as well as school climate factors, such as