Transcription
SINGAPORE MEDICAL JOURNALNEAR VISUAL ACUITY TESTS USING CHINESECHARACTERS AND THE LOGMAR PRINCIPLEA W JohnstonSYNOPSISA new near visual acuity test chart using Chinese characters isdescribed. A typeface of a style commonly used for printing schooltextbooks or newspapers was selected, and characters are arrangedin a geometric progression of print sizes and spacings, such thatin each column characters and spacings are 1.26 times larger thanthose in the previous column.The geometric progression of character size is based on theLogMAR principle, and its use as a guide tothe determination of near vision needs,the prescription of spectacles (near magnification or dioptraladdition) and(3) the specification of a near viewing distance necessary for thepatient to resolve a given print size is described.(1)(2)INTRODUCTIONThe measurement of distance visual acuity is an essential elementtDepartment of OptometryUniversity of MelbourneParkville, Victoria 3052AustraliaA W Johnston, MAppSc, PhD, LOSc, FAAOSenior Lecturer448ofany eye examination, and usually tests for the threshold of recognitionof single alpha -numeric symbols (1-3). A patient is presented progressivelysmaller symbols until her or she can no longer recognize the detail ofthe symbol, and the 'threshold' acuity is graded according to the Snellenfraction, in which the numerator expresses the test distance in metresor feet and the denominator the size of the smallest symbol correctlyidentified. The denominator is scaled according to the standard distanceat which the detail or stroke width of that particular size of symbol subtendsan angle of one one minute of arcConvention holds that a visual acuity of 6/6 (20/20) is normal althoughyoung adult patients frequently manage to resolve detail smaller than 1'.Vision worse than 6/60 (20/200) often represents blindness' from amedico -legal or social welfare point of view, even though many activitiesof daily living can still be performed visually. Decimal equivalents ofSnellen acuity (1.0 6/6, 0.1 6/60) are used in Europe and China (4)but have the disadvantage of being converted to percentages and as suchcan be misleading if used to represent the percentage of vision remainingafter an eye disorder: e.g. 6/12 or 0.5 acuity does not represent a remainingvisual function of 50% (5).
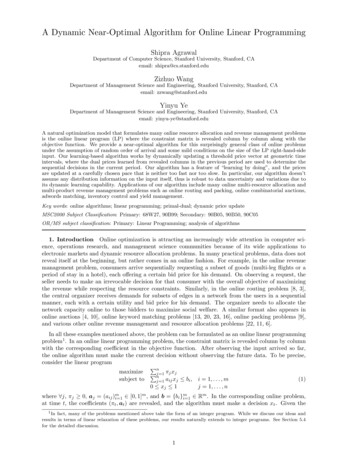
VOLUME 26, NO 6, OCT 1985Many variations in symbol design have been advocated overthe years: from the original Snellen letters Landolt C's havebeen considered for research purposes (6), and illiterate ortumbling E's have been used for children and patientsunfamiliar with a particular language (4). In many Englishspeaking countries British standard letters (7,8) or Sloannumerals and letters (6,9) are preferred. However, theprinciples behind these different symbol designs are basicallythe same. The use of checkerboard targets was advocated(10) in the 1940's but they have not been widely adoptedbecause of the difficulties in explaining the acuity task tonaive observers, the different nature of the task (patternresolution rather then recognition of detail) (1), and thepossibility of error from spurious resolution at someintermediate levels of defocus. More recently 'acuity' functionshave been addressed by the use of grating targets of varyingcontrast and spatial frequency and the plotting of the contrastsensitivity function (CSF) (11,12). This is the visual modulationtransfer function in which the high spatial frequency cutoffrepresents the CSF equivalent of Snellen acuity.An important advance in the technique of measuringvisual acuity was the use of minimum angle of resolution(MAR) as a unit of quantification and the expression of thisunit in a geometric progression of letter size (3,6,13,14). Bailey& Lovie (15) developed this idea and published a distanceacuity chart in which their British standard letters arearranged in a geometric or logarithmic progression. TheBailey-Lovie logMAR chart is now widely accepted in eyeclinics where careful specification of visual acuity isnecessary. The Bailey-Lovie design has been adapted to asecond chart using Sloan letters, (16) and recommended foruse as conforming to standards set by the committee onvision of the American National Academy of ScienceNational Research Council (17).In an important contribution published in this journal, theIogMAR method of scaling visual acuity has been used ina chart designed by Woo & Lo (18) using Chinese characters.This chart makes use of characters modified from theiroriginal Chinese format to have a 5 x 5 matrix, a standardstroke width of 1/5 character height, and a progression inthe number of strokes contained in each character from oneedge of the chart to the other. Woo & Lo's (18) charts makeuse of the logMAR progression of character size and spacing,and include additional contours to maintain 'contourinteraction' (19) effects on terminal characters in each columnor row as well as oncentrally-placed characters.-WHAT IS THE ADVANTAGE OF THE LOGMAR PRINCIPLE?A geometric progression of letter size recommended foruse on visual acuity charts (15,16) is given in Table 1. Thelogarithmic equivalents of the angular subtends of theseletters are given in column 5 of that table. For visual acuitiesworse than 6/60, some ophthalmic practitioners haveresorted to finger counting or hand movement criteria forrough quantification, in part because of the large andunmanageable letter sizes required for these patients.Columns 7 through 15 demonstrate how the test distancescan be altered systematically to enable the accurate scalingof visual acuity down to levels of vision much worse than 6/60.The great benefit of the IogMAR system is appreciatedespecially by ophthalmic practitioners who are consulted bylow vision patients, where the need to quantify vision inprecise terms cannot be met by the use of standard (6m or3m) viewing distances. Westheimer (3) in a separate reviewof the data of other researchers has determined theappropriateness of the IogMAR scale, and his work supportsour use of logMAR as a basis of optical prescription. suggestthat if vision can be improved optically by at least 2 logMAR'steps' or 0.2 log units of MAR at any level (say from 6/30to 6/21, or from 6/300 to 6/210), then that optical correctionis likely to be of practical benefit to a patient. Thus for theIfirst time, some precision in the specification of visual statusand the prescription of optical aids for distance is availableto the clinician. A more detailed explanation of the logMARsystem is given by Bailey & Lovie (15) and a sliding scalecalculator to convert an acuity for any standard viewingdistance into conventional (6m) Snellen acuity has beenpublished by Johnston (20).MEASUREMENT OF VISUAL ACUITY AT NEARAlthough not demonstrated in their paper, Woo & Lo (18)described a set of their visual acuity charts reduced in sizeand designed for use at the reading distance. Because ofthe use ofthe nature of the reading task in Chineseit is likely that bothcomplete, single ideosyllabic characterstheir distance and near charts should give comparable resultsfor MAR provided that a proper adjustment is made forchanges in viewing distance, near refractive error, charactersize and angular subtense.A similarity between distance and near visual acuities isnot always apparent for alphabetic languages. Typically,distance visual acuity is determined using single upper-casecapital letters while extended text of short, medium or longwords in more closely spaced lower-case letters is used todetermine near visual acuity (21-23). For some eye disordersthis presents a discrepancy, for example, where retinitispigmentosa or hemianopsia patients may have a relativelysmall distance acuity impairment (single letter tests) but alarger impairment when near acuity is measured withextended text (words).Both Sloan & Brown (21) and Sloan & Habel (22)emphasised the need to test the facility of a patient's nearvision on fluent text or meaningful prose, as well as on thedisconnected words of most near acuity charts. Bailey & Lovie(23) stressed that a patient's reading skills should be testedon the material likely to be encountered in the course ofbusiness, recreational or social activities. If a patient has beendenied reading for any time, as a result of impairment of visionor inadequate optical correction, some practice may benecessary to re-establish reading skills. At consultationswhere optical aids on loan to low vision patients are reviewed,improvement in reading can be revealed that is not predictedby reading performance measured at initial consultation.Cards for the measurement of near visual acuity usingcontinuous alphabetic test have been described by Sloan& Habel (22) and Sloan (24). These reading cards are gradedin M units, where the x or loop height of a 1 M lower caseletter subtends an angle of 5 minutes of arc (5') at a 1 metreviewing distance, or equal to the anle subtended by a 6 mstandard letter at a viewing distance at 6 m. Nine cards makeup the adult series, having print of 1, 1.5, 2, 2.5, 3, 4, 5, 7and 10M, and another series is available for children orunskilled adult readers. 1 M print corresponds closely to 8point Times Roman print or N8, and is of a size commonlyfound in newsprint. If a patient can read 1 M print (N8 print)at a normal viewing distance of 40 cm, no special readingaddition other than that required to correct for presbyopia maybe necessary. If a patient can read only 4 M print at 40 cm,then at least 4x magnification will be required to enable1M print to be read. This magnification can be obtained eitherby the prescription of a near telescope, or a change in viewingdistance to 10cm and an appropriate increase in near dioptraladdition.--Bailey & Lovie (23) have published a set of IogMARreading cards each containing seventeen print sizes (fromN2 to N80) graded according to the geometric progressionrecommended by Green (13). Their charts make use ofunrelated 10, 7 and 4 -letter words having no contextualmeaning to influence the guessing of adjacent words founddifficult to recognize (Figure 1). In particular they have449
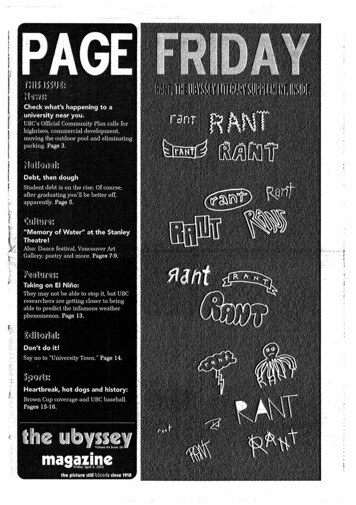
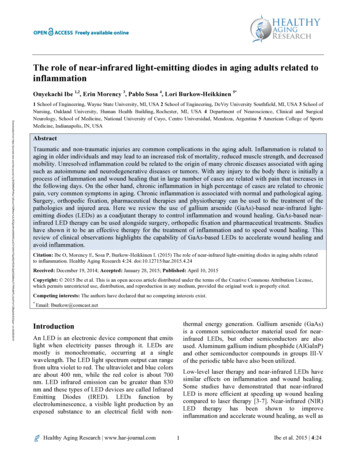
SINGAPORE MEDICAL JOURNALD, fceei afd a aaSeaeP0e 4.e,"coweFtPól d.:eFeeeir3?ecçá?c3 mgqSod'Ds .a3f 5.e 9y c Fo é,çeeecJcdistance of 0.25m (25cm)e .eaoosa-.7a4Qa e'; FFSeNon standard viewingme gJuap c444/Non standard viewingdistance of 0.95m (95cm)óÓ4ro 974.T 4'SPJoet?".ebeto.áe,oez a,ó. çácg Fk0P FNon standard viewingdistance of 2.4 mTable1 Relationship between letter size, stroke width,angular subtense (minimum angle of resolution MAR) andIogMAR for standard (6m) and nonstandard visual acuity test distances."Columns1 through 6 give equivalent scalingdimensions for a 6 m standard viewing distance, letter size, angular subtense,IogMAR and conventional Snellen acuity. Columns 7 through 9 show how the use of a non standard (2.4m) viewing distancealters the logMAR visual acuity by 4 'steps upwards: i.e. logMAR 1.0 is represented by 2.4/24 (6/60),IogMAR 1.4 by 2.4/60(6/150) etc. Columns 10 through 12 represent similar adjustments for a non standard viewing distance of 0.95m (95cm) andColumns 13 through 15 represent figures for a non standard viewing distance of 0.24m (or 25 cm). In this way the low levelsof visual acuity represented by large angular subtends can be measured by letters of moremanageable size at a closerviewing distance, without changing the geometric progression of letter size or the nature of the task.450
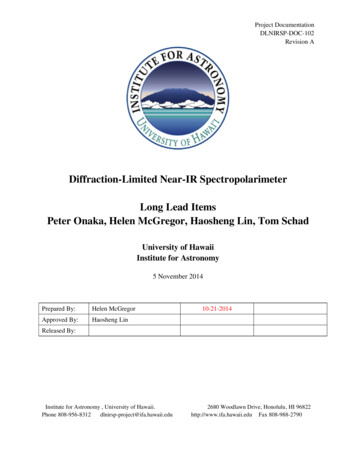
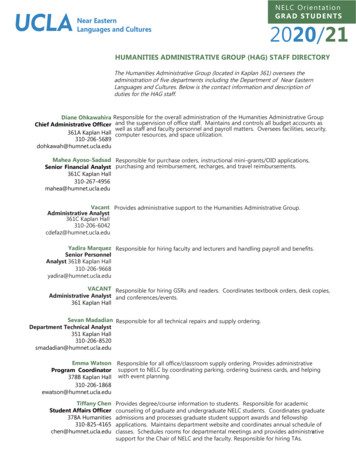
1.,.3.2;1 .0:'stepsfrom 2.5D tocmFF4Increments in: -relativeM26. . ,parameter,,'to be.parameter go beF/2 5M40magnification 'consider.Increments iiï :relativemagtii.fication-- consider;7distahce'in:Decrementsof :riear vlewiïïgdistance --ëonsider Èiparameter to be viewing:improvement requiredcönsider parameterto be point size.712D: 10'12;'steps' fromN32 Lo16,:328cm, b. be404864.,.71.0Xtfto.Ft808dioptres of ,5ÿ;optical;.,power.,páraneter ,toto24'Inerements of near::dioptral.additioñ - consider40cmN6.3 .207%'steps' from 0.63x. to 3.2x*7'5tepse from'4.8 6.3 8.0.This figure demonstrates the schematic method by which the inter -relationships between near vision parameters can be altered systematically.acuityConsider a low vision patient whose near visual acuity is measured to be n 32 at 40 cm. From Table 2 this represents LogMAR resaacuityof 1.0, equivalent to a IgMAR distance acuity of 1.0 or 6/60 (20/200).or 7 'steps of geometric progression) then systematic changes in near viewing distance, near dioptral addition, and relative magnificationare required as illustrated.a2, extrapolation by a factor of 10 mayBecause the increment 6.332 is the same in logarithmic terms as 0.63highlowendsoftheprogressionin Columnrunsoutattheorbe necessary when the sequence of numbersFigure2.4Increments of 'acuityz.aGeometric progres
a chart designed by Woo & Lo (18) using Chinese characters. This chart makes use of characters modified from their . (6m) Snellen acuity has been published by Johnston (20). MEASUREMENT OF VISUAL ACUITY AT NEAR Although not demonstrated in their paper, Woo & Lo (18) described a set of their visual acuity charts reduced in size and designed for use at the reading distance. Because of the .