Transcription
MONITORINGSHORELINECHANGEWestern Indian OceanJ. Mar. Sci.Vol. 3, No.1, pp. WITH1–10, REMOTE2004 SENSING AND GIS1 2004 WIOMSAMonitoring Shoreline Change using Remote Sensing andGIS: A Case Study of Kunduchi Area, TanzaniaVedast Makota1, Rose Sallema1 and Charles Mahika2,Environment Management Council, P.O. Box, 63154, Dar es Salaam, Tanzania;2Tanzania Fisheries Research Institute (TAFIRI), P.O. Box 9750, Dar-es-salaam, Tanzania1NationalKey words: remote sensing, geographic information system (GIS), aerial photographs, shorelinechangeAbstract—Data from aerial photographs taken in 1981, 1992 and 2002 of the Kunduchi shorelineoff the Dar es Salaam coast were integrated in a geographic information system (GIS) todetermine shoreline change in that locality. It was found that considerable changes have takenplace, and that the two techniques are effective for shoreline monitoring.INTRODUCTIONShoreline change is an issue of concern in coastalmanagement. In Tanzania, coastal communitiestotalling about 8 million depend on coastalecosystems (TCMP, 1997) for their livelihood.However, the coastal zone is increasingly underpressure from human activities such as fishing,coral and sand mining, mangrove harvesting,seaweed farming, sewage disposal, urban expansionand tourism. Of particular note are dynamitefishing, over-harvesting of mangroves, coral andsand mining, all of which have profound negativeimpacts on coastal stability and are thought to leadto coastal erosion and shoreline change (Griffiths,1988).The focus of the present study was theKunduchi area, north of Dar es Salaam harbour(Fig. 1). A number of studies conducted since the1970s provide a detailed account of existing naturalresources in the area (Okera ,1971; Mwaiseje,1973; Hartnoll, 1975; Bryceson, 1977; Banyikwa& Semesi, 1986; Persons, 1988; Semesi & Shushu,1988; Benno, 1992). The most important of theseare planktonic organisms, coral reefs, mangroves,fisheries, intertidal zones and seagrass beds. OtherCorresponding Author: VM.E-mail: makota65@yahoo.comstudies have documented evidence of coastalerosion and associated shoreline changes in theKunduchi area (Griffiths & Lwiza, 1988; Fay,1988). Coastal erosion is evidenced by collapsedtrees, buildings, and other structures, includinggroynes (Griffiths & Lwiza, 1988; Fay, 1988).Sand pile-ups from the area have been washedaway by monsoon tides at a depth ranging from20 to 90 cm, resulting in a shoreline retreat of 10m landward from the end of constructed groynesin places like Bahari beach (Griffiths & Lwiza,1988). A widening of Mbezi river mouth from 1967to 1987 and erosion of the sandy beach at the baseof Ras Kiromoni cliff have also been recorded(Griffiths & Lwiza, 1988; Fay, 1988). Theforegoing studies indicate that the coastal area ofKunduchi is a dynamic one.Remote sensing data can be used inenvironmental monitoring programmes where theobjective is to monitor changes in surfacephenomena over time (Howarth, 1981). Digitalspatial data analysis and mapping; remote sensingand geographic information systems (GIS) arewidely applied in environmental and naturalresources monitoring (Lillesand, 1994; Jensen2000). Among the studies that have attempted to
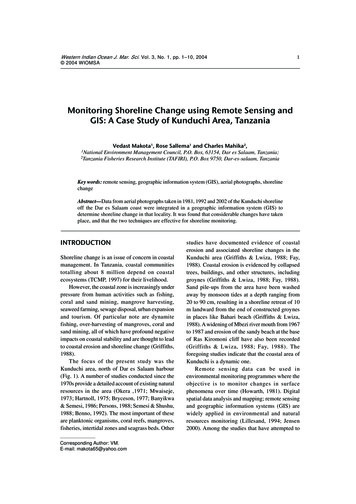
V. MAKOTA ET AL.NoyoStudy areaTo Baga m2TANZANIAAKunduchiKEYNorthern Kunduchi—ManyemaCreekBSouthern Kunduchi—ManyemaCreekCOther parts of Kunduchi shoresStudy areaCTo Cit y centreAIndian OceanBMain roadCoastline100001000 metresUrban wardFig. 1. Location of study area off the Dar es Salaam coastquantify the extent of shoreline change inKunduchi area, the one of Mushala (1978) isespecially valuable. Using aerial photographs itwas found that there had been a drastic change ofvegetation cover, and a shoreline recession of morethan 50 metres in front of both Silversands andKunduchi Beach hotels during the last 30 years.The objective of the study reported here wasto determine from aerial photographs taken in1984, 1992 and 2002, the quantitative extent ofshoreline change in the Kunduchi area.Study areaThe study area, Kunduchi beach, is situated within6º 39–6º 41’ S and 39º 12–39º 13’ E, approximately18 km north of Dar es Salaam harbour inKinondoni district. The area is flat and heavilyconstructed with hotels and residential buildings.The study area covered the shoreline stretch fromWhite Sands Hotel to Bahari Beach Hotel.The geology of the area falls under fivedifferent types of sedimentary deposits (Griffiths& Lwiza, 1988), which are grouped into two majorsedimentary units: older consolidated rocks andyounger contemporaneous unconsolidatedsediments (Muzuka & Shaghude 2000, Kairu &Nyandwi, 2000). The former are predominantlynon-marine sediments of Neogene age, while thelatter consist of Mio-Pliocene sediments overlainby Pleistocene-Holocene sediments. The MioPliocene sediments consist of poorly sortedgravels, sands, silt and clays and the PleistoceneHolocene sediments consist of raised reeflimestones, beach ridges, sand dunes, beachdeposits and superficial white-buff sands.The Kunduchi area is growing fast, and thegrowth rate is attributed to its potential for severaleconomic activities, the existing pressure of urbanexpansion, and tourism. The physical infrastructure existing near the coastline includes touristhotels as well as training and research institutions.Important socioeconomic activities which sustainthe livelihood of the local communities includefishing, farming, stone quarrying, sand mining andmangrove harvest.MATERIALS AND METHODSQuantification of the extent of shoreline changesin the Kunduchi area was accomplished usingaerial photographs from 1981, 1990 and 2002.
MONITORING SHORELINE CHANGE WITH REMOTE SENSING AND GIS3Aerial photographs scanning andgeo-referencingVisual interpretation and on-screenDigitisationAerial photographs from 1981 and 1990 werescanned at 500 dpi using a HP ScanJet 3300Cscanner. The resulting scanned photographs weresaved in Tagged Image File Format (TIFF) beforegeo-referencing. The aerial photographs from2002, which were obtained from the NationalBureau of Statistics, captured by the GeoSpaceInternational (PTY) Limited were already in digitalformat. According to Lugoe (2003) the imageswere taken with a (calibrated) digital camera wherethe image was controlled by PC software that labelsthe images with GPS coordinates. Scanned aerialphotographs were then geo-referenced using thedigital aerial photo mosaic of 2002. The mosaicimage processing software then semiautomatically, rectifies hundreds of images at atime, applying bundle block adjustment, and joinsthem into a large geo-referenced and orthorectifiedmosaic. The digital data facilitates flexible printingof mosaic maps at any scale (up to 1: 2000) orimporting the data into a geographic informationsystem (GIS) for further processing.The software ERDAS Imagine 8.5 was usedto geo-reference the two sets of scanned photos(1981 and 1992). To accomplish the transformationfrom latitude and longitude coordinates on thescanned photographs to X and Y coordinates on amap, a suitable map projection has to beestablished. In the present study, the UniversalTransverse Mercator (UTM) projection (UTMzone 37) was used, along with the World GeodeticSystem 1984 (WGS 1984) datum. The processesinvolved selecting points from the 2000 image andthen identifying corresponding locations of the samepoints in the 1990 aerial photographs. The pointswere selected from permanent marks such as roadintersections and buildings, which could beidentified from both images/photographs. Thisprocess was repeated to about 10 to 12 differentidentifiable points from both 2002 and 1990 aerialphotographs. The same process was used to georeference scanned aerial photographs of 1981. Sincethe ground resolution (pixel size) for the digitalmosaic is 0.25–5 m and the geometrical accuracyis 2–5 m without control points (Lugoe, 2003), theerror during georeferencing was smaller than 5 m.In order to obtain detailed information of the studyarea, the area was divided into two parts: north ofthe Kunduchi–Manyema creek and south of theKunduchi–Manyema creek. The digital aerialphotograph files, starting with the 1981 one, weredisplayed as background in ArcView 3.1 software.The shoreline was therefore identified and digitisedon the screen along the high water mark.In the case of Kunduchi–Manyema creek,digitisation did not follow the high water marklevel since the interest was to determine areas ofchange based on the intersection of the two vectorline themes of different years. Digitisation of theshoreline was carried out on all aerial photographdigital datasets used in the study. As a result ofdigitisation, all linear vector themes of theshoreline within the study area were captured.Change detection at Kunduchi–Manyema creekWhen the two linear vector themes of differentyears were overlaid in ArcView 3.1 software, thelines intersected in some areas and formedpolygons. The two overlaid line themes weremerged in ArcView using GeoProcessing Wizard .Since ArcView 3.1 does not have a cleaningcommand, the shapefiles were converted intocoverages using ArcTool in ArcGIS software.Thereafter all coverages were cleaned usingArcTool . After cleaning the coverages, themerged coverages formed polygons and their areaswere computed automatically.Shoreline change detection in otherparts of Kunduchi shoresApart from the Kunduchi–Manyema creek,shoreline change in other Kunduchi shore areaswere determined on a linear basis. The linesrepresenting shoreline marks of two different yearswere digitised and overlaid in ArcView 3.1. A newline theme was created and four lines were digitisedperpendicular to the shoreline in selected areasbetween the two overlaid lines of the shoreline forthe two years (see Fig. 4). The lengths of these
4V. MAKOTA ET AL.lines, which determine shoreline changes/recession,were calculated in ArcView. Shoreline changeresults are provided in the form of photomaps.Ground truthingGround truthing on the entire study area wasconducted for two days. The aim was to collectmore data and information from the field andinterview the people from the study area. Thepeople interviewed were asked about the status ofthe shoreline in relation to previous years. Theirresponses agreed well with our GIS analyticalfindings. A number of photographs were also takenof the study site using a digital camera in order tocapture the area’s current appearance. Thephotographs show some vivid examples ofshoreline erosion from the ruins of buildings thathad collapsed due to shoreline erosion, includingAfricana Hotel.stone structure constructed in order to controlshoreline erosion at the Kunduchi Beach Hotel.This stone structure was built after groynes failedto control shoreline erosion. The groynes can beclearly seen in the photomap that shows changesbetween 1981 and 1992.1981–2002About 2.62 ha of land were eroded from thenorthern part of the creek between 1981 and 2002(Fig. 2). The green line on the photomap representsthe shoreline in 1981 whereas the red linerepresents the position of the shoreline in 2002.The area between the two lines, labelled “A” onthe photomap, represents the eroded area. Fromthis photomap the current shoreline (2002) is veryclose to the Kunduchi Beach Hotel.Southern Kunduchi–Manyema creek1981–1992RESULTSNorthern Kunduchi–Manyema creek1981–1992The analysis on the shoreline change between 1981and 1992 is shown in Fig. 2. About 2.02 ha of landwere eroded from the shore in the northern partof the creek. The green line in the photomaprepresents the shoreline in 1981 whereas the blueline represents the position of the shoreline in1992. Between the two lines, labelled “B” in Fig.2, is the eroded area, which measures 2.04 ha.However, there had been an accretion of about0.11 ha at the same time in the area denoted by ablue letter “A”.1992–2002Figure 2 also shows the shoreline change between1992 and 2002. About 0.68 ha of land was erodedfrom the shore in the northern part of the creek. Ablue line in the photomap represents the shorelinein the 1992 whereas the red line represents theposition of the shoreline in the 2002. An area inbetween the two lines, labelled “C”, represents theeroded area. The area labelled “B” shows an areaof gain (accretion). However, this is not anaccretion from natural processes, but is a man-madeBetween 1981 and 1992 about 1.13 ha of land,labelled “C” in red, were eroded from the shore inthe southern part of the creek. The green line in thephotomap (Fig. 3) represents the shoreline in the1981 whereas the blue line represents the positionof the shoreline in 1992. There was an accretion ofabout 0.04 ha, labelled with a blue “B”, in thesouthern part of the creek over the same period.1992–2002There were considerable shoreline changes in thisarea from 1992 to 2002. There was less shorelineerosion (only 0.12 ha) in areas denoted “D” in redon the photomap shown in Fig. 3. However, therewas more accretion during this period, whichformed a continuous piece of land with an area of2.81 ha protruding northwards, which is labelledwith a blue “C”. During ground truthing weobserved vegetation such as bushes and someexotic trees species of more that 10 metres inheight within this area.1981–2002During 1981–2002 about 0.61 ha of land waseroded from the area labelled with a red “A” inthe photomap in Fig. 3. There was more accretionof about 2.21 ha in the area labelled with a blue“A”. Also, about 0.40 ha of mangrove was erodedin areas denoted with a red “B”.
Fig. 2. Shoreline change from 1981 to 2002 in the northern part of Kunduchi–Manyema creekMONITORING SHORELINE CHANGE WITH REMOTE SENSING AND GIS5
Fig. 3. Shoreline change from 1981 to 2002 in the southern part of Kunduchi–Manyema creek6V. MAKOTA ET AL.
MONITORING SHORELINE CHANGE WITH REMOTE SENSING AND GISOther parts of KunduchiFigure 4 shows the shoreline changes between1981 and 2002 at the former site of the AfricanaHotel to the south of Whitesands Hotel. The blue7and red lines represent the shoreline (highest watermark) in 1981 and 2002 respectively. The shorelinein 2002 is shown in red in the upper part of thephotomap but it has not been extended to thesouthern part, from point “A” southwards, whereFig. 4. Shoreline changes in other parts of Kunduchi shores between 1981 and 2002
8V. MAKOTA ET AL.land reclamation efforts can be seen in front of mostbeach hotels, as curved shapes on the shoreline.Letters A, B, C and D in Fig. 4 represent areaswhere measurements for shoreline change weretaken. At point “A”, near Beachcomber Hotel, theshoreline erosion that took place caused a recessionof about 52 m. At point “B”, we decided to measurethe distance from the shoreline to a point at a roadgoing to the former Africana hotel. It was foundthat in 1981 the shoreline was about 78 m fromthis point at the road. However, in 2002 theshoreline was 36 m from the same point. Thus, in21 years the shoreline has shifted by 42 m. At point“C” the shoreline changed by 29 m and at point“D” by 40 m.River mouth changes at Kunduchi–Manyema creekPoints “A” and “B” have been positioned in areaswhich used to be the nearest (end points) in thenorthern and southern parts of the river mouthrespectively. The distance between points “A” and“B” in Photo 1, Fig. 5 was about 79 m in 1981.The original positions of these points as they werein 1981 are displayed in the photomaps of 1992and 2002. The distance between points “C” and“D” also shows the width of the nearest pointsbetween the northern and southern points of theriver mouth in 1992, which was about 325 m.DISCUSSION AND CONCLUSIONThe present study used remote sensing data andGIS to quantify shoreline change in Kunduchi area.It has been observed that shoreline change in thestudy area results from both erosional andaccretional processes. The study has revealed thatduring 1981– 2002, more erosion took place in thenorthern part of the creek while deposition tookplace in the southern part.Between 1981 and 1992, about 2.04 ha wereeroded from the northern part of Kunduchi–Manyema creek. This area increased to more than2.60 ha by 2002. Some of the buildings hadcollapsed near Kunduchi Beach Hotel, especiallyin areas close to the fish market, causing damageand loss to property and investments.Previous efforts at controlling coastal erosionthrough the construction of groynes do not seemto have been effective. Some of the groynes havebeen washed away and others stand far from thecurrent shoreline, showing that erosion is stilltaking place. As a mitigative measure, KunduchiBeach Hotel has recently constructed stonestructures.Despite the general observation that erosion issignificant in the north and deposition in the south,the present study found that there are some partssouth of the Kunduchi – Manyema creek that havebeen significantly been affected by erosion. Inaddition to collapsed properties, shoreline erosionremoved the mangroves on the southwestern side,especially between 1981 and 1992. About 0.4 haof mangroves was washed away along the riversidenear the river mouth. The people interviewed alsomentioned the mangrove removal in this area.From the aerial photographs it appears thatserious shoreline erosion at the river mouthoccurred between 1981 and 1992. From the 1992aerial photograph, the river mouth widened toabout 325 m from its previous width of 79 m at itsnarrowest point, between “A” and “B” in aerialphotograph of 1981. Although there was accretionat that time, it has been difficult to determine theextent of these depositional features from theblack-and-white aerial photographs used in thisstudy. There is almost no contrast between the toneof beach and sand deposits. Nevertheless, it hasbeen possible to determine shoreline erosion basedon the pattern and texture of the land/water areasin relation to the river passage. The fishermeninterviewed also helped to identify the featuresfrom the aerial photographs during fieldwork.Accretion is taking place in the southern partof the creek. As a result, this part of the creekprotruded northwards from the former site of theAfricana Hotel forming a piece of land of about2.81 ha between 1992 and 2002. According tomeasurements using GPS, an area of about 2.24ha from this land is covered with vegetation, suchas trees and bushes. In fact, there is more vegetationthan was present in 1981. It appears that the soilcharacteristics have changed and this parcel of landhas stabilised, but further monitoring isrecommended.Continued monitoring of shoreline changes isimportant to our understanding of the changestaking place at the Kunduchi–Manyema creek and
9Fig. 5. River Mouth Changes at Kunduchi–Manyema creekMONITORING SHORELINE CHANGE WITH REMOTE SENSING AND GISthe Kunduchi shores in general. Furthermore,studies that link land use patterns, hydrologicaldata, human activities and other processes takingplace in the coastal and marine areas arerecommended. The results of this study should beintegrated with other datasets in a GIS in order tomonitor changes in the future. It is also importantthat these results be shared with relevantstakeholders, including coastal managers, investors(particularly hotel owners), the public, policymakers, researchers and other scientists, for usein decision-making on such issues as land useplanning, development of set-back lines andidentification of low-cost methods which couldbe used in the context of integrated coastal areamanagement. It is concluded that remote sensingand GIS are useful tools for monitoring the coastalenvironment and resources in Tanzania.
10V. MAKOTA ET AL.Acknowledgement—We appreciate the assistanceprovided by the Tanzania Coastal ManagementPartnership (TCMP) in terms of facilities, logisticalarrangements and also financial support during thestudy.REFERENCESBanyikwa, F.F. & Semesi A.K. (1986) Endangeredmangrove ecosystems—the case of Kunduchi andMbweni mangrove forests. In: Mainoya, J.R. &Siegel P.R. (Eds.), Status and utilization ofmangroves. Proceedings of a Workshop with thetheme Save the Mangrove Ecosytsem of Tanzania,21–22 February 1986. Dar es Salaam. Faculty ofScience, University of Dar es Salaam. pp.103–132.Benno, B.L. (1992) Some features of beach seinefishery along the Dar es Salaam coast, Tanzania.MSc thesis, University of Kuopio, Finland. 68 pp.Bryceson, I. (1977) An ecological study of thephytoplankton of the coastal waters of Dar esSalaam. PhD Thesis. University of Dar es Salaam.Fay, M. (1988) Ancient backshore sediments betweenBahari beach and Mbezi beach. In: Beach ErosionAlong Kunduchi Beach, North of Dar es Salaam.A Report for NEMC by Beach Erosion MonitoringCommittee, 55 pp.Griffiths, C.J. (1988) The impact of sand extractionfrom seasonalstreams on erosion of Kunduchibeach. In: Beach erosion along Kunduchi beach,north of Dar es Salaam. A Report for NEMC byBeach Erosion Monitoring Committee. 55 pp.Griffiths, C.J. & Lwiza, K.M. (1988) Physicalbackground of the study area. In: Beach erosionalong Kunduchi beach, north of Dar es Salaam. AReport for NEMC by Beach Erosion MonitoringCommittee. 55 pp.Hartnoll, R.G. (1975) The ecology of some rocky shoresin tropical East Africa. Estuar. Coast. Sci. 4: 1–21.Howarth, P.J. & Wickware, G.M. (1981) Proceduresfor change detection using Landsat digital data. Int.J. Remote Sensing 2: 277–291.Jensen, J. R. (2000) Remote sensing of the environment:An earth resource perspective. Prentice Hall.Kairu K. & Nyandwi N. (eds.), (2000) Guidelines forthe study of shoreline change in the Western IndianOcean region. Manual and Guides.Intergovernmental Oceanographic Commission,UNESCO.Lillesand, T. M. & Kiefer, R. W. (1994) Remotesensing and image interpretation, 3rd ed. JohnWiley & Sons.Linden, O & C. Gustof, (1995) (ed.) Coastal ZoneManagement in Tanzania. Proceedings of theNational Workshop on Integrated Coastal ZoneManagement in Tanzania. The World Bank: Land,Water, and Natural Habitats Division. May, 8–12.Lugoe F.N. (2003) NSDI— A look at the spatialdimension in Tanzania: Unpublished report.Mushala, H. M. (1978) Coastal processes alongKunduchi Beach. In: Dubi A. 2000 (Ed). CoastalErosion. Tanzania Coastal ManagementProgramme. Dar es Salaam.Muzuka, A.N.N. & Shaghude, Y.W. (2000) Grain sizedistribution along Msasani beach north of Dar esSalaam harbour. J. Afri. Earth Sci. 30: 417–426.Mwaiseje, B. (1973) Some aspects of the ecology ofsandy/muddy intertidal zone in Dar es Salaamarea. MSc thesis. University of Dar es Salaam.103 pp.Okera, W. (1971) Plankton analysis relative to thefeeding habits of Sardinella in Dar es Salaamwaters. PhD thesis, University of Dar es Salaam.212 pp.Persons, M.P. (1988) Coral reef resources in the Dares Salaam area. In: Investigations Related to theProtection and Conservation of Coastal MarineResources in Dar es Salaam Area. NEMC/UDSM/IMS/TAFIRI/Fisheries Division. pp. 12–35.Semesi, A.K. & Shushu, D. (1988) A survey ofseagrasses and seaweeds along the Dar es Salaamcoast. In: Investigations Related to the Protectionand Conservation of Coastal Marine Resources inDar es Salaam Area. NEMC/UDSM/IMS/TAFIRI/Fisheries Division. 36–62.TCMP (1977) An overview towards intergrated coastalmanagement. Tanzania Coastal ManagementPartnership brochure.
Figure 2 also shows the shoreline change between 1992 and 2002. About 0.68 ha of land was eroded from the shore in the northern part of the creek. A blue line in the photomap represents the shoreline in the 1992 whereas the red line represents the position of the shoreline in the 2002. An area in between the two lines, labelled "C .