Transcription
Enrollment Projections2020-2029Maryland Public Colleges and UniversitiesJune 2020Lawrence J. Hogan, Jr.GovernorBoyd K. RutherfordLt. GovernorMARYLAND HIGHER EDUCATION COMMISSION6 North Liberty Street 10th Floor Baltimore, MD 21201www.mhec.maryland.gov
Maryland Higher Education CommissionIan D. MacFarlane, ChairSenchal D. Barrolle, Esq.Vivian S. Boyd, Ph.D.James E. ColemanAnwer J. HasanVera R. Jackson, Ph.D.Charles McDaniels, Jr.Donna M. MitchellJames B. Sellinger, Sr.Mary Pat Seurkamp, Ph.D.Jordan T. Troutman, Student CommissionerJohn W. Yaeger, Ed.D.James D. Fielder, Jr., Ph.D.Secretary
ENROLLMENT PROJECTIONS - MARYLAND PUBLIC COLLEGES AND UNIVERSITIESThe Maryland Higher Education Commission has prepared enrollment projections for Maryland public colleges and universities through Fall2029. The projections include headcount projections for each institution, with separate analyses for full- and part-time undergraduates and, asapplicable, full- and part-time graduate/professional students. Full-time equivalent (FTE) and full-time day equivalent (FTDE) projections werecalculated by applying a mathematical formula to the headcount figures. Projections have also been developed for state-funding-eligible FTEnoncredit continuing education enrollments at the community colleges.These projections provide perspective to higher education policy discussions at the state level, including facilities planning, tuition and fees issues,articulation, funding priorities, and retention and graduation rates. The Department of Budget and Management and the General Assembly use theCommission’s forecasts as the State’s official enrollment projections.The Commission used separate but similar methodologies for projecting credit enrollments at the community colleges and public four-yearinstitutions. A third method was applied to produce the projections of noncredit continuing education enrollments at the community colleges. Allthree models involve the application of a linear regression analysis to demographic and economic factors.These projections do not incorporate any data tied to COIVID-19 and the resulting disruptions the pandemic has caused colleges in relation toenrollment of new and returning students. The data used were collected between December 2019 and February 2020 and reflect projected andactual data that, similarly, would not incorporate the effects of COVID-19.Assessing the one-year accuracy of the model reveals several overestimation patterns. Last year, the enrollment projections forecast a Fall 2019credit enrollment at the community colleges of 115,275 and the actual enrollment in Fall 2019 was 113,288, a difference of 1,987 (or 2%). Inaddition, the projections estimated that the credit enrollment at the public four-year institutions in Fall 2019 would be 189,962 and the actualenrollment in Fall 2019 was 181,490, a difference of 8472 or 5%. Similarly, last year’s statewide FTE and FTDE figures forecast projections thatwere approximately 3% higher than the actual data.Assessing the projections 10-year accuracy is more complex. An analysis using the projections from the 2010-2019 Enrollment ProjectionsReport (published in 2010) projected 357,615 in total headcount credit enrollment, which is 62,837 (17.5%) higher than the actual data forFall 2019. The primary driver of these differences is an overestimation of the community college enrollment (170,178 estimated versus113,288 actual). The public four-year projections (187,437 estimated versus 181,490 actual) was much more accurate. Similar patterns playout for the FTE and FTDE figures, with the 2010 report greatly over-projecting the community college counts and much more accuratelyprojecting the public-four year FTE and FTDE counts. Likely the overestimation of the community college data was due, in part, by the surgeof enrollment at the community colleges, which began in 2008 and peaked in 2011.Barbara Schmertz, Ph.D.Principal Author1Emily A.A. Dow, Ph.DAssistant Secretary of Academic Affairs
Assumptions of the Projection Models Credit enrollments among Maryland residents can be predicted by applying the historical relationship between the state’spopulation and past in-state enrollments to future population projections. The ratio of in-state to out-of-state students in Maryland will be relatively constant over time. The number of full-time undergraduates at both the community colleges and public four-year campuses will be affected bythe trends in high school graduates. The number of full-time undergraduates at public four-year campuses will be influenced by the number of full-time studentsenrolling at the state’s community colleges. Tuition increases will have an impact on full- and part-time community college enrollments. The number of part-time undergraduates at both the community colleges and public four-year campuses will be impacted by changesin the per capita disposable income, in constant dollars, of Maryland residents. Noncredit continuing education enrollments at community colleges can be forecasted by applying the historical relationship betweenthe adult population 20 years of age or older in the county or service area of each two-year institution and past noncredit enrollmentsat each campus to future population projections.Students were distributed among the community colleges chiefly on the basis of recent market share, growth rate of each institution, andthe anticipated change in the college-age population in each campus’ county or counties. The predicted number of students for the fouryear campuses was determined largely by an examination of historical trends, although the recent market share and growth rate of eachcampus and institution-provided projections were also considered.2
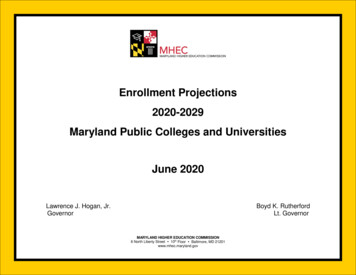
Highlights of the Enrollment Projections These projections do not incorporate any data tied to COIVID-19 and the resulting disruptions the pandemic has caused colleges in relation toenrollment of new and returning students. The data used were collected between December 2019 and February 2020 and reflect projected andactual data that, similarly, would not incorporate the effects of COVID-19. Total headcount credit enrollment at Maryland public institutions is projected to be 314,570 in Fall 2020, an increase of 7% (19,792 students)over Fall 2019 actual enrollment. The projections estimated that Fall 2019 enrollment would be 305,237, which was 10,459 (3.4%) more students than actual Fall 2019enrollment. Total headcount credit enrollment at Maryland public colleges and universities is projected to be 339,942 in Fall 2029, an increase of 15%(45,164 students) over Fall 2019. Total enrollment at community colleges is expected to be 143,167, an increase of 26% (29,879 students)from Fall 2019 to Fall 2029, and enrollment at public four-year colleges and universities is projected to be 196,775, an increase of 8% (15,285students) during the same period. Statewide, undergraduate enrollment is projected to grow by 41,983 students by 2029, an increase of 17%, reaching a total of 295,608. Over 10 years, MHEC projects that the number of full-time undergraduate students at community colleges will grow at a higher rate than thenumber of part-time students. Full-time enrollment at community colleges is expected to increase to 48,298, an increase of 12,393 or 35%,while part-time student enrollments are expected to grow to 94,869, an increase of 17,486 students or 23%. The 10-year projections for public four-year institutions, full-time undergraduate enrollment is projected to increase by 9% (to 100,975students, an increase of 8,547 students) while part-time undergraduate enrollment is expected to grow by 7% (to 51,466 students, an increaseof 3,557 students). Over 10 years, graduate and professional student enrollment is expected to grow to 44,334 students, an increase of 3,181 (8%). The number offull-time graduate students is projected to grow by 10% (1,926students) to 20,283, and the number of part-time students is expected to increaseby 6% (1,255 students) to 24,051. Full-time equivalent enrollment (FTE) and full-time day equivalent enrollment (FTDE) at community colleges are expected to grow betweenFall 2019 and Fall 2029. FTEs are expected to reach 89,805, an increase of 20,101 or 29%, and FTDE enrollment will increase 5% or 11,324to reach 57, 963.3
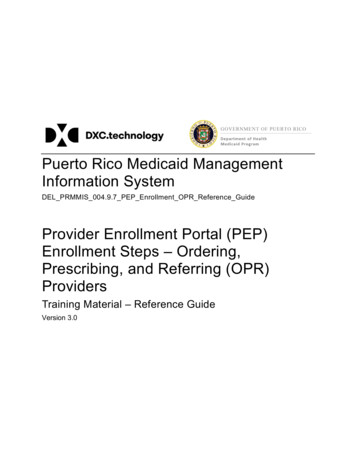
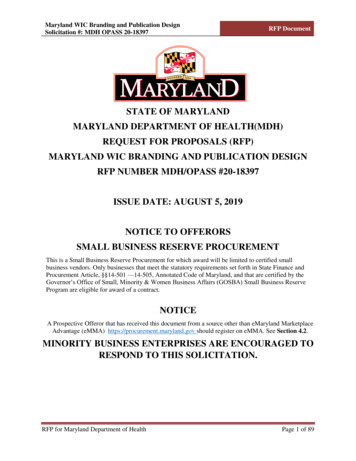
At public four-year institutions, FTEs and FTDEs are projected to both grow by 9% from 2019 to 2029; the FTE figures are projected to reach151,267, while FTDEs are expected to total 94,218.The University of Maryland University College is not included in the FTDE projections. State-funded noncredit FTE continuing education enrollment at the community colleges is projected to increase by 4% to 24,534 by FY 2029,an increase of 828 equivalent students compared to FY 2019. An analysis using the projections from the 2010-2019 Enrollment Projections Report (published in 2010) projected a Fall 2019 total headcountcredit enrollment 357,615, which is 62,837 (17.5%) higher than the actual data for Fall 2019. The primary driver of these differences is anoverestimation of the community college enrollment (170,178 estimated versus 113,288 actual). The public four-year projections (187,437estimated versus 181,490 actual) was much more accurate. Similar patterns play out for the FTE and FTDE figures, with the 2010 reportgreatly over-projecting the community college counts and much more accurately projecting the public-four year FTE and FTDE counts. Likelythe overestimation of the community college data was due, in part, by the surge of enrollment at the community colleges, which began in 2008and peaked in 2011.4
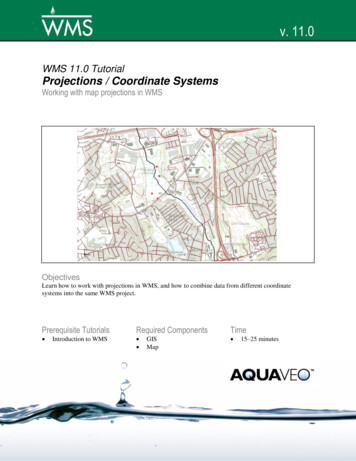
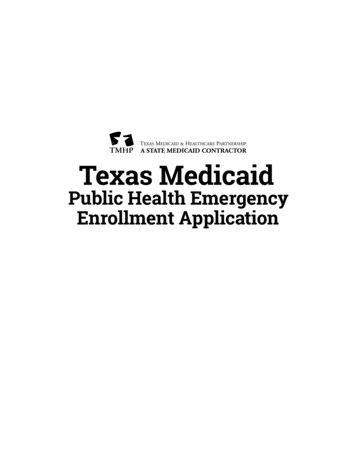
Projections of Headcount Enrollment at Maryland Public Four-Year InstitutionsFALL 19FY 20ActualFALL 20FY 21ProjectedFALL 21FY 22ProjectedFALL 22FY 23ProjectedFALL 23FY 24ProjectedFALL 24FY 25ProjectedFALL 25FY 26ProjectedFALL 26FY 27ProjectedFALL 27FY 28ProjectedFALL 28FY 29ProjectedFALL 29FY 30Projected% al UndergraduateGraduateFull-timePart-timeTotal GraduateTotal ePart-timeTotal UndergraduateGraduateFull-timePart-timeTotal GraduateTotal otal UndergraduateGraduateFull-timePart-timeTotal GraduateTotal Headcount5
Projections of Headcount Enrollment at Maryland Public Four-Year InstitutionsFALL 19FY 20ActualFALL 20FY 21ProjectedFALL 21FY 22ProjectedFALL 22FY 23ProjectedFALL 23FY 24ProjectedFALL 24FY 25ProjectedFALL 25FY 26ProjectedFALL 26FY 27ProjectedFALL 27FY 28ProjectedFALL 28FY 29ProjectedFALL 29FY 30Projected% eTotal UndergraduateGraduateFull-timePart-timeTotal GraduateTotal nUndergraduateFull-timePart-timeTotal UndergraduateGraduateFull-timePart-timeTotal GraduateTotal HeadcountUniversity of BaltimoreUndergraduateFull-timePart-timeTotal UndergraduateGraduateFull-timePart-timeTotal GraduateTotal Headcount6
Projections of Headcount Enrollment at Maryland Public Four-Year InstitutionsFALL 19FY 20ActualUniversity of Maryland BaltimoreUndergraduateFull-timePart-timeTotal UndergraduateGraduateFull-timePart-timeTotal GraduateTotal HeadcountFALL 20FY 21ProjectedFALL 21FY 22ProjectedFALL 22FY 23ProjectedFALL 23FY 24ProjectedFALL 24FY 25ProjectedFALL 25FY 26ProjectedFALL 26FY 27ProjectedFALL 27FY 28ProjectedFALL 28FY 29ProjectedFALL 29FY 30Projected% mePart-timeTotal UndergraduateGraduateFull-timePart-timeTotal GraduateTotal HeadcountUM College ParkUndergraduateFull-timePart-timeTotal UndergraduateGraduateFull-timePart-timeTotal GraduateTotal Headcount7
Projections of Headcount Enrollment at Maryland Public Four-Year InstitutionsFALL 19FY 20ActualFALL 20FY 21ProjectedFALL 21FY 22ProjectedFALL 22FY 23ProjectedFALL 23FY 24ProjectedFALL 24FY 25ProjectedFALL 25FY 26ProjectedFALL 26FY 27ProjectedFALL 27FY 28ProjectedFALL 28FY 29ProjectedFALL 29FY 30Projected% l UndergraduateGraduateFull-timePart-timeTotal GraduateTotal HeadcountUM Global CampusUndergraduateFull-timePart-timeTotal UndergraduateGraduateFull-timePart-timeTotal GraduateTotal HeadcountTOTAL SYSTEM OF MD.UndergraduateFull-timePart-timeTotal UndergraduateGraduateFull-timePart-timeTotal GraduateTotal ,713185,79919,10023,73042,830186,56410%6%8%8%8
Projections of Headcount Enrollment at Maryland Public Four-Year InstitutionsFALL 19FY 20ActualMorgan StateUndergraduateFull-timePart-timeTotal UndergraduateGraduateFull-timePart-timeTotal GraduateTotal HeadcountSt. Mary's CollegeUndergraduateFull-timePart-timeTotal UndergraduateGraduateFull-timePart-timeTotal GraduateTotal HeadcountTOTAL 4-YEAR PUBLICUndergraduateFull-timePart-timeTotal UndergraduateGraduateFull-timePart-timeTotal GraduateTotal HeadcountFALL 20FY 21ProjectedFALL 21FY 22Projected23FALL 22FY 23ProjectedFALL 23FY 24Projected(11)11FALL 24FY 25ProjectedFALL 25FY 26ProjectedFALL 26FY 27ProjectedFALL 27FY 28ProjectedFALL 28FY 29ProjectedFALL 29FY 30Projected% ,28324,05144,334196,77510%6%8%8%9
Projections of Full-Time Equivalent and Full-Time Day Equivalent Enrollment at Maryland Public Four-Year InstitutionsFALL 20FY 21ProjectedFALL 21FY 22ProjectedFALL 22FY 23ProjectedFALL 23FY 24ProjectedFALL 24FY 25ProjectedFALL 25FY 26ProjectedFALL 26FY 27ProjectedFALL 27FY 28ProjectedFALL 28FY 29ProjectedFALL 29FY 30Projected% 510%10%University of 8521,2612,8041,239-4%-4%University of Maryland inFrostburgSalisburyTowsonUMBCFTESFTDES10
Projections of Full-Time Equivalent and Full-Time Day Equivalent Enrollment at Maryland Public Four-Year InstitutionsFALL 20FY 21ProjectedUM College ParkFTESFTDESFALL 21FY 22ProjectedFALL 22FY 23ProjectedFALL 23FY 24ProjectedFALL 24FY 25ProjectedFALL 25FY 26ProjectedFALL 26FY 27ProjectedFALL 27FY 28ProjectedFALL 28FY 29ProjectedFALL 29FY 30Projected% ,2052,8782,2192,8962,2332,9122,2452,9302,2599%9%UM Global 44n/aTOTAL SYSTEM OF MD.FTESFTDES (except 38585,659141,13286,200141,89386,7489%9%Morgan 75,8527,6495,9007,7135,94911%10%St. Mary's 9%9%UMESTOTAL 4-YEAR PUBLICFTESFTDES (except UMUC)117%n/a
MARYLAND HIGHER EDUCATION COMMISSIONEnrollment Projection Model - Four Year Colleges and UniversitiesThese are the assumptions and steps used in projecting the headcount enrollments at Maryland’s public four-year colleges and universities.ASSUMPTIONS1.Enrollments of Maryland residents can be forecast by matching the historical relationship between the state’s populationand past in-state enrollments, then incorporating population projections for the state.2.The ratio of in-state to out-of-state students in Maryland will remain relatively constant.3.The number of full-time undergraduates will be affected by trends in high school graduates and the number of full-timestudents enrolling at the state’s community colleges.4.The number of part-time undergraduates will be impacted by changes in the per capita disposable income, calculated inconstant dollars, of Maryland residents.STEPS1.Total enrollment at Maryland’s public four-year campuses during the past ten years were categorized by gender, age (11groupings), and enrollment status (full- and part-time, undergraduate and graduate/professional). Students whose age was unknownwere distributed in the other age categories on a proportional basis.2.The percentage of students who were Maryland residents was determined for each gender and enrollment group.3.The state’s population during the ten-year period was categorized by gender and the same age groupings. The actual and projectedpopulation figures were obtained from the Maryland Office of Planning.4.A least-squares fit regression analysis was used to examine the relationship between the in-state enrollment (dependent variable)and the state’s population (independent variable). This relationship was then applied to the population projections through the year2028 to determine the projected enrollments of Maryland residents.12
5.Out-of-state enrollments were projected to be consistent with the ratio of in-state to out-of-state students in the last year in whichactual enrollment figures were available. Separate ratios were used for each of the gender and enrollment categories.6.The annual percentage change in the number of Maryland full-time community college students over ten years, with a twoyear time lag, was integrated into the regression model as an independent variable for predicting the number of full-timeundergraduates.7.The annual projected change in the number of Maryland high school graduates through spring 2029 was integrated into theregression model as an independent variable for predicting the number of full-time undergraduates. Projections for Marylandhigh school graduates were obtained from the Western Interstate Commission for Higher Education.8.The annual percentage change in the per capita disposable income, in constant dollars, of Maryland residents over five years,with a two-year time lag, was integrated into the regression model as an independent variable for predicting the number ofpart-time undergraduates. The income information was obtained from the Bureau of Economic Analysis.9.The projected number of full-time equivalent students (FTES) at each public four-year institution was calculated from theheadcount enrollments. This conversion was made by: 1) computing headcount-driven FTES figures for each campus foreach year (the total number of full-time students plus one-third of the part-time), and 2) multiplying these figures by theaverage ratio of headcount- to credit hour-driven FTES over the past three years. A separate ratio was obtained for eachcollege, and these ratios were applied to each year through 2029 (FY 2030).10.The projected number of full-time day equivalent students (FTDES) at each public four-year institution was calculated bymultiplying the FTES enrollment for each campus by the average ratio of credit hour-driven FTES to FTDES over the pastthree years. A separate ratio was obtained for each campus, and these ratios were applied to each year through 2029. Afigure equaling the most recent first- and second-year headcount enrollment at the University of Maryland School ofMedicine was added to the FTDES of University of Maryland, Baltimore (UMB) in each year. The standard formulaunderstates the FTDES at UMB since the School of Medicine does not operate on a credit hour basis.13
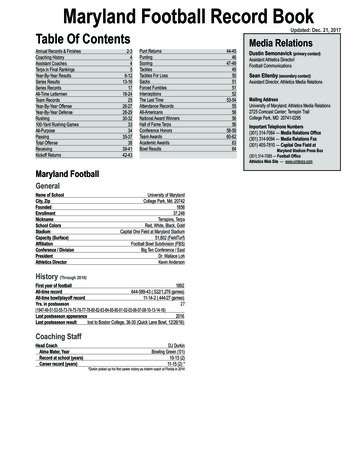
Projections of Headcount Enrollment at Maryland Community CollegesFALL 19FY 20ActualAllegany College of Md.Full-timePart-timeTotal HeadcountFALL 20FY 21ProjectedFALL 21FY 22ProjectedFALL 22FY 23ProjectedFALL 23FY 24ProjectedFALL 24FY 25ProjectedFALL 25FY 26ProjectedFALL 26FY 27ProjectedFALL 27FY 28ProjectedFALL 28FY 29ProjectedFALL 29FY 30Projected% 91,9293,2281,2881,9433,23125%25%25%Anne Arundel CCFull-timePart-timeTotal %22%Baltimore City CCFull-timePart-timeTotal 32%23%26%Carroll CCFull-timePart-timeTotal HeadcountCCBCFull-timePart-timeTotal HeadcountCecil CCFull-timePart-timeTotal Headcount14
Projections of Headcount Enrollment at Maryland Community CollegesFALL 19FY 20ActualFALL 20FY 21ProjectedFALL 21FY 22ProjectedFALL 22FY 23ProjectedFALL 23FY 24ProjectedFALL 24FY 25ProjectedFALL 25FY 26ProjectedFALL 26FY 27ProjectedFALL 27FY 28ProjectedFALL 28FY 29ProjectedFALL 29FY 30Projected% Change19-29SoMdFull-timePart-timeTotal ,0897,8072,6645,1267,79018%25%23%Chesapeake CCFull-timePart-timeTotal 6738%23%27%Frederick CCFull-timePart-timeTotal eTotal 5129684734%24%30%Hagerstown CCFull-timePart-timeTotal %20%22%GarrettHarford CCFull-timePart-timeTotal Headcount15
Projections of Headcount Enrollment at Maryland Community CollegesFALL 19FY 20ActualFALL 20FY 21ProjectedFALL 21FY 22ProjectedFALL 22FY 23ProjectedFALL 23FY 24ProjectedFALL 24FY 25ProjectedFALL 25FY 26ProjectedFALL 26FY 27ProjectedFALL 27FY 28ProjectedFALL 28FY 29ProjectedFALL 29FY 30Projected% Change19-29Howard CCFull-timePart-timeTotal mePart-timeTotal %11%Prince George's CCFull-timePart-timeTotal 122,1782,890872
The University of Maryland University College is not included in the FTDE projections. State-funded noncredit FTE continuing education enrollment at the community colleges is projected to increase by 4% to 24,534 by FY 2029, an increase of 828 equivalent students compared to FY 2019.