Transcription
Synchronicity Market TimingCarolyn BorodenFibonacci Trading –McGraw Hill1
2
3
4
5
6
Why use this type of Fibonaccianalysis?It enables you to identify high probability,relatively low risk trade SETUPS where the risk isclearly defined along with the TARGETS.7
This works on any time frame and essentially anygood market data.I have applied this method to Stocks, ETF’s,Futures and the FOREX markets.It is an excellent methodology to use withOPTIONS strategies!!You can see things in the market that you willNEVER see using indicators alone.8
Fibonacci NumbersFibonacci Number Series:0,1,1,2,3,5,8,13,21,34,55,89,144,233,etc The number series will continue toinfinity by adding the previous twonumbers9
Fibonacci RATIOSderived from the # seriesare used in this analysisThe ratios used are:.382, .50, .618, .786, 1.0, 1.272 & 1.618(.236, 2.618, 4.236-confirming ratios)10
I can show you where .618 camefrom but what about some of theseother ratios?1.0 - .618 .3821.0 divided by 2 .50square root of .618 .7861.618 is the expansion of .618square root of 1.618 1.272.618 - .382 .23611
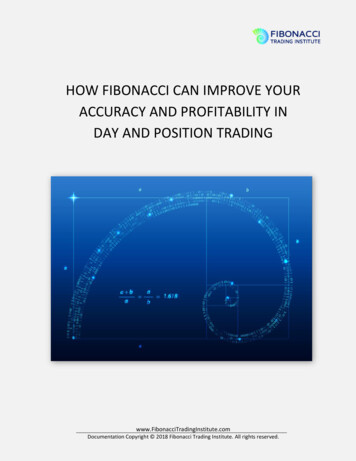
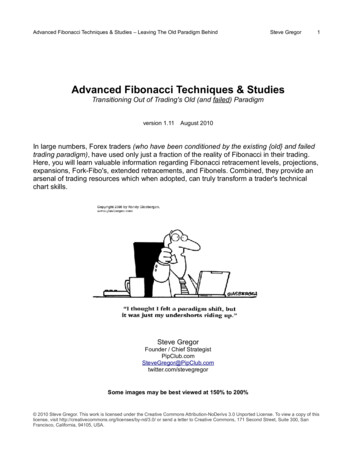
Fibonacci Price RetracementsFor possible support, we run low to high swings using the ratios below.For possible resistance, we run high to low swings using the same ratioshighhighfor potential resistancefor potentialsupportlowlow% Retracement .382, .50, .618,.78612
13
14
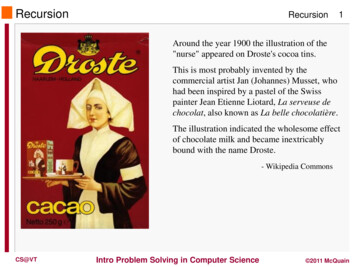
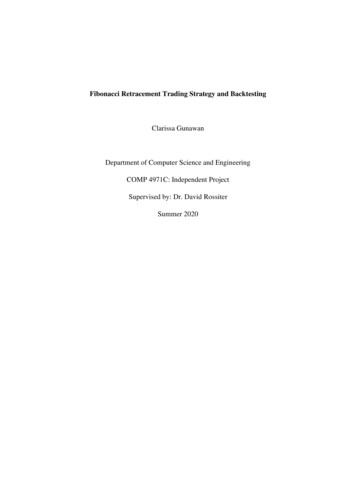
Fibonacci Price ExtensionshighhighlowlowPrice extensions are essentially Retracements beyond 100%.We use the ratios of 1.272 and 1.618.We run the run low to high swings for possible support.We run the high to low swings for possible resistance.15
16
17
18
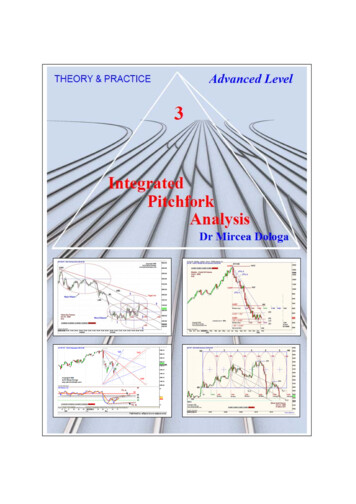
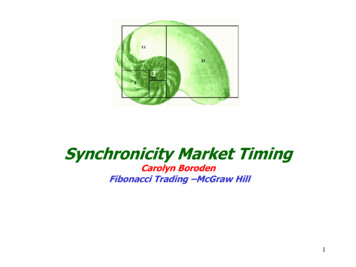
Fibonacci Price Projectionsfor possible resistancefor possible supporthighhighhighlowlowlowFibonacci price projections are measured from 3 points on the chart to compare swings inthe same direction. We mostly use 1.00% and sometimes 1.618 for these projections.We run prior low to high swings from another low for possible resistance.We run prior high to low swings from another high for possible support.19
20
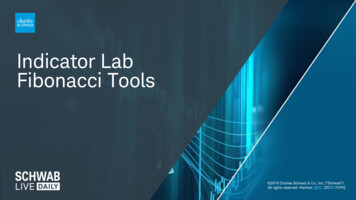
highlowlow21
22
23
My most powerful trade setup is called aFibonacci PRICE ClusterDefinition: the coincidence of at least 3 Fibonacciprice relationships that come together within arelatively tight range.24
25
Now how do you trade this?First we need what I call a TRIGGER totell us it is worth placing a bet against thisprice cluster zone!!For this we go down to a lower time frame chart!26
Formula to make money with my setups: Setup trigger trade entry then managetrigger no trade)(NOIdentify your setup:price cluster setup (3 or more Fibonacci price relationships)symmetry setup (single symmetry projection or more in the direction of the trend)two-step setup (3 or more Fibonacci price relationships within a two-step pattern formation)If price tests and RESPECTS the setup zone, for A TRIGGER GO TO A LOWER TIME FRAMECHART for an entry as it will signal an entry closer to where your RISK is defined!Swing Trade Setup Time FramesWeekly, Daily, 120 or 30-minute trade setups can be used for swing tradesTrigger time frames:15- minute for aggressive entry (will get stopped out more often)30- minute for regular entry (won't get stopped as much as the 15-minute chart)Buy Trigger for a Swing Trade Entry:8 ema crosses above the 34 ema AND a prior swing high is taken outSell Trigger for a Swing Trade Entry:8 ema crosses below the 34 ema AND a prior swing low is taken out***Either take the initial trigger or the next pullback after the trigger*** If you are NOT comfortablewith the risk, then don’t take the trade!!!***27
28
29
Intraday timing30
31
32
33
34
35
36
37
38
39
40
41
42
43
44
45
This got stopped out46
47
48
49
50
19 Fibonacci Price Projections low Fibonacci price projections are measured from 3 pointson the chart to compare swings in the same direction. We mostly use 1.00%and sometimes 1.618for these projections. We run prior low to high swings from another low for possible resistance.