Transcription
CHANGES IN STORM HYDROGRAPHS AFTERROADBUILDING AND SELECTIVE LOGGING ONA COASTAL WATERSHED IN NORTHERN CALIFORNIAbyKenneth A. WrightA ThesisPresented toThe Faculty of Humboldt State UniversityIn Partial Fulfillmentof the Requirements for the DegreeMaster of ScienceAugust, 1985
CHANGES IN STORM HYDROGRAPHS AFTERROADBUILDING AND SELECTIVE LOGGING ONA COASTAL WATERSHED IN NORTHERN CALIFORNIAbyKenneth A. Wright
ABSTRACTThe effects of road building and selective tractor harvestingon storm peak flows and storm volumes were assessed for a small (424hectare) coastal watershed in Northern California. Two watersheds, theNorth and South Fork of Caspar Creek were calibrated from 1962 to 1967while no treatments took place. Roads were then built on the SouthFork, and the two watersheds were monitored until 1971. Between 1971and 1973 the South Fork was selectively tractor logged, removing 60percent of the timber volume. The storm flows were monitored until1976.Only the very small (566 l/s or less) storm peaks or volumes(121 kiloliters or less) were increased after roadbuilding and logging.Roadbuilding alone significantly (p 0.10) increased the small stormpeaks approximately 20 percent, but did not affect the storm volumes.Logging increased both the peaks and volumes of the small storms byabout 80 percent and 40 percent respectively. The large storm peaks andvolumes were not significantly increased by either roads or logging,even though over 15 percent of the watershed was compacted in roads,skidtrails and landings. The increase in small storm peaks and volumesare not considered significant to the stream's stability or sedimentregime.iii
ACKNOWLEDGEMENTSThis research was part of a joint effort by the Pacific SouthwestForest and Range Experiment Station and the California Department ofForestry. I appreciate being allowed to analyze the data collectedduring this project and for the use of the computer facilities at PSW'sRedwood Sciences Lab. Redwood Sciences Lab allowed me to do a portionof this thesis while under their employment.I wish to express my sincere thanks to my major advisor, Dr.Raymond M. Rice, to whom I owe much for his advise, guidance, andencouragement to complete this thesis. I thank Ray for his patienceand soft-heartedness in allowing me many extensions on this thesis.Ray allowed me to make my own mistakes, but prodded me back on trackwhen I ventured off on tangents, for this I am grateful. I aspire tothe directness and clarity of expression he has in reporting research.It has been a rewarding and pleasureful experience being a graduatestudent under Ray.I would also like to thank members of my committee Dr. GerryAllen and Dr. Carl Yee for their guidance and the background that theirclasses provided for this study and my career in hydrology.Also to my two and three-year-old daughters, Debbie andRegina, for not helping type this thesis and knowing when it was timefor their Daddy to stop working and play. Finally, my thanks to myloving wife Elena who not only provided assistance in preparation of my"little” thesis but also provided support and encouragement.iv
TABLE OF CONTENTSPageABSTRACT .iiiACKNOWLEDGEMENTS .ivLIST OF TABLES .viiLIST OF FIGURES .viiiINTRODUCTION .1Objectives .2Literature ReviewCaspar Creek. 3.8MATERIALS AND METHODS .10Instrumentation.10Treatment History.10Selection of HydrographsHydrograph SeparationData Analysis.14.14.15Determining Affects of Roadbuilding and Loggingon Three Hydrograph Parameters . .15Determining the Treatment Effects on Large VersusSmall Flows .21Determining Variations in Treatment Effects withAntecedent Moisture . .21Determining Significant Variables in Logging Effects .22RESULTS .23Effects of Roadbuilding and Logging on ThreeHydrograph Parameters .23v
viTABLE OF CONTENTS (CONTINUED)PageLarge Storm Flows Versus Small Storm Flows.25Roaded Period .25Logged Period .31Variation of Effects with Antecedent Moisture ConditionsSignificant Variables in Logging Effects.31.32DISCUSSION .38Evapotranspiration and Interception EffectaCompaction Effects.38.41Comparison with Other Studies .45Management Implications.48SUMMARY AND CONCLUSIONS .50REFERENCES CITED .51PERSONAL COMMUNICATIONS .55
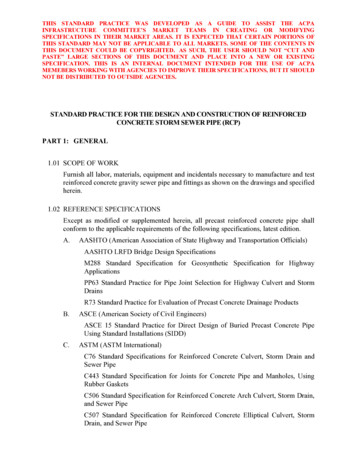
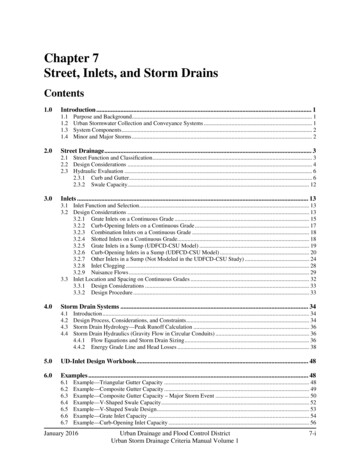
LIST OF TABLESTable1PageSummary of Paired Watershed Studies on the Effectsof Roadbuilding and Logging on Stormflows in thePacific Northwest . 72Summary of Treatments in the South Fork ofCaspar Creek . 133Description of Hydrograph Parameters and OtherVariables Used in the Analysis . 164Regression Coefficients, R-Squared, Residual Sun ofSquares, F-values, and Chow's F-test Showing whichRegressions were Significantly Different fromthe Calibration Period Regression, for eachHydrograph Parameter . 245Difference in PFLOWSFT, TVOLSFT and QVOLSFT Beforeand After Road Building for High, Medium andLow Storm Flows . 296Difference in PFLOWSFT, TVOLSFT and QVOLSFT Beforeand After Logging and Road Building for High,Medium and Low Storm Flows . 307Difference in PFLOWSFT, TVOLSFT and QVOLSFT Beforeand After Logging for Base Flows Greater than andLess than 28.3 1/s (High and Low Antecedent SoilMoisture Conditions . 338Best Regression (as determined by Mallows' Cp) of AllPossible Subset Regressions for PFLOWSFT UsingLogged Period Data . 349Best Regression (as determined by Mallows' Cp) of AllPossible Subset Regressions for TVOLSFT UsingLogged Period Data . 37vii
LIST OF FIGURESFigurePage1Vicinity Map of Caspar Creek Paired Watersheds . 92Diagram of the Hydrograph Parameters . 183Relationship Between Peak Flows (PFLOW) on the Northand South Fork of Caspar Creek during theCalibration Period and the Logged Period . 264Relationship Between Storm Total Volumes (TVOL) onthe North and South Fork of Caspar Creek duringthe Calibration Period and the Logged Period . 275Relationship Between Storm Quick Volumes (QVOL) onthe North and South Fork of Caspar Creek duringthe Calibration Period and the Logged Period . 286Relationship of Base Flow (Antecedent Soil Moisture)to Percentage Deviation of Post-Logging Peak Flowsfrom Predicted Pretreatment Flows . 407Relationship of North Fork Peak Flows to PercentageDeviation of South Fork Peak Flows from PredictedPretreatment Flows, During Calibration andLogged Period . 428Relationship of North Fork Storm Volumes to PercentageDeviation of South Fork Storm Volumes from Predicted,Pretreatment Volumes, During Calibration andLogged Period . 439Relationship Between Peak Flows (PFLOW) on the Northand South Fork of Caspar Creek During TheCalibration Period and the Logged PeriodAfter Removing the Two Largerst Peak Flowsfor the Logged Period . 50viii
INTRODUCTIONThe influence of forest management activities on stormflows has been subject to much debate and controversy. Onesubject of debate is the influence logging and road buildingmay have on increasing storm flows and subsequent cumulativewatershed effects. If the magnitude or duration of the largechannel-forming flows are increased, the stream power isincreased for eroding channel banks, scouring out gravel bedsand removing riparian vegetation (Gangmark and Bakkala 1960;Rice 1981; Chamberlin 1982). This could adversely affect thefisheries by reducing the bank cover, scouring out spawningbeds, increasing the stream temperature by reducing shade, anddecreasing the overall biotic productivity by reducing leaflitter input into the stream system (Chamberlin 1982).Increasing the large channel forming flows can increasesedimentation and channel deposition if the higher flowsundermine stream banks and erode the toe portions of unstableslopes, thereby triggering bank failures and landslides intothe channel (Farrington and Savina, 1977; Rice 1981). Theincreased sediment can fill in pools and silt in spawningbeds, reducing the streams biotic productivity (Chamberlin1982).The effect of forest management on large peak flows isa major issue relating to cumulative watershed effects. Iftimber management activities do increase the large peak flows,then as more cut units and roads are added to a watershed,their effects on peak flown could cumulate and could changethe dynamic equilibrium of the stream.1
2Federal land management agencies are required to analyzecumulative impacts of their management by the National EnvironmentalPolicy Act. Most of the cumulative watershed impact analyses presentlybeing developed by the Forest Service are based on the assumption thatthe large channel-forming flows are increased as a result of forestmanagement activities (Seidelman 1981; Haskins 1983; Chatoian 1985).For the Pacific Northwest the issue of whether large channel-formingflows are increased in size or duration by forest management has notbeen fully resolved because the findings have been mixed (Harr et al.1975; Ziemer 1980; Rothacher 1973; and Harr et al. 1982). The ForestService has been developing cumulative impact methodologies withoutadequate information to do so, because of the legal requirements toaddress cumulative impacts. Until more is known about the effects ofroads and logging on stormflows and their subsequent cumulativeeffects, these issues will continue to be quite controversial.ObjectivesThe purpose of this study was to determine the effectsof selective harvest and road building on storm flows for acoastal watershed. Specifically, the objectives were to:1)Determine whether road building and selective harvestaltered peak discharge, total storm volume, and quickflow volume.2)Determine whether road building and selective harvestaltered large hydrographs and small hydrographs to thesame degree.3)Develop hypotheses about the effects of road building andselective logging on storm hydrograph parameters.
3Ziemer (1981) did an analysis on Caspar Creek, the same site asthis study, to determine the effects of roadbuilding and logging on thestorm flows. The difference between Ziemer's work and this study isthat hydrographs were defined differently and different parameters weredeveloped. The storm hydrograph parameters used in this paper weresimilar to parameters used on the Alsea watershed study by Harr et al.(1975), Harris (1973), Krygier and Harr (1972), and Hsieh (1970).Literature ReviewThe first analysis of the effects of logging on floods in thePacific Northwest was published by Anderson and Hobba (1959). The studywas done by analyzing United States Geological Survey (USGS) gagingrecords and logging history for sub-watersheds of the Willamette Riverin Oregon. Anderson and Hobbs (1959) concluded that logging hadincreased floods, and that both for great storms and small storms theeffects of forest cutting on floods were the same. These conclusionswere in contrast to more recent paired watershed studies.On the H.J. Andrews experimental watershed HJ-1, in centralOregon, Rothacher (1973) found that logging had only minor effects onthe major peak streamflows, which occurred when soils were thoroughlywet. Exceptions were the early fall storms which in general do notresult in major peak streamflows. The early fall stream flows were from40 to 200 percent higher than was predicted from the control watershedusing the pre-logging data. Although some post-logging peaks wereincreased to relatively high levels, none of the increases exceededprevious high stormflow peaks. Roading another of the H.J. Andrewswatersheds (HJA-3) significantly decreased the size of the peak
4flows; Rothacher (1973) could not explain this observation except forthe fact that only two years of data existed with only relatively smallstorm sizes. Other more recent watershed studies on the H.J. AndrewsExperimental Forest (Harr et al. 1982) found that neither the size nortiming of peak flows changed significantly after shelterwood logging(HJA-7 watershed) and after clearcut logging (HJA-6 watershed). OnHJA-10 (a 10.2 hectare watershed which was 100 percent clearcut loggedby a cable yarding system and left unburned) Harr and McCorison (1979)found the size of annual peak flows caused by rain with snow melt wasreduced 36 percent. The peak flows resulting from rainfall alone werenot significantly changed.For the Coyote Creek Experimental Watersheds, in SouthernOregon, (Harr et al. 1979) found that roading and logging didsignificantly (p 0.05) increase peak flows on two out of the threetreated watersheds. Although large stormflow data was lacking for thecontrol period in this study, by extrapolating the control periodregression line beyond the data points to the higher flows indicatedthat logging and road building increased the larger stormflows.Increases in size of peak flow appeared to be related to the amount ofwatershed area where soils were compacted. Watershed CC-1, which wasshelterwood harvested (removing approximately 50 percent of the basalarea) and tractor logged, had 15 percent of its area compacted in skidtrails and roads. Harr et al. (1979) determined that a nine year returnperiod flow would be increased approximately 48 percent. WatershedCC-3, which was clearcut and tractor logged, had 13 percent of its areacompacted from skid trails or roads. The regression showed that a nineyear return period flow would be increased approximately 35
5percent. Watershed CC-2 had 5 percent of its area heavily compactedand, although not statistically significant, a nine year flood flowwould be increased 11 percent. These results should be interpreted withcaution because of the lack of high flow data during the controlperiod, causing a need to extrapolate the regressions in order toestimate treatment effects.On the Alsea experimental watersheds, in the Oregon CoastRanges, Harr et al. (1975) found that peak flows on Deer Creek 3 wereincreased significantly when roads, landings and skid trails occupied12 percent of the watershed. Harr suggests that a 10-year event couldbe increased to a 25-year event, and a 25-year event could be increasedto a 90-year event on watersheds with 12 percent of their area inroads, landings and skidtrails. Significant increases in aid-winterpeak flows also occurred on Deer Creek 4 which was clearcut cablelogged, and had no roads. Krygier and Harr (1972) were not able toexplain the increase in mid-winter. Frequent site trips showed noevidence of overland flow occurring during the storms. On the main DeerCreek watershed and Needle Branch Creek watershed, Harris (1973) foundno significant increase in the peak flows exceeding 5.5 1/s-ha, afterclear-cutting 26 percent of the main Deer Creek watershed and 82percent of the Needle Branch watershed. Harr et al.'s (1975) analysis,which included smaller storms, showed that peak stormflows at NeedleBranch Creek significantly increased after logging. The greatestincreases in peak stormflows occurred during the fall, but the midwinter storms on Needle Branch Creek also increased. These resultsshould be interpreted with caution because there were very few or nostormflows of significant size after treatment. No peak during the
6post clear-cutting period on Needle Branch or Deer Creek 4 exceededthe estimated annual peak of 9.2 l/s-ha. The other watersheds in theAlsea study also used approximately the same return period flows (Harret al. 1975).On Caspar Creek, in Northern California, Ziemer (1980) foundthat the roads, which occupied over 5.5 percent of the South ForkCaspar Creek watershed, had no significant effects on peak flow or theduration of the highest one half of the storm flow (HALFQ). Selectivetractor harvesting, removing 60 percent of the volume over the entirewatershed, did increase both peak flows and HALFQ, but only for flowsless than 0.78 1/s-ha. The smaller peaks were increased an average of107 percent. Over 15 percent of the watershed was compacted in skidtrails, landings and roads, but in contrast to the Harr et al. (1979)study on Coyote Creek and the Harr et al. (1975) study on the Alseawatersheds, the large mid-winter flows were not significantly increased(Table 1).There is some evidence that clearcutting can increase the largestormflows, when a warm rain occurs on a wet snow pack. Harr (1980) andChristner and Harr (1982) evaluated USGS gaging records and harvestrecords for watersheds in the Willamette River basin and found evidencethat logging had increased the large storm flows. They speculate thatthe increases occurred during rain on snow events where the openingsfrom clear cut logging increased the rate of latent heat transfer whichcaused rapid melt rates and increased runoff. Anderson and Hobba(1959), also using USGS gaging records, found that both small and largepeaks had increased for watershed drainage in the Willamette River.
cablecablecable72% cable10%tractor23% tractor77% cable14% tractor16% cabletractorcable60% tractor40% cable10% tractor90% cablecablecableMeanRainfall 16%-----12%4%5%12%5%13%19%-----0.19 and0.035.5 and0.030.035.5 and0.032.22.22.22.24.54.51.110%-----1.1Min fects onPeak Flowsbpks 0.19-0.78 increased 0.52 (107%)large pks 4.7 nsfall pks mean increase 3.0 (51%)winter pks mean increase 1.1 (20%)fall pks mean increase 0.33 (50%)winter pks man increase 1.3 (30%)large pks 5.5 ns ;pks 0.03:-fall pks mean increase 1.7 (50%)- winter pks mean increase 1.1 (19%)no significant change in peak flowsmean pks increased 1.5 (44%); largerpka (9yr rtn pd) increased 3.0 (35%)no significant change in peek flowsmean pks Increased .85 (30%); largerpks (9yr rtn pd) increased 3.2 (48%)annual rain on :now pka decreased d4.4 (36%); annual rein fall pks nsno significant change in peak flowsor timing of peakflowsno significant change in peak flowsor timing of peak flowsmoan increase 0.33 (10%); date onlarger pks lostfall pks increased up to 7 (200%)larger winter pks ns cLogging Effects on Peak Flows[flow change in l/s/ha (%)]Ziemer (1980)Krygier andHarr (1972)Harr et al.(1975)Harris (1973);Harr et al.(1975)Harris (1973)Harr et al.(1979)Harr et al.(1979)Harr et al.(1979)Harr andMcCorison (1979)Harr et al.(1982)Harr et al.(1982)Rothacher(1973)Rothacher(1973)Referencea) CC-lOO% Clearcut logged over 100% of the watershed; SC-60% - Shelterwood harvest removing 60% of the basal area; BB-100 - broadcast burned, 100%of the watershed; TP-23% tractor piled, 23% of the watershed; YUM-77 slash was cable yarded over 77% of the watershed; end UT slash nottreated.b) To convert the results in the text from l/s to l/s/ha divide l/s by 508 ha for the North Fork and 424 ha for the South Fork Caspar Creek watershed.c) ns no significant change detected.d) An annual peak flow has a return period of about 2 years.South ForkCaspar Creek1649Coyote CreekWatershed 3Deer Creaksubwaterahed 468Coyote CreekWatershed 24069Coyote CreekWatershed 1Deer CreekSubwatershed 310H.J. AndrewsWatershed 1030321H.J. AndrewsWatershed 7Deer Creek13H.J. AndrewsWatershed 670101H.J. AndrewsWatershed 3Alsee studyNeedle Branch95Area(ha)Summary of Paired Watershed Studies on the Effects of Roadbuilding and Logging onStormflows in the Pacific Northwest.H.J. AndrewsWatershed 1WatershedTable 1.7
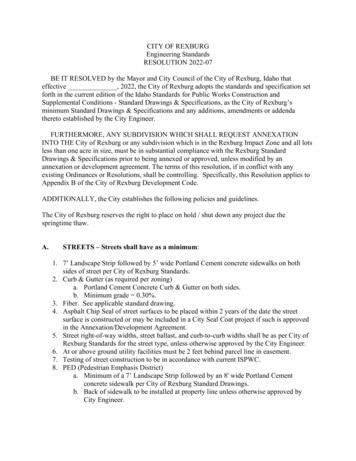
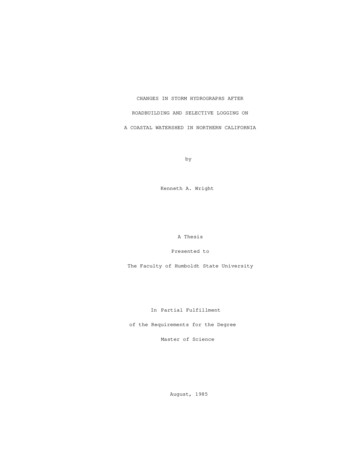
8Caspar CreekThis study analyzed data from the North and South Fork ofCaspar Creek. Caspar Creek is located in the Jackson State Forest,about 10 km south of Fort Bragg, California, and about 7 km from thePacific Ocean (Figure 1). The North and South Forks of Caspar Creekdrain watersheds having areas of 508 ha and 424 ha respectively. Soilsare mainly Hugo and Mendocino, overlying sedimentary rocks (Rice et al.1979).The climate is Mediterranean, having mild summers with fog butlittle or no rain. Caspar Creek does not receive any appreciablesnowfall. The rain fall averages about 120 cm per year (Ziemer 1981).About 35 percent of both watersheds have slopes less than 30percent. The South Fork has about one percent of its area in slopesgreater than 70 percent, whereas the North Fork has about seven percentof in slopes greater than 70 percent (Ziemer 1981).
9Figure 1.Vicinity Map of Caspar Creek Paired Watersheds.
MATERIALS AND METHODSThe Caspar Creek watershed project was started in 1961, as acooperative project between the Pacific Southwest Forest and RangeExperiment Station, Forest Service U. S. Department of Agriculture andthe California State Department of Forestry.InstrumentationIn November 1962, 120-degree sharp-crested V-notch weirs withrectangular sections for higher flows (over 690 l/s) were installed atthe lower end of each watershed, the North and South Forks of CasparCreek. Water level recorders (Model A-35, Leopold and Stevens Instruments, Beaverton Or.) were also installed on the ponds immediatelyupstream of the weirs. The ponds were both approximately 0.1 ha in sizeand also served as debris catch basins for the concurrent sediment study.Treatment HistoryThe North and South Forks of Caspar Creek were originallyclearcut logged and burned in the late 1800's, the North Fork about 20years after the South Fork (Tilley 1977). When the study began in 1962,both watersheds supported fairly dense stands (700 m3/ha) of secondgrowth redwood (Sequoia sempervirens (D. Don)Endl.), grand fir (Abiesgrandis (Dougl. ex D.Don)Lindl.), western hemlock (Tsuga heterophylla(Raf.)Sarg.) and Douglas-fir (Pseudotsuga menziesii (Mirb.)Franco). Thetimber stand on the South Fork watershed was about10
1185 years old; the timber stand on the North Fork was approximately 65years old. Because of the age difference, the North Fork was selectedas the control and the South Fork as the watershed to be selectivelyharvested. The road location and construction, and the timber harvestpractices were designed to meet standards which in 1971 were considered"state of the art" practices, but also considered commerciallyacceptable by the local tuber contractors.Both watersheds were monitored in an undisturbed conditionbetween 1962 through the spring of 1967. During the summer of 1967about 6.8 km of main-haul logging road and spur roads were constructedfn the South Fork watershed. Most of the logging roads were constructedadjacent to the stream channel. Of the total 6.8 km of road, 6 km werewithin 61 m of the stream and 2.3 km impinged directly on the streamchannel. The coarse debris in the stream and along the channel banks,resulting largely from the road construction, was mostly removed afterroad construction. The roads (including cut-and-fill slopes) occupied19 ha. (4.5 percent of the total watershed area) from which 993 m3/ha(85 MBF/acre) of timber was removed.About 110 m of stream bed were disturbed by tractor operationdirectly in the stream. These areas were primarily around bridgecrossings, landings, and in a stretch of stream cleared of debris whichhad been deposited there from the road construction. All fill slopes,landings and mayor areas of soil exposed by the road buildingactivities were fertilized and seeded with annual ryegrass (Loliummultiflorum) in September 1967. The grass was well established beforethe first rains in November (Jackman and Stoneman 1973).
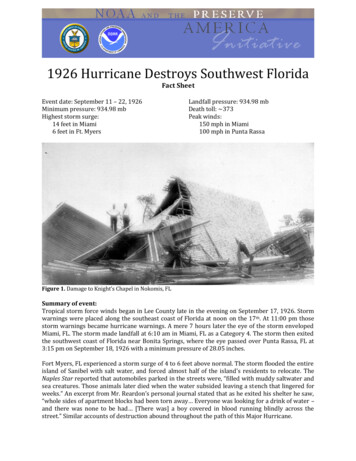
12From 1967 through the spring of 1971, stream flow was measuredto record the effects of road construction.Logging began on the South Fork of Caspar Creek during thesummer of 1971 and continued over a three year period. The South Forkwatershed was divided into three sale areas, the first sale started atthe weir and continued a third of the way up the watershed (Figure 1).The lower area (101 ha) was selectively logged, removing 59 percent ofthe timber volume during the summer of 1971. The middle area (128 ha)was selectively logged during the summer of 1972, removing 69 percentof the timber volume. The remaining area (176 ha) was selectivelylogged in the summer of 1973, removing about 65 percent of the timbervolume (Table 2). All logging was done by tractor. Some of the steeperslopes required that skid trails be constructed. The proportion of thewatershed area heavily compacted (area in roads, landings and skidtrails) occupied over 15 percent of the watershed (Table 2). Most ofthe roads and landings were near or adjacent to the streams, and manyof the skid trails did not have crossdrains installed.The selection cutting removed single trees and small groups oftrees with the objectives of reserving healthy, fast-growing stands ofthe more desirable species and providing openings to encourageregeneration. Most of the scattered old-growth timber was removed.Near the county roads and the boundary of Russian Gulch State Park,cutting was reduced and some old growth trees were left for aestheticreasons.
13Table 2. Summary of Treatments in the South Fork of Caspar .2Skid Trails (ha)08.811.215.435.4Landings (ha)03.51.33.68.44.57.810.915.615.6Area harvested (ha)AverageTotal424Ave Stand Volume(m3/ha)(MBF/acre)Volume harvested(m3/ha)(MBF/acre)Road constructionKilometershectaresArea Compacted (%)(roads, landings,and skid trails)aRoad construction right-of-way acreage.
14Selection of HydrographsThe criteria used to select the hydrographs for analysis werethe following: 1) All hydrographs roust have an induced peak flow of atleast 28.3 l/s (0.056 l/s ha) on the North Fork; 2) The storm had tohave complete records for both the control and treated watershed forthe parameter being measured; 3) Store pairs had to correspond in tine;and 4) Story flows had to posses an initial rise greater than 0.0055l/s ha hr. Precipitation records in each watershed were also examinedwhen selecting the hydrographs, to prevent selecting hydrographs whichwere different because of localized differences in stores. Nosignificant differences in precipitation between the watersheds couldbe identified.The data were taken from the water level recording charts andconverted to discharge for each time interval using the rating equationfor the weirs. For each storm hydrograph I determined the initial, peakand ending flow, and calculated the tine-to-peak, storm duration, totalvolume, and quick volume.Hydrograph SeparationHydrograph separation into quick volume (that part of runoffwhich enters the stress promptly after the rainfall or snow melt) anddelayed volume (the sustained fair-weather component of the runoff) wasbased on the method described by Hewlett and Hibbert (1967). A lineprojected from the initial rise, at a slope of 0.0055 l/s ha hr, untilit intersected the falling limb of the hydrograph, divided the stormhydrograph into quick volume and delayed volume. Time-to-peak, peak
15discharge, and total volume were also determined for each of thehydrographs selected. Precipitation variables and ratio variables werealso determined for each of the hydrograph (Figure 2 and Table 3). Thehydrograph parameters were abbreviated and a prefix added (N or S) toindicate the which fork the parameter measured, for example, NTVOLwould be North Fork total store volume and STVOL would be the SouthFork total story volume.The hydrograph parameters used in this analysis were originallydeveloped on the Alsea watershed study and described by Krygier andHarr (1972), and Hsieh (1970). The ratio variables and the othervariables listed in Table 3 were developed after or taken fromvariables described by Ziemer (1981). The precipitation variables arethe ease data used in Ziemer's (1981) analysis of Caspar Creek.Data AnalysisDetermining Affects of Roadbuilding and Loggingon Three Hydrograph ParametersA least-squared multiple regress
hectare) coastal watershed in Northern California. Two watersheds, the North and South Fork of Caspar Creek were calibrated from 1962 to 1967 while no treatments took place. Roads were then built on the South Fork, and the two watersheds were monitored until 1971. Between 1971 and 1973 the South Fork was selectively tractor logged, removing 60