Transcription
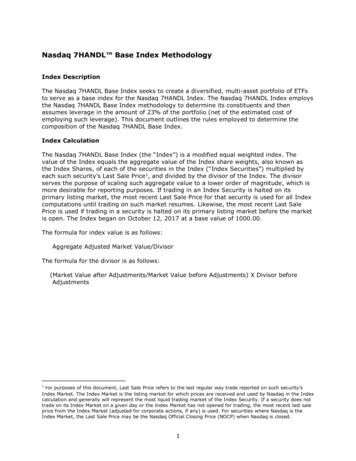
For Release: Wednesday, May 11, 2022MID-ATLANTIC INFORMATION OFFICE: Philadelphia, Pa.Technical information: (215) 597-3282 BLSInfoPhiladelphia@bls.govMedia contact:(215) 861-5600 regions/mid-atlanticConsumer Price Index, Northeast Region – April 2022Area prices were up 0.6 percent over the past month, up 7.2 percent from a year agoPrices in the Northeast Region, as measured by the Consumer Price Index for All Urban Consumers (CPI-U),advanced 0.6 percent in April, the U.S. Bureau of Labor Statistics reported today. (See table A.) RegionalCommissioner Alexandra Hall Bovee noted that the increase was the smallest in 2022, following a 1.3 percentrise in March. The all items less food and energy index was up 0.6 percent; the food index also increased inApril, up 1.0 percent; and the energy index inched up 0.1 percent. (Data in this report are not seasonallyadjusted. Accordingly, month-to-month changes may reflect the impact of seasonal influences.)Over the last 12 months, the Northeast all items CPI-U increased 7.2 percent about the same as in March (7.3percent). (See chart 1 and table A.) The all items less food and energy index was mostly responsible for theover-the-year increase, up 4.9 percent. The energy index jumped 33.2 percent over the year, as the price ofgasoline was 43.6 percent higher than the year before. The food index advanced 8.0 percent over-the-year.(See table 1.)
FoodFood prices rose 1.0 percent for the month of April. (See table 1.) Of the two major components within thefood index, prices for food at home increased 1.4 percent, while prices for food away from home were up 0.3percent for the same period. Within food at home, prices were higher for dairy and related products (3.3percent); meats, poultry, fish, and eggs (1.2 percent); and fruits and vegetables (1.4 percent).From April 2021 to April 2022, the food index increased 8.0 percent – the highest 12-month change since June1981. Prices for food at home advanced 9.3 percent since a year ago, the greatest such increase since April1981. Prices for food away from home increased 5.8 percent, continuing slight deceleration since January2022.EnergyThe energy index inched up 0.1 percent over the month, following a 11.2 percent increase in March. Gasolineprices decreased 2.5 percent, the largest gasoline price decrease in a year. Prices for electricity increased 2.1percent for the same period. The utility (piped) gas service index advanced 2.7 percent over the month, thelargest increase for the natural gas index since the start of 2022 but below the recent peak of 3.5 percent inNovember 2021.Energy prices soared 33.2 percent over the year, largely due to higher prices for gasoline (43.6 percent), whichwas the 15th consecutive month of increase, peaking at 57.1 percent in November. Prices for electricityadvanced 14.9 percent during the past year while fuel oil prices jumped 81.6 percent. Prices paid for utility(piped) gas service jumped 23.7 percent. The price increase for utility (piped) gas service represents the 16thmonth of consecutive price increases.2
All items less food and energyThe index for all items less food and energy rose 0.6 percent in April, it has ranged from 0.5 to 0.7 percent sofar in 2022. Higher prices for shelter (0.5 percent) - largely lodging away from home (up 7.7 percent) – as wellas higher prices for medical care (up 0.9 percent) and public transportation pushed the overall index up butthey were somewhat offset by decreases in apparel (3.6 percent) and education and communication (0.2percent). The new and used motor vehicles index was up 2.5 percent.Over the year, the index for all items less food and energy increased 4.9 percent after 2 consecutive months of5.0 percent increases. The 17.6 percent 12-month increase in the new and used motor vehicles index and the3.1 percent increase in the shelter index accounted for well over half of the increase in the all items less foodand energy index. The shelter increase was the largest over-the-year shelter increase since January 2017. Theincrease in shelter was led by gains in the indexes for owners’ equivalent rent of residences (2.8 percent) andhousehold operations and furnishings, up 9.3 percent - the largest increase in over 41 years.Table A. Northeast region CPI-U 1-month and 12-month percent changes, all items index, not seasonallyadjusted2018Month1-monthJanuary.February .March .April .May.June.July .August month12month0.80.71.30.66.36.67.37.2Geographic divisionsAdditional price indexes are now available for the two divisions of the Northeast. Over the month, the allitems CPI-U was 0.1 percent higher in the New England division, while prices in the Middle Atlantic divisionrose 0.8 percent.Over the year, the all items index rose 7.0 percent in the New England division and also rose in the MiddleAtlantic division, up 7.2 percent. (See table B.)Table B. CPI-U 1-month and 12-month percent changes, all items index, Northeast region and divisions, notseasonally adjustedArea1-month changeNortheast.New England Division .Middle Atlantic Division.12-month change0.60.10.8The Consumer Price Index for May 2022 is scheduled to be released on Friday, June 10, 2022, at 8:30a.m. (ET).37.27.07.2
Technical NoteThe Consumer Price Index (CPI) is a measure of the average change in prices over time in a fixed marketbasket of goods and services. The Bureau of Labor Statistics publishes CPIs for two population groups: (1) aCPI for All Urban Consumers (CPI-U) which covers approximately 93 percent of the total U.S. population and(2) a CPI for Urban Wage Earners and Clerical Workers (CPI-W) which covers approximately 29 percent ofthe total U.S. population. The CPI-U includes, in addition to wage earners and clerical workers, groups such asprofessional, managerial, and technical workers, the self-employed, short-term workers, the unemployed, andretirees and others not in the labor force.The CPI is based on prices of food, clothing, shelter, and fuels, transportation fares, charges for doctors' anddentists' services, drugs, and the other goods and services that people buy for day-to-day living. Each month,prices are collected in 75 urban areas across the country from about 6,000 housing units and approximately22,000 retail establishments—department stores, supermarkets, hospitals, filling stations, and other types ofstores and service establishments. All taxes directly associated with the purchase and use of items are includedin the index.The index measures price changes from a designated reference date; for most of the CPI-U the reference baseis 1982-84 equals 100. An increase of 7 percent from the reference base, for example, is shown as 107.000.Alternatively, that relationship can also be expressed as the price of a base period market basket of goods andservices rising from 100 to 107. For further details see the CPI home page on the Internet at www.bls.gov/cpi and the CPI section of the BLS Handbook of Methods available on the internet at www.bls.gov/opub/hom/cpi/.In calculating the index, price changes for the various items in each location are averaged together withweights that represent their importance in the spending of the appropriate population group. Local data arethen combined to obtain a U.S. city average. Because the sample size of a local area is smaller, the local areaindex is subject to substantially more sampling and other measurement error than the national index. Inaddition, local indexes are not adjusted for seasonal influences. As a result, local area indexes show greatervolatility than the national index, although their long-term trends are quite similar. NOTE: Area indexes donot measure differences in the level of prices between cities; they only measure the average change inprices for each area since the base period.The Northeast region is comprised of Connecticut, Maine, Massachusetts, New Hampshire, New Jersey, NewYork, Pennsylvania, Rhode Island, and Vermont.The New England division is comprised of Connecticut, Maine, Massachusetts, New Hampshire, RhodeIsland, and Vermont.The Middle Atlantic division is comprised of New Jersey, New York, and Pennsylvania.Information in this release will be made available to individuals with sensory impairments upon request. Voicephone: (202) 691-5200; Telecommunications Relay Service: 7-1-1.4
Table 1. Consumer Price Index for All Urban Consumers (CPI-U): Indexes and percent changes for selectedperiods, Northeast Region, (1982-84 100 unless otherwise noted) (not seasonally adjusted)IndexesExpenditure categoryHistoricaldataFeb.2022Percent change fromMar.2022Apr.2022All items .294.605298.403300.325All items (December 1977 100).463.912469.894472.920Food and beverages .295.233297.203Food .296.880Food at home .280.327Cereals and bakery products 363335.526340.4169.82.11.5Meats, poultry, fish, and eggs.296.569297.267300.95310.91.51.2Dairy and related products .252.336253.603262.07010.83.93.3Fruits and vegetables .342.776345.908350.6387.42.31.4Nonalcoholic beverages andbeverage materials.192.892192.256195.0448.01.11.5Other food at home .246.557252.079253.6009.02.90.6Food away from home.324.347325.521326.6495.80.70.3Alcoholic beverages .272.179273.704275.0624.11.10.5Housing .310.168313.196315.3715.61.70.7Shelter .379.166380.887382.6403.10.90.5Rent of primary residence 732.80.40.2393.266394.084395.0282.80.40.2Fuels and utilities.266.556279.655285.46721.37.12.1Household energy .237.801251.512257.47325.08.32.4Energy y .225.379235.572240.54314.96.72.1Utility (piped) gas service .219.240219.386225.20323.72.72.7Household furnishings and operations .136.146137.074138.2929.31.60.9Apparel .130.827134.447129.6573.0-0.9-3.6Transportation .243.040252.063255.69518.25.21.4Private transportation .242.462251.301253.53519.44.60.9New and used motor vehicles(2).122.080121.692124.79217.62.22.5New vehicles .164.588163.078164.49211.5-0.10.9New cars and trucks(2)(3) .114.105113.060Owners' equivalent rent ofresidences(1).Owners' equivalent rent of primaryresidence(1) .New cars(3) .155.361154.520156.48713.20.71.3Used cars and trucks.223.773219.614217.98823.8-2.6-0.7Motor fuel .302.827357.632348.98043.715.2-2.4Gasoline (all types).301.617356.041347.21943.615.1-2.5Gasoline, unleaded ne, unleaded soline, unleaded premium(3) .304.471355.314350.88339.415.2-1.2Medical care .559.364563.166568.4723.31.60.9Medical care commodities.381.715383.644386.3222.01.20.7Medical care l services 69135.923136.3695.00.90.3Education and otor vehicle insurance(5) .Note: See footnotes at end of table.5
Table 1. Consumer Price Index for All Urban Consumers (CPI-U): Indexes and percent changes for selectedperiods, Northeast Region, (1982-84 100 unless otherwise noted) (not seasonally adjusted) - ContinuedIndexesExpenditure categoryHistoricaldataFeb.2022Percent change n, other school fees, and childcare(5) .1,342.4061,342.2341,342.6342.40.00.0Other goods and services .546.304552.074552.5185.71.10.1Commodities .218.530223.384223.37012.12.20.0Commodities less food and beverages .176.494182.158181.05815.22.6-0.6Nondurables less food and beverages.221.564236.826234.08317.25.7-1.2Durables 70.184374.0444.51.81.0All items less shelter.265.539270.076272.0619.32.50.7All items less medical care .282.949286.740288.5177.52.00.6Commodities less food .180.192185.784184.74214.72.5-0.6Nondurables .258.094266.941266.90611.93.40.0Nondurables less food.224.476238.860236.37616.25.3-1.0Services less rent of shelter(1).367.351371.135377.4236.02.71.7Services less medical care services.350.704353.256356.9604.61.81.0Energy .264.302293.911294.28533.211.30.1All items less energy .301.134302.683304.7685.41.20.7All items less food and energy .303.806305.285307.2284.91.10.6Commodity and service groupSpecial aggregate indexesFootnotes(1) Indexes on a December 1982 100 base.(2) Indexes on a December 1997 100 base.(3) Special index based on a substantially smaller sample.(4) Indexes on a December 1993 100 base.(5) Indexes on a December 1977 100 base.6
Consumer Price Index, Northeast Region - April 2022 Area prices were up 0.6 percent over the past month, up 7.2 percent from a year ago Prices in the Northeast Region, as measured by the Consumer Price Index for All Urban Consumers (CPI-U), advanced 0.6 percent in April, the U.S. Bureau of Labor Statistics reported today. (See table A.) Regional