Transcription
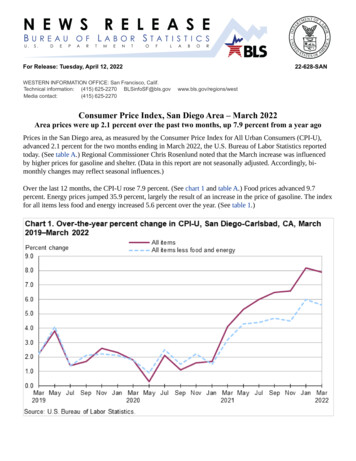
For Release: Tuesday, April 12, 2022WESTERN INFORMATION OFFICE: San Francisco, Calif.Technical information: (415) 625-2270 BLSinfoSF@bls.govMedia contact:(415) 625-227022-628-SANwww.bls.gov/regions/westConsumer Price Index, San Diego Area – March 2022Area prices were up 2.1 percent over the past two months, up 7.9 percent from a year agoPrices in the San Diego area, as measured by the Consumer Price Index for All Urban Consumers (CPI-U),advanced 2.1 percent for the two months ending in March 2022, the U.S. Bureau of Labor Statistics reportedtoday. (See table A.) Regional Commissioner Chris Rosenlund noted that the March increase was influencedby higher prices for gasoline and shelter. (Data in this report are not seasonally adjusted. Accordingly, bimonthly changes may reflect seasonal influences.)Over the last 12 months, the CPI-U rose 7.9 percent. (See chart 1 and table A.) Food prices advanced 9.7percent. Energy prices jumped 35.9 percent, largely the result of an increase in the price of gasoline. The indexfor all items less food and energy increased 5.6 percent over the year. (See table 1.)
FoodFood prices increased 1.1 percent for the two months ending in March. (See table 1.) Prices for food at homeincreased 3.3 percent led by higher prices for dairy and related products (9.1 percent). Prices for food awayfrom home decreased 1.5 percent for the same period.Over the year, food prices advanced 9.7 percent. Prices for food at home jumped 10.0 percent since a year agoinfluenced by higher prices for cereals and bakery products (14.2 percent). Prices for food away from homeadvanced 9.3 percent.EnergyThe energy index jumped 12.9 percent for the two months ending in March. The increase was mainly due tohigher prices for gasoline (23.6 percent). Prices for electricity were unchanged, while prices for natural gasservice fell 11.9 percent for the same period.Energy prices jumped 35.9 percent over the year, largely due to higher prices for gasoline (46.4 percent).Prices paid for electricity advanced 20.9 percent, and prices for natural gas service rose 12.3 percent duringthe past year.All items less food and energyThe index for all items less food and energy rose 1.4 percent in the latest two-month period. Higher prices forrecreation (4.5 percent), household furnishings and operations (2.5 percent), and shelter (1.1 percent) werepartially offset by lower prices for apparel (-5.1 percent) and education and communication (-0.4 percent).Over the year, the index for all items less food and energy increased 5.6 percent. Components contributing tothe increase included used cars and trucks (33.8 percent), recreation (8.1 percent), and shelter (5.7 percent).Table A. San Diego-Carlsbad, CA, CPI-U 2-month and 12-month percent changes, all items index, notseasonally adjustedMonthJanuary.March .May.July 2-month2.02.18.27.9The May 2022 Consumer Price Index for the San Diego area is scheduled to be released on June 10,2022.Technical NoteThe Consumer Price Index (CPI) is a measures of the average change in prices over time in a fixed marketbasket of goods and services. The Bureau of Labor Statistics publishes CPIs for two population groups: (1) aCPI for All Urban Consumers (CPI-U) which covers approximately 93 percent of the total U.S. population and(2) a CPI for Urban Wage Earners and Clerical Workers (CPI-W) which covers approximately 29 percent of2
the total U.S. population. The CPI-U includes, in addition to wage earners and clerical workers, groups such asprofessional, managerial, and technical workers, the self-employed, short-term workers, the unemployed, andretirees and others not in the labor force.The CPI is based on prices of food, clothing, shelter, and fuels, transportation fares, charges for doctors' anddentists' services, drugs, and the other goods and services that people buy for day-to-day living. Each month,prices are collected in 75 urban areas across the country from about 6,000 housing units and approximately22,000 retail establishments—department stores, supermarkets, hospitals, filling stations, and other types ofstores and service establishments. All taxes directly associated with the purchase and use of items are includedin the index.The index measures price changes from a designated reference date; for most of the CPI-U the reference baseis 1982-84 equals 100. An increase of 7 percent from the reference base, for example, is shown as 107.000.Alternatively, that relationship can also be expressed as the price of a base period market basket of goods andservices rising from 100 to 107. For further details see the CPI home page on the Internet at www.bls.gov/cpi and the CPI section of the BLS Handbook of Methods available on the internet at www.bls.gov/opub/hom/cpi/.In calculating the index, price changes for the various items in each location are averaged together withweights that represent their importance in the spending of the appropriate population group. Local data arethen combined to obtain a U.S. city average. Because the sample size of a local area is smaller, the local areaindex is subject to substantially more sampling and other measurement error than the national index. Inaddition, local indexes are not adjusted for seasonal influences. As a result, local area indexes show greatervolatility than the national index, although their long-term trends are quite similar. NOTE: Area indexes donot measure differences in the level of prices between cities; they only measure the average change inprices for each area since the base period.The San Diego-Carlsbad, CA metropolitan area includes San Diego County in California.Information in this release will be made available to sensory impaired individuals upon request. Voice phone:(202) 691-5200; Federal Relay Service: (800) 877-8339.3
Table 1. Consumer Price Index for All Urban Consumers (CPI-U): Indexes and percent changes for selectedperiods San Diego-Carlsbad (1982-84 100 unless otherwise noted)Item and GroupIndexesHistoricaldataJan.2022Percent change iture categoryAll items .332.990-339.8527.92.1-All items (1967 100) .1,125.942-1,149.144---Food and beverages .300.803-304.3989.11.2-Food .299.586-302.7589.71.1-Food at home .258.043261.146266.66010.03.32.1Cereals and bakery products .304.170-321.33114.25.6-Meats, poultry, fish, and eggs.281.539-280.3006.7-0.4-Dairy and related products .190.294-207.5249.79.1-Fruits and vegetables .278.612-287.8949.43.3-Nonalcoholic beverages andbeverage materials(1) .293.836-297.6469.31.3-Other food at home .238.258-248.69011.04.4-Food away from home.355.765-350.2559.3-1.5-Alcoholic beverages .302.434-310.4683.62.7-Housing .388.707-392.8446.21.1-Shelter .436.746440.520441.6815.71.10.3Rent of primary residence(2).431.709433.414435.3885.00.90.5Owners' equiv. rent of residences(2) .461.762463.295464.3504.60.60.2Owners' equiv. rent of primaryresidence(2) .461.762463.295464.3504.60.60.2Fuels and utilities.449.347-442.87914.5-1.4-Household energy .451.519441.479440.42719.2-2.5-0.2Energy ity .434.562434.562434.56220.90.00.0Utility (piped) gas service .341.219307.536300.57612.3-11.9-2.3Household furnishings and operations .200.147-205.1814.32.5-Apparel .176.236-167.1622.2-5.1-Transportation .274.672-295.25118.97.5-Private transportation .272.627-290.37222.26.5-New and used motor vehicles(3).132.950-134.80018.21.4-New vehicles(1).247.010-246.9331.10.0-Used cars and trucks(1) .342.618-340.47833.8-0.6-Motor fuel .367.249375.087454.33046.623.721.1Gasoline (all types).366.923374.659453.54746.423.621.1Gasoline, unleaded ne, unleaded soline, unleaded premium(4) .373.643380.926457.92043.622.620.2Medical care 898.14.5-Education and communication(3).140.022-139.3942.7-0.4-Tuition, other school fees, and childcare(1) .1,608.239-1,608.4483.50.0-Other goods and services .452.146-454.0153.00.4-All items .332.990-339.8527.92.1-Commodities .234.316-240.74012.22.7-Commodities less food & beverages.199.412-206.86114.73.7-Nondurables less food & beverages .234.789-251.50317.77.1-Durables .41.7-Commodity and service groupNote: See footnotes at end of table.4
Table 1. Consumer Price Index for All Urban Consumers (CPI-U): Indexes and percent changes for selectedperiods San Diego-Carlsbad (1982-84 100 unless otherwise noted) - ContinuedItem and GroupIndexesHistoricaldataJan.2022Percent change l aggregate indexesAll items less medical care .323.801-330.6778.42.1-All items less shelter.291.702-299.3799.22.6-Commodities less food .204.030-211.53713.83.7-Nondurables .269.193-279.61312.83.9-Nondurables less food.241.343-257.51016.06.7-Services less rent of shelter(2).419.044-429.4845.42.5-Services less medical care services.405.709-412.5535.81.7-Energy .392.716394.056443.55835.912.912.6All items less energy .332.549-337.0076.21.3-All items less food and energy .339.586-344.2885.61.4-Footnotes(1) Indexes on a November 1977 100 base.(2) Indexes on a November 1982 100 base.(3) Indexes on a December 1997 100 base.(4) Special index based on a substantially smaller sample.(5) Indexes on a December 1993 100 base.- Data not availableNOTE: Index applies to a month as a whole, not to any specific date.5
Consumer Price Index, San Diego Area - March 2022 Area prices were up 2.1 percent over the past two months, up 7.9 percent from a year ago Prices in the San Diego area, as measured by the Consumer Price Index for All Urban Consumers (CPI-U), advanced 2.1 percent for the two months ending in March 2022, the U.S. Bureau of Labor Statistics reported