Transcription
Experimental investigation into the effects of diesel dilutionon engine lubricationAbstractThe dilution of lubricant due to contamination with diesel fuel is an increasingly prevalent, potentially importantand poorly understood issue. This study addresses two fundamental questions: 1) How does the change in lubricantrheology due to diesel dilution affect engine lubrication? 2) How is the chemical performance of lubricantcomponents (base oil and performance additives) impacted by diesel dilution under different lubrication regimes(boundary/full film, hydrodynamic/elastohydrodynamic). This is achieved by testing three lubricant samples: 1)neat fully formulated 0W-30 engine oil, 2) fully formulated 0W-30 oil diluted with diesel at a concentration of15%, denoted “0W-30D”, and 3) neat, fully-formulated 0W-16, with the same base oil components andperformance additives as the 0W-30, but blended to give a viscosity equal to that of the diluted an equivalent“0W-30D”. Tribometer tests, including 1) low pressure, low shear viscosity, 2) Ultra-high Shear Viscosity (USV),3) elastohydrodynamic film thickness, 4) Stribeck friction and 5) boundary friction and wear, are then conducted.To further emulate engine lubrication conditions, Stribeck curve measurements are performed on the threelubricants using a journal bearing test rig, fitted with a connecting-rod and commercial diesel engine shells.Results suggest that diesel dilution only slightly affects chemical additive performance (with friction modifiersbeing more inhibited than anti-wear additives) but does reduce both viscosity and film thickness. However, caremust be taken in using viscometrics to predict dilution behaviour because 1) the pressure viscosity coefficient isalso affected by diesel dilution which has implications for elastohydrodynamically lubrication contacts, 2) shearthinning means that viscosity modifier additives effects lose their functions at high shear rates; whereas dieselcontamination affects viscosity behaviour throughout the whole shear rate range.Keywords: diesel dilution, viscosity, journal bearings, friction, film thickness, hydrodynamic lubrication, shearthinning.1
AbbreviationEHDElastohydrodynamicHFRRHigh Frequency Reciprocating RigJBMJournal Bearing MachineMTMMini Traction MachineRTDResistance Temperature DetectorSRRSlide/Roll Ratio (in a ball-on-disc contact in the UTFI and MTM tests)USVUltra Shear ViscometerUTFIUltra-Thin Film InterferometryVMViscosity-ModifierZDDPZinc dialkyldithiophosphateSymbol𝐴′EHD central film thickness at the entrainment speed of 1000 mm/s (nm)𝐶Walter constant in Walther mixing rule (cSt)𝐸′Reduced Young’s modulus of the interacting solids in Dowson and Hamrock equation (N/m2)𝐹Steady-state load applied on the connecting-rod in the JBM (N)𝑓Friction force between the bearing shells and the main shaft in the JBM (N)ℎ𝑐Central film thickness under the EHD lubrication (nm)𝑘Geometry-related constant of elliptical contact area in Dowson and Hamrock equation (-)𝑇ℎ𝑒𝑎𝑡𝑒𝑟Temperature of the heater in the JBM ( C)𝑇𝑗𝑜𝑢𝑟𝑛𝑎𝑙Temperature of the journal bearing shells in the JBM ( C)𝑇𝑙𝑢𝑏𝑒Temperature of the inlet oil in the JBM ( C)𝑅′Reduced radius of the interacting solids in Dowson and Hamrock equation (m)𝑈Entrainment speed in a ball-on-disc contact (m/s, in the UTFI and MTM tests)𝑈1Speed of the ball in a ball-on-disc contact (m/s, in the UTFI and MTM tests)𝑈2Speed of the disc in a ball-on-disc contact (m/s, in the UTFI and MTM tests)𝑊Applied load in a ball-on-disc contact (N)𝑥Volume fraction of lubricant in Walther mixing rule (%)2
𝛼Pressure viscosity coefficient (GPa-1)𝛾̇Shear rate of a lubricant (s-1)𝜔Speed of the journal shaft in the JBM (rpm)𝜂Dynamic viscosity of lubricant specimens (cP)𝜂𝑜Dynamic viscosity of lubricant specimens at atmosphere pressure (cP)𝜂0First Newtonian viscosity of lubricant specimens (cP)𝜂 Second Newtonian viscosity of lubricant specimens (cP)𝜈Kinematic viscosity of lubricant specimens (cSt)3
1. IntroductionFuel dilution (or crankcase dilution) refers to the phenomenon in which excessive and unburned engine fuel(diesel or gasoline) leaks into the crankcase and mixes with the engine lubricant [1]-[3]. Hydrocarbon-basedengine fuel normally has lower viscosity than engine oil. This means that dilution may be beneficial in terms ofengine efficiency due to lower viscous losses [4]-[5], but will also result in thinner oil films, increased surfacecontact between engine components (e.g. journal bearing shells/crankshaft, piston/liner), and this may lead toincreased wear and even higher friction. Moreover, high temperatures and high pressures may facilitate chemicalinteraction between the fuel and the lubricant performance additives (e.g., viscosity-modifier (VM) and anti-wearadditives of zinc dialkyldithiophosphate (ZDDP) [6]), and could further affect lubrication characteristics.Recent research in this area has focused on approaches to reduce fuel dilution and detect/monitor/quantifyfuel dilution, and characterize the effect of different fuels [7]-[12]. For instance, high-frequency reciprocatingtests, together with modelling have suggested that the presence of fuel in the cylinder liner contacts facilitates atransition from full-film, hydrodynamic lubrication to the undesirable boundary conditions due to reduced oil filmthickness [9]. Tribometer testing of fuel diluted lubricants has also been combined with analytical ferrography toenable microscopic evaluation of wear debris [13]-[14]. More recently, biodiesel Fatty Acid Methyl Ester (FAME),has attracted attention as renewable and sustainable energy source, and its dilution of engine oil has been studiedexperimentally. Biodiesel is less volatile than other fuels and therefore its dilution effects are likely to morepersistent under running engine conditions. This in contrast for instance to ethanol, which inhibits ZDDP filmformation at low temperature but evaporates at 100ºC and has minimal tribological impact [15]. Four-ball andhigh frequency reciprocating testing has suggested that fresh biodiesel decreases friction forces in engine bearingshells, while aged-biodiesel degradation results in a chemical interaction with lubricant performance additives(mainly with the ZDDP) and leads to increased wear [15]. Furthermore, pin-on-disc tests quantifying wear underbiodiesel-diluted lubrication conditions show that animal fat-based biodiesel can somewhat relieve the dilutioneffect, as compared to vegetable feedstock biodiesel [17]. Finally, the oxidation of biodiesel dilution in enginelubrication oil can increase deposits and accelerates corrosion, as indicated in [18].A comprehensive understanding of the fuel dilution effect on lubrication performance is meaningfulespecially for car manufacturers, in terms of lubricant development and engine efficiency improvement. Twofundamental questions are proposed in the current study: 1) How do rheological changes due to fuel dilution effectengine lubrication? 2) How does diesel dilution effect the chemical performance of different lubricant components(base oil, and additives) under different lubrication regimes (boundary/hydrodynamic)? To address these, a4
thorough experimental investigation is performed including a case study of diesel dilution in an engine journalbearing contact. Three lubricant samples are selected and tested: 1) neat, fully formulated 0W-30 engine oil, 2)fully formulated 0W-30 oil diluted with diesel at a concentration of 15%, denoted “0W-30D”, and 3) neat, fullyformulated 0W-16, with the same base oil components and performance additives as the 0W-30, but blended togive a viscosity equal to that of the diluted equivalent “0W-30D”. A series of tribometer tests, including StabingerViscometer, Ultra Shear Viscosity (USV), Ultra-Thin Film Interferometry (UTFI), Mini Traction Machine (MTM)and High Frequency Reciprocating Rig (HFRR), are performed to assess both rheological and tribologicalbehaviour. Moreover, to emulate the journal bearing lubrication as operated in a real vehicle engine, a connectingrod assembly from a diesel engine is modified to fit with a Journal Bearing Machine (JBM), and the Stribeckcurve tests on the three lubricant samples are compared over a range of conditions.This paper assesses the effects of diesel dilution on: 1) lubricant rheology in terms of viscosity and filmthickness, considering both shear rate and pressure dependence – the latter being achieved by characterizingviscosity-pressure coefficients using a careful method compensating for physical uncertainties in contactgeometries and material parameters, 2) chemical additive performance 3) automotive journal bearing frictionunder different regimes (boundary/mixed/hydrodynamic). This combined approach is necessary as overall engineefficiency depends on both the tribological and rheological [2] performance of a lubricant in various contactsoperating under different regimes [3].2. Lubricant SelectionTo study the effect of fuel dilution on lubrication behaviour, three different lubricant samples are blended, asfollows. Neat Shell Helix 0W-30 Ultra Professional AJ-L (denoted “0W-30” in the present work), whichcomprises base oil (Shell Risella X 420, a hydrocarbon fluid based on Shell Gas-to-Liquid technology)and performance additives (viscosity modifiers, anti-wear additives and so on), is a representative fullyformulated lubricant and widely used in gasoline, diesel and gas engines. “0W-30” (as above), blended with diesel at a concentration of 15% by volume (denoted “0W-30D” inthe present work). A research blend lubricant of “0W-16” (denoted “0W-16” in the present work), which has the samecomposition of base oil and performance additives as “0W-30”, but contains a lower concentration of5
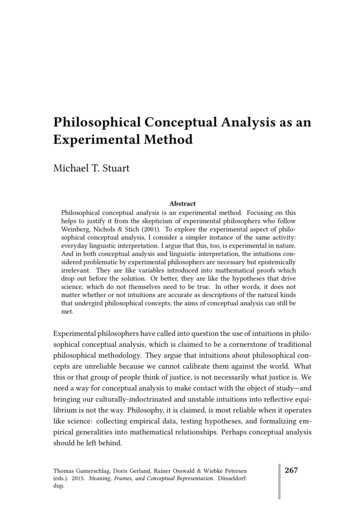
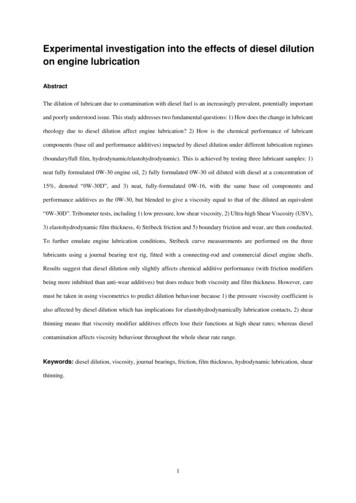
viscosity modifier additive so as to give low pressure/low shear viscosity equal to that of the diesel dilutedlubricant (“0W-30D”).Comparisons between test results from “0W-30D” and “0W-30” are intended to show the effects of fueldilution on the lubrication performance, while test results from “0W-16” are intended to reveal whether the causesof discrepancies between “0W-30” and “0W-30D” are rheological or chemical in nature.3. Tribometer ExperimentsThe three lubricants described above are characterized through a series of tests, as follows: 1) Lowpressure/low shear viscosity, measured using Stabinger viscometer in order not only to quantify viscositydifferences between the diluted and undiluted lubricants at low shear rate conditions, but also confirm that “0W16” is correctly blended to have a viscosity equal to the diluted one; 2) High shear rate viscosity, measured usingUltra Shear Viscometer (USV), to characterize shear thinning behaviour; 3) Elastohydrodynamic (EHD) filmthickness, measured using Ultra-Thin Film Interferometry (UTFI), to characterize pressure-viscosity coefficients;4) EHD friction, measured using Mini Traction Machine (MTM), to characterize boundary, mixed friction andfull film traction; and 5) boundary friction and wear volume, measured using High Frequency Reciprocating Rig(HFRR), to quantify tribological behaviour under harsh rubbing conditions.Further details about these well-established measurement techniques can be found in [25], [26], [33] and [35].3.1 Stabinger ViscometerStabinger viscometer measurement results of three lubricant, as well as the diesel, at low shear rate (10-100s 1) are listed in Table I in the Appendix and plotted in Figure 1, where each sample has been tested with thetemperature swept from 20 C to 100 C. This shows that diesel dilution substantially reduces the viscosity of 0W30, and also confirms that 0W-16 is correctly blended to a viscosity close to that of the diluted sample (0W-30D).The viscosity measurements have been linearly fitted with the Walther formula [36], written as:log10 (log10 (𝜈 0.7)) 𝐴 𝐵 log10 (𝑇)(1)where 𝜈 (cSt) is the kinematic viscosity, 𝑇 (K) is the temperature, and 𝐴 ( [8.23, 8.61, 9.14], for 0W-30, 0W30D and 0W-16 respectively) and 𝐵 ( [3.21, 3.39, 3.60], for 0W-30, 0W-30D and 0W-16 respectively) areconstants. It should be noted that the constant 𝐵 changes by only 5.45% when the 0W-30 is diluted (confirmed bythe lines of the graph being approximately parallel), which shows that diesel dilution does not greatly affect thetemperature dependence of the viscosity.6
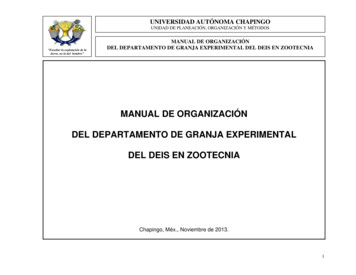
The expected kinematic viscosity of the diluted sample (0W-30D) can be also calculated by followingWalther mixing rule as [36]-[37]:log10 (log10 (𝜈0𝑊30𝐷 𝐶)) 𝑥𝐴 log10 (log10 (𝜈𝑑𝑖𝑒𝑠𝑒𝑙 𝐶)) 𝑥𝐵 log10 (log10 (𝜈0𝑊30 𝐶))(2)where 𝑥𝐴 ( 0.15) and 𝑥𝐵 ( 0.85) are the volume fractions of the diesel and 0W-30 respectively, and 𝐶 ( 0.7) isWalther constant obtained via regression analysis. The predicted results, plotted as “0W-30D (Walther Mixing)”in Figure 1-(a), are in a good agreement with the Stabinger measured results. Moreover, Figure 1-(b) employsequation (2) again to essentially show how different concentrations of diesel affect the viscosity of the enginelubricant.Figure 1: (a) Measurement results with the Stabinger Viscometer: kinematic viscosity (𝜈, cSt) against the temperature (𝑇, K)for the three selected lubricant samples as well as the base oil and the diesel. “0W-30D (Walther Mixing)” denotes the predictedkinematic viscosity of 0W-30D by following Walther Mixing rule in equation (2); (b) predicted kinematic viscosity of 0W-30with different concentrations of diesel using Walther Mixing rule in equation (2).3.2 Ultra-High Shear Viscosity MeasurementsThe Ultra Shear Viscometer (USV) from PCS Instruments [25], enables viscosity measurements at shear ratesup to 107 s 1, without incurring significant shear heating and is commonly used to investigate shear thinningbehaviour, e.g., due to viscosity modifiers [20], [21].The USV test results with the selected lubricant samples are shown in Figure 2, where the Carreau–Yasudaequation [19] is further employed to fit the viscosity versus shear rate at a given temperature:𝑛 1𝑎𝜂 𝜂 (𝜂0 𝜂 )(1 (𝐴𝛾̇ )𝑎 )7(3)
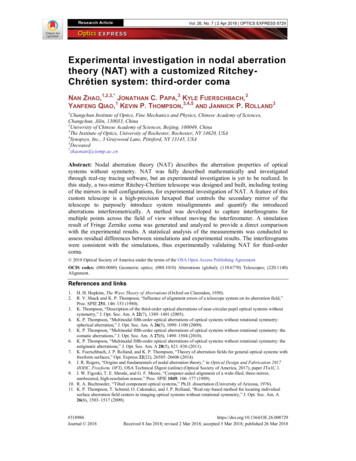
where 𝜂 is the dynamic viscosity of the lubricant at the shear rate of 𝛾̇ , 𝜂0 is the first Newtonian viscosity, 𝜂 isthe second Newtonian viscosity, while 𝐴, 𝑎 and 𝑛 [0.2, 0.9] are constants and are obtained through Matlabfunction nlinfit, as listed in Table II in the Appendix. The value of 𝜂 is normally close to the viscosity of thepolymer-free formulation (the base oil). At 40 C, the viscosity curves of 0W-30 and 0W-16 collapse into thehorizontal line of the base oil at high shear rate (i.e. shear thinning has negated the effect of the viscosity modifier).By contrast, the viscosity of 0W-30D at high shear rate is the lowest, as it is determined jointly by both the baseoil and the diesel, that is: 𝜂 (0W-30) 𝜂 (0W-16) 𝜂 (0W-30D), and 𝜂0 (0W-30) 𝜂0 (0W-16) 𝜂0 (0W-30D).Figure 2: USV test results (markers) and equation fitting results (lines) for three lubricant samples as well as the base oil andthe diesel: the variation of dynamic viscosity (cP) against shear rate (s-1) at 40 C (a) and 100 C (b) respectively.3.3 EHD Film Thickness MeasurementsUltra-Thin Film Interferometry (UTFI) is used to measure film thickness of lubricants underelastohydrodynamic (EHD) using optical interferometry. Here, a steel ball (the diameter of which is 19.05 mm)is loaded against a rotating glass disc, coated with a semi-reflective layer of chromium and silica [26]. The UTFIhas an applicable measurement range of the oil film thickness within 1-1000 nm, with a load varying from 0 to50 N, a contact pressure up to 0.7 GP.UTFI tests with “0W-30”, “0W-30D” and “0W-16” are performed at four different temperatures (40 C, 60 C,80 C and 100 C), a constant applied load of 20 N, a varied entrainment speed of 𝑈 [4, 3000] mm/s (theentrainment speed is defined as 𝑈 𝑈1 𝑈22, where 𝑈1 (mm/s) and 𝑈2 (mm/s) are the speed of the ball and the discrespectively), and under pure rolling condition (i.e., 𝑈1 𝑈2 , as the ball in the present test is not driven by theactuation shaft in the UTFI). The results of EHD central film thickness (ℎ𝑐 ) against entrainment speed (𝑈) are8
shown in Figure 3, where it can be seen the film thickness of “0W-30” and “0W-16” have similar values, both ofwhich are greater than that of the diluted lubricant.Figure 3: UTFI test results with three lubricant samples: the variation of the central film thickness (ℎ𝑐 ) against the entrainmentspeed (𝑈). (Note: the log scale underplays the differences between the samples at film thicknesses 1nm).To further understand the discrepancy in EHD film thickness (ℎ𝑐 ) between the diluted and undilutedlubricants, Dowson and Hamrock equation, proposed in [27] and given as below, is employed:ℎ𝑐 𝑘𝑅′ (𝑈𝜂𝑜 0.68𝑊 0.067(𝛼𝐸 ′ )0.53 ( ′ ′2 )) 𝑘 ′ (𝑈𝜂𝑜 )0.68 𝛼 0.53′′𝐸𝑅𝐸𝑅(4)where 𝑘 is determined by the geometry of elliptical contact area, 𝐸 ′ and 𝑅′ are the reduced Young’s modulus andreduced radius of the interacting solids, 𝑊 is the applied load, 𝑈 is the entrainment speed of ball-on-disc contact,𝜂𝑜 is the dynamic viscosity at atmosphere pressure, and 𝛼 is the pressure viscosity coefficient. It is worth notingthat Dowson and Hamrock equation is normally applied to Newtonian fluids with constant values of viscosity,while accurate EHD film thickness distribution of non-Newtonian fluids requires a much more complex numericalsolution with exact profiles of shear stress - shear rate incorporated [28]-[30]. With respect to the present EHDtests of non-Newtonian fluids under pure-rolling condition, second Newtonian viscosity (𝜂 ) is used instead in9
Dowson and Hamrock equation to simplify the film thickness prediction meanwhile to minimize the calculationerrors of the viscosity pressure coefficients (𝛼) [31].Since three lubricant samples are tested under the same test conditions, the conventional Dowson andHamrock equation can be further simplified as equation (4)-right side, with these lubricant-independentparameters collapsed into the constant, 𝑘 ′ . This equation indicates the oil film variation is caused by both thelubricant viscosity 𝜂𝑜 and the pressure viscosity coefficient 𝛼. 𝜂𝑜 has been replaced by the second Newtonianviscosity (i.e., 𝜂 , the high shear rate viscosity as measured by the USV in Section 3.2) as discussed above, whilethe unknown parameters 𝛼 can be accurately estimated as follows.Firstly, a reference lubricant with known viscosity (𝜂𝑜𝑟𝑒𝑓 ) with known pressure viscosity coefficient (𝛼𝑟𝑒𝑓 )needs to be introduced and measured by the UTFI, again under exactly the same test conditions. The lubricantindependent constant, 𝑘 ′ , which has significant uncertainties and may be inaccurately estimated, can be cancelled:ℎ𝑐ℎ𝑐𝑟𝑒𝑓 �𝑓0.53)𝑦𝑖𝑒𝑙𝑑𝑠 𝛼 𝛼𝑟𝑒𝑓 𝑒𝑓 0.53()ℎ𝑐(5)where ℎ𝑐𝑟𝑒𝑓 is EHD central film thickness of the reference lubricant.The measured data of both reference lubricant and the test samples, (𝑈, ℎ𝑐 ), can fit a linear equation withrespect to log10 𝑈:𝑦𝑖𝑒𝑙𝑑𝑠ℎ𝑐 𝐴′ 𝑈 0.68 (6)log10 ℎ𝑐 log10 𝐴′ 0.68 log10 𝑈where the offset value of 𝐴′ can be approximated through Matlab function polyfit. It is worth noting that only themeasured data (𝑈, ℎ𝑐 ) that satisfies ℎ𝑐 10 nm are included here, despite the high measurement resolution of 1nm given by the UTFI. This is due to the root-mean-square roughness (𝑅𝑞 ) of the contact metal surface is around10 nm, and the thin-film lubrication ( 10 nm) is in a regime of lubrication where the lubricant still flows but thevalue of film thickness can no longer be predicted by the conventional EHL model [32]. Since the value of 𝐴′numerically equals ℎ𝑐 at the entrainment speed of 𝑈 1000 mm/s (i.e., 𝐴′ ℎ𝑐 (𝑈 1) ), equation (5) can befurther written as:𝛼 𝛼𝑟𝑒𝑓 �𝑟𝑒𝑓 (𝑈𝑟𝑒𝑓 1000) 0.53𝜂𝑜 0.53 𝐴′𝑟𝑒𝑓 0.53() 𝛼𝑟𝑒𝑓 ()( ′ )ℎ𝑐 (𝑈 1000)𝜂𝑟𝑒𝑓𝐴10(7)
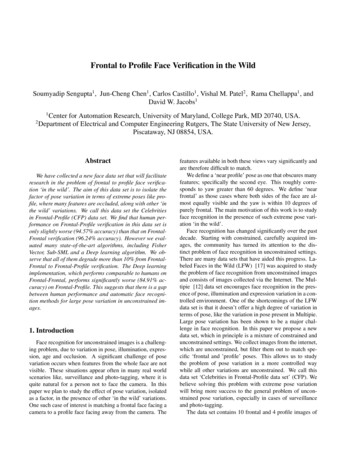
An example of linear fitting results with the UTFI measured data from the “0W-30” sample are displayed inFigure 4, and the calculation results of the pressure viscosity coefficients, 𝛼, of three lubricant samples are listedin Table III in the Appendix and compared in Figure 5. The film thickness ℎ𝑐 (0W-30) ℎ𝑐 (0W-16) ℎ𝑐 (0W30D) and the pressure viscosity coefficients 𝛼(0W-30) 𝛼(0W-16) 𝛼(0W-30D). This finding, that it is onlylow-pressure viscosity but also the pressure viscosity coefficient that it is reduced as a result of diesel dilution, islikely to be because the molecular structure of the diesel is less branched than that of the base oil. The predictedpressure-viscosity coefficient and its dependence on diesel dilution are highly important as they are necessary topredict the viscometric characteristics of engine lubricants at different contact pressure, leading to the estimationof the film thickness distribution, for example, in gears, rolling element bearings and camshafts.Ahc (U 1000 mm/s)AFigure 4 Linear fitting results of the UTFI measured data with the lubricant specimen “0W-30” (Note: the scatter in the dataappears greater at low speed, however this is a result of the log scale which magnifies the nanometre variations).Figure 5 Comparison of the pressure viscosity coefficients, α, between three lubricant samples.11
3.4 Stribeck Friction under EHD conditionsA Mini Traction Machine (MTM), is used to measure EHL, mixed and boundary friction from a contactbetween a steel ball (19.05 mm diameter) and a steel disc (46 mm diameter), as detailed in [33].Each lubricant sample is tested at four different temperatures (40 C, 60 C, 80 C and 100 C), the appliedload is a constant value of 30 N, the ratio of the sliding speed to the entrainment speed, known as slide/roll ratio(SRR), is fixed at 50%, and the entrainment speed, 𝑈, is swept from 10 mm/s to 3500 mm/s. The MTM test resultsare presented in Figure 6, which all show a transition from mixed to EHD lubrication regime, showing that the“0W-30” and “0W-16” samples show similar friction values. This is because the shear rate ( 109 s-1, as estimatedwith the shear stress (the contact stress of around 0.5 GPa multiplied by the measured friction coefficients of 0.20.4) divided by the dynamic viscosity measured in the USV in Section 3.2) is sufficiently high throughout theMTM tests to cause shear thinning so the film thickness enhancing effect of the VM in the “0W-30” is negated.It is also the case that the both oils have the same chemical composition (in terms of base oil and surface activeadditives) and are therefore have similar boundary friction behaviour as expected [34]. The higher friction for thediesel diluted sample “0W-30D” can be attributed to two factors: firstly, the lower viscosity of this sample reducesthe film thickness for a given entrainment speed and so increases the proportion of asperity contact in the mixedregime; on the other hand, the existence of diesel, which is a small size (around 1.8 nm) molecule with weakpolarity, hinders the formulated polymer additives from bonding and acting on the contacting surfaces.12
Figure 6: MTM test results with three lubricant specimens and their base oil: the variation of friction coefficients with respectto the entrainment speed (𝑈).3.5 High Frequency Reciprocating Rig (HFRR)The High Frequency Reciprocating Rig (HFRR) producing a ball-on-flat contact is used to perform highspeed, reciprocating friction and wear tests under harsh rubbing conditions as described in [35]. A camera andmicroscope are then used to capture calibrated images of a wear scar. The HFRR has been widely used to assessthe lubricity of diesel fuel [38] as well as the performance of surface additives (e.g., the anti-wear additive ZDDP).HFRR testing of “0W-30”, “0W-30D” and “0W-16” is performed under the conditions of 2 hour rubbingtime, 100 C temperature, 50 Hz reciprocating motion, and 400 g load. The test results are shown in Figure 7 andFigure 8, where it can be seen both the friction coefficients and wear volumes (quantified by wear scar dimensions)of three lubricant specimens are almost identical, while their base oil exhibits the highest values. This suggestsdiesel dilution only slightly affects the anti-wear performance of surface additives.13
Figure 7: HFRR test results with three lubricant samples and their base oil: the variation of friction coefficient with respect torubbing time.scar on ballDECBAscar on discFigure 8: HFRR test results with three lubricant samples and their base oil: (left) illustration of scar shapes in the ball and thedisc respectively; (right) scar dimensions at different locations.4. Journal Bearing Machine ExperimentsTo emulate lubrication conditions under a real crankshaft-journal bearing operating environment, in thissection, a connecting-rod assembly is modified to fit a journal bearing machine (JBM, which has been employedpreviously to experimentally study the effects of viscosity-modifiers (VMs) and laser surface texture on journalbearing lubrication [22], [23]), such that friction force measurements and comparison between different lubricantsamples can be realistic.14
4.1 Setup of Journal Bearing Machine (JBM)To fit the connecting-rod from a diesel engine into the JBM test rig, a hollow shaft sleeve is utilized and fixedonto the journal shaft through an interference fit, the out diameter of the shaft sleeve (the nominal dimension is55 mm) is designed to have a desirable dimension clearance (50 μm) that matches the target bearing shells, asshown in Figure 9-a). The connecting-rod is further modified by cutting its beam, such that the produced flatsection facilitates the connection of the load cell of the JMB, as shown in Figure 9-b).connecting-rodRTD sensor hole (upper)journal shaftωoil inletconnecting rodload cellstep motorF: journal loadshaft sleevelubricantbearing shellsa)b)Figure 9: a) schematic of modified connecting-rod assembly and b) the journal bearing machine (JBM).The JBM is equipped with the following actuators: i) A stepping motor, which provides a steady-state load(𝐹) to the connecting rod; ii) A cam-driven motor, which provides a periodical load to the connecting rod as theclassical four-stroke engine does; iii) A primary journal motor, which derives the journal shaft to emulate thecrankshaft rotation in an engine; iv) An oil pump motor, which pumps oil to the journal bearing chamber.The JBM is equipped with the following sensors: i) A load cell, which measures the lateral load (𝐹) and thefriction force (𝑓) of the journal bearing; ii) An internal encoder, which measures the journal shaft velocity (𝜔);iii) Three RTDs (resistance temperature detectors), which are installed respectively for the temperaturemeasurement of at the oil system heater (𝑇ℎ𝑒𝑎𝑡𝑒𝑟 ), the chamber inlet oil (𝑇𝑙𝑢𝑏𝑒 ), and the bearing shells (𝑇𝑗𝑜𝑢𝑟𝑛𝑎𝑙 ).In addition, a couple of control schemes are in place: i) Closed-loop controllers that enable reference valuetracking of the lateral load, 𝐹, with the step motor position being the manipulated control variable; ii) Referencevalue tracking of the chamber inlet oil temperature, 𝑇𝑙𝑢𝑏𝑒 , with the heater being the manipulated device; iii)Reference value tracking of the journal shaft speed, 𝜔, which is implemented by an inner-loop PI controller forthe journal motor.15
The nominal operation ranges are as follows: the steady-state load of the connecting-rod 𝐹 [1, 10] kN, thetemperature of the chamber inlet oil 𝑇𝑙𝑢𝑏𝑒 [60, 120] C, and the journal shaft speed 𝜔 [750, 3500] rpm.4.2 Test Procedures and Results with Journal Bearing Machine (JBM)To remove bearing asperities and ensure repeatability of experimental results between different lubricantsamples, a running-in step should be performed, after each the substitution of a new pair of bearing shells [23].The running-in test conditions are given by the harshest conditions during the subsequent tests, and empiricallylocated between the EHD and mixture lubrication regimes to avoid excessive friction and wear. In the presentexperiment, they are identified as: Step 1: chamber inlet oil temperature 𝑇𝑙𝑢𝑏𝑒 80 C, the journal load 𝐹 3 kN, the journal speed 𝜔 750 rpm, duration 18 mins; Step 2: same as Step 1 above, while performs a reverse journal speed 𝜔 -750 rpm.The formal test conditions for each lubricant specimen are detailed as follows: Step 1: an 18 min time step with constant parameters of: the inlet oil temperature 𝑇𝑙𝑢𝑏𝑒 60 C, thejournal load 𝐹 3 kN, and the journal speed 𝜔 3000 rpm, the results of which are shown in Figure A.Ileft in the Appendix. This step aims to stabilize the temperature of the journal bearing shells, 𝑇𝑗𝑜𝑢𝑟𝑛𝑎𝑙 ,which has the closest value to that of the lubricant film between the journal shaft sleeve and bearingshells (no closed-loop control for the tracking of 𝑇𝑗𝑜𝑢𝑟𝑛𝑎𝑙 is placed in the JBM); Step 2: the inlet oil temperature 𝑇𝑙𝑢𝑏𝑒 60 C, the journal load 𝐹 1 kN, and the journal speed is sweptwithin 𝜔 [750, 1000, 1250, 1500, 2000, 2500, 3000, 3500] rpm (both forward and reverse directionsare performed for each speed value to compensate floating signal offsets in the friction torque/forcemeasurements); Step 3: the inlet oil temperature 𝑇𝑙𝑢𝑏𝑒 60 C, the journal load 𝐹 3 kN, and the journal speed 𝜔 isswept in the same range as Step 2; Step 4: repeat Step 1 to Step 3 with all 𝑇𝑙𝑢𝑏𝑒 changed form 60 C to 80 C; Step 5: repeat Step 1 to Step 2 with all 𝑇𝑙𝑢𝑏𝑒 changed form 60 C to 100 C (the journal load 𝐹 3 kN isnot applied under high temperature conditions to avoid excessive wear in the boundary lubricationregime).16
The repeatability of the JBM test results are demonstrated by two representative groups of friction forcemeasurements, as shown in Figure 10, where the first round of friction force measurements essentially agree withthese in the second round throughout the journal speed range. Figure 10 also shows that the effect of dilution asexpected is to i) reduce friction in the full film hydrodynamic regime due to reduced viscous shear and ii) increasefriction in the mixed
3.1 Stabinger Viscometer Stabinger viscometer measurement results of three lubricant, as well as the diesel, at low shear rate (10-100 s 1) are listed in Table I in the Appendix and plotted in Figure 1, where each sample has been tested with the temperature swept from 20 C to 100 C. This shows that diesel dilution substantially reduces the .