Transcription
Earth and Planetary Science Letters 391 (2014) 1–15Contents lists available at ScienceDirectEarth and Planetary Science Letterswww.elsevier.com/locate/epslIntegration of Chang’E-2 imagery and LRO laser altimeter data witha combined block adjustment for precision lunar topographic modelingBo Wu a , Han Hu a,b,c, , Jian Guo aabcDepartment of Land Surveying and Geo-Informatics, The Hong Kong Polytechnic University, Hung Hom, Kowloon, Hong KongState Key Laboratory of Information Engineering in Surveying Mapping and Remote Sensing, Wuhan University, Wuhan, PR ChinaFaculty of Geosciences and Environmental Engineering, Southwest Jiaotong University, Chengdu, PR Chinaa r t i c l ei n f oArticle history:Received 10 June 2013Received in revised form 16 December 2013Accepted 14 January 2014Available online xxxxEditor: C. SotinKeywords:lunar topographyChang’E-2 imageryLRO LOLAcross-mission data integrationblock adjustmenta b s t r a c tLunar topographic information is essential for lunar scientific investigations and exploration missions.Lunar orbiter imagery and laser altimeter data are two major data sources for lunar topographicmodeling. Most previous studies have processed the imagery and laser altimeter data separately forlunar topographic modeling, and there are usually inconsistencies between the derived lunar topographicmodels. This paper presents a novel combined block adjustment approach to integrate multiple strips ofthe Chinese Chang’E-2 imagery and NASA’s Lunar Reconnaissance Orbiter (LRO) Laser Altimeter (LOLA)data for precision lunar topographic modeling. The participants of the combined block adjustmentinclude the orientation parameters of the Chang’E-2 images, the intra-strip tie points derived from theChang’E-2 stereo images of the same orbit, the inter-strip tie points derived from the overlapping areaof two neighbor Chang’E-2 image strips, and the LOLA points. Two constraints are incorporated into thecombined block adjustment including a local surface constraint and an orbit height constraint, whichare specifically designed to remedy the large inconsistencies between the Chang’E-2 and LOLA data sets.The output of the combined block adjustment is the improved orientation parameters of the Chang’E-2images and ground coordinates of the LOLA points, from which precision lunar topographic models canbe generated. The performance of the developed approach was evaluated using the Chang’E-2 imageryand LOLA data in the Sinus Iridum area and the Apollo 15 landing area. The experimental results revealedthat the mean absolute image residuals between the Chang’E-2 image strips were drastically reducedfrom tens of pixels before the adjustment to sub-pixel level after adjustment. Digital elevation models(DEMs) with 20 m resolution were generated using the Chang’E-2 imagery after the combined blockadjustment. Comparison of the Chang’E-2 DEM with the LOLA DEM showed a good level of consistency.The developed combined block adjustment approach is of significance for the full comparative andsynergistic use of lunar topographic data sets from different sensors and different missions. 2014 Elsevier B.V. All rights reserved.1. IntroductionLunar topography is one of the principal measurements thatquantitatively describe the body of the Moon. Together with gravity data, it enables the mapping of subsurface density anomaliesand yields information on not only the shape but also the internal structure of the Moon (Smith et al., 1997). Such information iscritical to understanding the structure of the Moon’s crust, whichhas major implications for the thermal history of the Moon (Garvinet al., 1999; Wieczorek et al., 2006). High resolution and precisionlunar topographic data also play critical roles in lunar explorationmissions, in such areas as the selection of landing sites, the safe*Corresponding author at: State Key Laboratory of Information Engineering inSurveying Mapping and Remote Sensing, Wuhan University, Wuhan, PR China.E-mail address: huhan@whu.edu.cn (H. Hu).0012-821X/ – see front matter 2014 Elsevier B.V. All rights 023maneuvering of lunar vehicles or robots, and the navigation of astronauts in ground operations (Wu et al., 2013).Lunar orbiter imagery and laser altimeter data are two major data sources for lunar topographic modeling. Recent lunarexploration missions, such as the Chinese Chang’E-1 (launchedin October 2007) and the Chang’E-2 (launched in October 2010)(Ouyang et al., 2010), the Japanese SELenological and ENgineering Explorer (SELENE)/Kaguya (launched in September 2007) (Katoet al., 2008), India’s Chandrayaan-1 (launched in October 2008)(Vighnesam et al., 2010), and NASA’s Lunar Reconnaissance Orbiter (LRO) (launched in June 2009) (Vondrak et al., 2010), haveinvolved the use of orbiter cameras and laser altimeters with different configurations on-board the spacecraft. They have collectedvast amounts of lunar topographic data at different resolutions andlevels of uncertainty. Most previous related research has processedthe orbiter imagery and laser altimeter data for lunar topographicmodeling separately (Araki et al., 2009; Li et al., 2010a, 2010b;
2B. Wu et al. / Earth and Planetary Science Letters 391 (2014) 1–15Mazarico et al., 2011; Di et al., 2012; Haruyama et al., 2012;Scholten et al., 2012; Robinson et al., 2012), and there are usuallyinconsistencies between the derived lunar topographic models (e.g.digital elevation models (DEMs)). The correlation or integration ofcross-sensor data (e.g. lunar imagery and laser altimeter data) hasthe potential to produce consistent and precise topographic models, which cannot be achieved when only using the data froma single type of sensor (Rosiek et al., 2001; Wu et al., 2011a;Di et al., 2012). Wu et al. (2011a) proposed the integration ofthe Chang’E-1 imagery and laser altimeter data for lunar topographic modeling through a least-squares adjustment approach, inwhich the Chang’E-1 laser altimeter points, the orientation parameters of the Chang’E-1 images, and tie points collected fromthe stereo Chang’E-1 images are processed and adjusted to export the refined image orientation parameters and laser groundpoints. This approach eliminates the inconsistencies between theimagery and laser altimeter data and allows the generation ofprecision lunar topographic models. However, the approach wasdesigned for the integration of Chang’E-1 imagery and Chang’E-1laser altimeter data. The inconsistencies between these two datasets are moderate because they were collected by sensors onboardthe same spacecraft Chang’E-1 (Wu et al., 2011a). In addition,the approach was designed for single strip image processing anddid not consider multi-strip images for lunar topographic modeling within large image blocks. Lunar topographic modeling using multi-strip images requires block adjustment (Brown, 1976;Cramer and Haala, 2010) of the images, so that the inconsistencies in the inter-strip overlapping areas can be eliminated.This paper aims at cross-mission and cross-sensor data integration for precision lunar topographic modeling. The existing approach (Wu et al., 2011a) will be improved and extended to integrate data from Chang’E-2 imagery and the Lunar ReconnaissanceOrbiter (LRO) Laser Altimeter (LOLA). Integration of cross-missionlunar imagery and laser altimeter data is a more challenging taskbecause the effect of uncertainties between the data sets collectedby different sensors from different missions is more significant. Forexample, DEMs were derived from the Chang’E-2 imagery (Zou etal., 2012) and LOLA data separately in relation to the Sinus Iridumarea on the Moon. The statistics of the elevation differences between these two types of DEM have shown that the Chang’E-2data is about 300 m lower than the LOLA data on average. Nevertheless, this cross-mission and cross-sensor data integration strategy is very valuable for the integration of data sets from differentsources to generate consistent and precise lunar topographic models, which will permit the full comparative and synergistic use ofsuch data sets. This paper presents a novel combined block adjustment approach for the integration of Chang’E-2 imagery andLOLA data covering large areas with multi-strip images. The combined block adjustment of Chang’E-2 imagery and LOLA data canenhance the geometric consistency between multi-strip Chang’E-2images and between the Chang’E-2 imagery and LOLA data, so thatthe accuracy of topographic modeling in large block areas can befurther improved.After presenting a literature review on lunar topographic modeling from various lunar orbital imagery and laser altimeter data,this paper describes the specifications of Chang’E-2 imagery andLOLA data. The combined block adjustment approach for the integration of Chang’E-2 imagery and LOLA data is then presented indetail. The Chang’E-2 imagery and LOLA data for the Sinus Iridumarea (18 to 25.7 W and 42 to 46.3 N) and the Apollo 15 landing area (0.15 to 4 E and 24 to 28 N) are used for experimentalanalysis. The performance of the proposed method is then evaluated. Finally, concluding remarks are given.2. Related workLunar exploration missions in recent years have collected avast amount of lunar surface images and elevation measurementsthrough the use of cameras and laser altimeters onboard thespacecraft. The CCD camera onboard the Chinese Chang’E-1 spacecraft returned 1098 orbiter images with a spatial resolution of120 m. A global DEM was produced using these images. The gridsize for this DEM is up to 500 m and the planar positioning accuracy is about 370 m (Liu et al., 2009). A global topographicmap of the Moon at a scale of 1:2,500,000 was also produced using the Chang’E-1 imagery; its planar positioning accuracy rangesfrom 100 m to 1.5 km (Li et al., 2010a). The laser altimeter onboard the Chang’E-1 spacecraft collected more than nine millionrange measurements covering the entire Moon. The measurementshad spacing resolutions of 1.4 km for the along-track direction and7 km for the cross-track direction (at the equator), from which aglobal DEM with 3-km grid spacing was produced. The plane positioning accuracy of the DEM was 445 m, and the vertical accuracywas 60 m (Li et al., 2010b).The Japanese SELENE mission also collected stereoscopic imageswith a spatial resolution of 10 m using its push-broom TerrainCamera, which covered almost the entire surface of the Moon.A global DEM mosaic with 10-m spatial resolution was producedfrom this camera imagery. The locations of the Apollo Laser Ranging RetroReflector (LRRR) were compared with this DEM. The results revealed differences ranging from 17 m to 5 m for longitude, from 20 m to 48 m for latitude, and from 3 to 5 mfor elevation (Haruyama et al., 2012). The SELENE laser altimetercollected more than 10 million high-quality range measurementscovering the entire lunar surface with a height resolution of 5 m ata sampling interval smaller than 2 km (Araki et al., 2009). A globallunar topographic map with a spatial resolution of 0.5 degree wasderived from the SELENE laser altimeter data (Araki et al., 2009).India’s Chandrayaan-1 was equipped with a Terrain MappingCamera with an imaging capability of 5-m spatial resolution. Thecollected images partially covered the lunar surface and wereused to produce regional DEMs (Arya et al., 2011; Radhadeviet al., 2013). The root mean square (RMS) error of the DEMswas about 200–300 m in latitude, longitude, and height withrespect to the references of Clementine base map mosaic andLOLA data (Radhadevi et al., 2013). The laser altimeter onboardChandrayaan-1 was able to provide range measurements withrange resolution better than 5 m (Kamalakar et al., 2009). The collected laser altimeter data cover both of the lunar poles and otherlunar regions of interest.There are two cameras onboard the LRO spacecraft: a wideangle camera (WAC) and the narrow-angle camera (NAC). The cameras have collected lunar images with spatial resolutions of 100 mand 50 cm, respectively. The WAC images provide global coverage,and a near-global DEM GLD100 with grid spacing of 100 m wasproduced from them (Scholten et al., 2012). The NAC images coveronly a small portion of the lunar surface, but that includes complete coverage of both poles (Robinson et al., 2012). Regional DEMswith meter-level resolution have been generated from the NAC images (Tran et al., 2010; Burns et al., 2012). The LOLA onboard theLRO measures the distance to the lunar surface at five spots simultaneously (Smith et al., 2010). The five-spot pattern providesfive adjacent profiles for each track. The spacing resolution in thealong-track direction is 10 to 12 m within the combined measurements in the five adjacent profiles. The average distance betweenLOLA tracks is in the order of 1–2 km at the equator and decreasesat higher latitudes. LOLA measurements are generally very dense(varying from a few meters to tens of meters) at polar sites. LOLADigital Elevation Models (LDEM) are built by binning all valid measurements into the map grid cells and are generated at multiple
B. Wu et al. / Earth and Planetary Science Letters 391 (2014) 1–15resolutions. The LDEM 1024 from the LOLA release 8 in the Planetary Data System (PDS) has the best resolution of 1024 PPD (pixelper degree), which is equivalent to about 30 m/pixel in latitude.However, it should be noted that not every pixel in the LDEM 1024has a measurement, depending on the latitudes of the locations.As described above, most previous research has processed thelunar imagery and laser altimeter data separately. Research reports have occasionally emphasized cross-sensor and cross-missiondata integration for lunar topographic modeling. The Unified LunarControl Network (ULCN), which dated back to Brown (1968), hadcombined the earth-based LRRR (Lunar Laser Ranging Retroreflector) measurements and telescopic observations to form a networkof lunar ground control points. Light (1972) and Doyle et al. (1976)were among the first to integrate observations of synchronizedinstruments on board the same spacecraft to create lunar topographic models using the data collected from Apollo missions 15,16, and 17. Light (1972) adopted the distance measurements froma laser altimeter to constrain the orbiter height of the optical camera. Doyle et al. (1976) employed the stellar camera to help orientthe optical camera with preflight calibrated lock-angles, and usedthe laser altimeter observations to help determining the scale ofthe stereo model of the images collected by the optical camera.Rosiek et al. (2001) attempted to combine the Clementine images with the Clementine laser altimeter data. The images wereused to establish horizontal control and the laser altimeter datawere used for vertical control. However, the two data sets did notalign well with each other due to the marginal overlap betweenthe stereo models. Radhadevi et al. (2013) presented a geometric correction method for Chandrayaan-1 imagery. The planimetriccontrol was identified from the Clementine base map mosaic andvertical control was derived from LOLA data. This method onlyused the Clementine and LOLA data as control information in thephotogrammetric processing of Chandrayaan-1 imagery, and thecontrol information was very limited. Di et al. (2012) studied theco-registration of Chang’E-1 stereo images and laser altimeter data.A crossover adjustment was first used to remove the crossoverdifferences between the different laser altimeter tracks. An ICP (iterative closest point) algorithm was used to register the 3D pointsderived from the stereo images to the laser altimeter points, fromwhich the image orientation parameters were refined so that theimages and laser altimeter data were co-registered. However, thismethod treated the Chang’E-1 laser altimeter data as the absolutecontrol and the accuracy of the final generated topographic modelswas totally dependent on the accuracy of the laser altimeter data.Integration of multi-source remote sensing imagery and laseraltimeter data has been used for topographic mapping of Earthand Mars. An early example of using additional data sources (e.g.DEM) as control information for aerial triangulation was the approach presented by Ebner et al. (1991). This approach focusedmainly on the satisfaction of accuracy for middle- and small-scalephotogrammetry for Earth aerial and satellite image processingby minimizing the differences between the heights derived fromstereo images and using the interpolated heights from a DEM asconstraints. Jaw (2000) proposed a method in which additionalsurface information was integrated into the aerial triangulationworkflow by hypothesizing plane observations in the object space.The estimated object points derived from image measurements together with the adjusted surface points provided a better pointgroup describing the surface. Teo et al. (2010) investigated theblock adjustment of three SPOT 5 images using a DEM as theelevation control. Common tie points were first identified from images. Initial ground coordinates of the points were derived fromspace intersection using the image orientation parameters. The elevation coordinates of the points were then interpolated from theDEM based on their planimetric coordinates, and their ground coordinates were further adjusted through an iteration procedure in3the block adjustment. The experimental results indicated that using the DEM as an elevation control can improve geometric accuracy and reduce geometric discrepancies between images. For Marstopographic mapping applications, Anderson and Parker (2002) investigated the registration between the imagery and laser altimeterdata collected by the Mars orbiter camera (MOC) and Mars orbiter laser altimeter (MOLA), both onboard the Mars Global Surveyor (MGS). Yoon and Shan (2005) presented a combined adjustment method to process the single-strip MOC imagery andMOLA data and reported that the large mis-registration betweenthe two datasets could be reduced to a certain extent. Spiegel(2007) presented a method for the co-registration of High Resolution Stereo Camera (HRSC) images and MOLA data. A sparse stereopoint cloud generated from the HRSC images was adjusted to optimize its fit to a surface interpolated from the MOLA data, fromwhich the interior and exterior orientation parameters of the HRSCimages were improved. Albertz et al. (2005) presented a methodfor the photogrammetric processing of HRSC imagery. The processing comprises improvements of the image EO parameters and theenhancement of the DEM quality with the assist of MOLA DEM.Gwinner et al. (2009) also produced high quality DEM productsfrom the HRSC imagery and MOLA DEM. The proposed system hadsuccessfully created DEM of 50 m grid from stereo imagery withthe ground resolution of 12 m/pixel. The differences between theDEM produced by the proposed system and that of MOLA DEMranged from 30 to 40 m.Compared with previous research works, the combined blockadjustment approach for the integration of Chang’E-2 imageryand LOLA data presented in this paper highlights the followingthree aspects: (1) Cross-mission and cross-sensor lunar imageryand laser altimeter data integration has the capability of processing multi-strip images; (2) LOLA data is used as a local surfaceconstraint to reduce the inconsistencies between the Chang’E-2imagery and LOLA data; (3) a novel orbit height constraint is incorporated to obtain more robust and convergent results, which iscrucial for the block adjustment of multi-strip images.3. Specifications of Chang’E-2 imagery and LRO laser altimeterdata3.1. Chang’E-2 imageryChang’E-2 is a Chinese lunar probe launched on October 1,2010. It was a follow-up to the Chang’E-1 lunar probe, which waslaunched in 2007. Chang’E-2 was part of the first phase of the Chinese Lunar Exploration Program (Ouyang et al., 2010). The missioncollected a tremendous amount of data with its various onboardpayloads for lunar scientific research and in preparation for a softlanding by the Chang’E-3 lander and rover (Wang et al., 2012).Chang’E-2 completed its lunar exploration mission on June 8, 2011.It was then sent to the L2 Lagrangian point where it arrived onAugust 30, 2011. Chang’E-2 remained at L2 for several months anddeparted from L2 to the asteroid 4179 Toutatis on April 15, 2012.Chang’E-2 successfully flew by the Toutatis on December 13, 2012and took close-up images of the asteroid. Chang’E-2 is now 20 million km away from Earth and is flying into deeper space.Chang’E-2 used its onboard CCD camera to collect surface imagery of the Moon. Chang’E-2 flew at two types of orbit altitude.The first was a 100 100 km circular orbit at which the CCD camera could image the lunar surface at a resolution of 7 m. Thesecond was a 100 15 km elliptical orbit at which the CCD camera provided imaging resolution better than 1.5 m (Zhao et al.,2011). The images collected during the first type of orbit providedglobal image coverage of the Moon. The higher resolution imagescollected during the second type of orbit provided more detailed
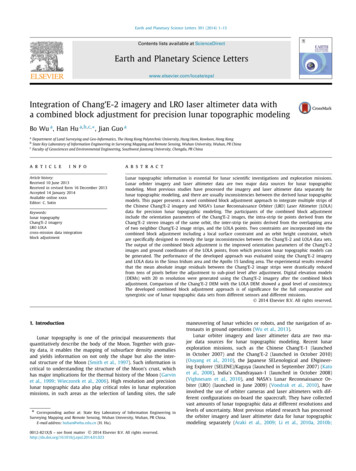
4B. Wu et al. / Earth and Planetary Science Letters 391 (2014) 1–15Fig. 1. Schematic configuration of the Chang’E-2 CCD camera. (a) Focal plane of the Chang’E-2 CCD camera and (b) stereo imaging geometry of the Chang’E-2 CCD camera.information and were mainly used for the preparation of Chang’E-3lunar landing mission and surface operations (Zhao et al., 2011).The CCD camera onboard Chang’E-2 spacecraft is a two-linepush-broom sensor. The two CCD lines are assembled on a uniquefocal plane separately, which enables the acquisition of forwardand backward-looking imagery along the flight direction simultaneously to create stereo pairs. The forward-looking imagery has aviewing angle of 8 and the backward-looking imagery has a viewing angle of 17.2 . The forward-looking CCD line is closer to thecenter of the focal plane and offers better imaging quality. EachCCD line is 62.06 mm in length and has 6144 pixels (pixel size:10.1 μm). They share the same optical axis. The field-of-view ofthe camera is 42 . The schematic configuration of the Chang’E-2CCD camera (Zhao et al., 2011) is illustrated in Fig. 1.To model the geometry of the Chang’E-2 imagery, it is necessaryto determine the coordinate frames and the IO (interior orientation) and EO (exterior orientation) parameters of the imagery.A lunar body-fixed frame is the reference frame on which the relative position and orientation of the Chang’E-2 spacecraft frameis defined. A camera frame is defined at the center of the camera focal plane, and its orientation with respect to the Chang’E-2spacecraft frame is known. IO parameters define the intrinsic setting of the camera system. The Chang’E-2 camera optical systemhas a focal length of 144.3 mm. The dimensions of the CCD linesand their positions with respect to the camera focal plane are provided in Fig. 1(a). In the raw Chang’E-2 image, the row position ofeach pixel is related to the Ephemeris Time. The physical positionof each pixel in the image with respect to the camera frame can becalculated from the IO parameters. The EO parameters define thepositions of the camera’s perspective center and pointing anglesat a specific time. The EO parameters of each image line are different and can be retrieved by interpolating the spacecraft’s trajectoryand pointing vectors based on the observation time. Based on thewell-known co-linearity equation (Wang, 1990), the 3D coordinatesof a ground point in the lunar body-fixed coordinate system can becalculated by photogrammetric space intersection from the imagecoordinates of conjugate points in stereo images.3.2. LRO LOLA dataThe LOLA onboard the LRO is a five-spot X-pattern pulsetection altimeter, which is designed to measure the shape ofMoon by measuring precisely the range from the spacecraft tolunar surface. LOLA operates at 28 Hz and is able to measuredethethethedistance to lunar surface at five spots simultaneously with a nominal ranging accuracy of 10 cm (Smith et al., 2010). The five-spotpattern provides five adjacent profiles for each track, 10 m to 12 mapart over a 50- to 60-m swath, with combined measurements inthe along-track direction every 10 to 12 m. This five-spot patternof ranging measurements is very useful in the determination ofsurface roughness and surface slopes in local regions.The accuracy of the topographic measurements and models derived from LOLA ranging data is very high. As reported by Mazaricoet al. (2011), LOLA measurements have a precision about 10 min the along-track and cross-track directions and 1.5 m in the radial direction, respectively, which are estimated as the root-meansquare deviation of the LRO orbit solutions, after cross-over analysis and depending on the orbit solution (Mazarico et al., 2011).The absolute accuracy of the orbit solutions, and therefore the error of the true position of the terrain point, is estimated to be ofthe same order of magnitude.The LOLA data set is considered to be the most accurate topographic data set of the Moon to date. It provides much denserrange measurements compared with other similar instrumentsfrom other missions.4. Combined block adjustment of Chang’E-2 imagery and LROlaser altimeter data4.1. Overview of the approachA combined block adjustment model is developed for the integration of Chang’E-2 imagery and LOLA data. Since there are notracking data or kernel data provided for the Chang’E-2 imageryused in this research, several (10–20 in general) LOLA points weremanually selected on both the Chang’E-2 forward- and backwardlooking images as ground control points, from which an initial setof EO parameters for the Chang’E-2 images could be derived usingthe method presented by King et al. (2009). The initial EO parameters were then improved through a bundle adjustment of thesingle-strip Chang’E-2 imagery and LOLA data using the approachpresented by Wu et al. (2011a). The obtained EO parameters foreach single-strip Chang’E-2 imagery were then used as input inthis combined block adjustment. The combined block adjustmentuses two types of tie points: intra-strip tie points and inter-striptie points. The intra-strip tie points are the corresponding points(conjugate points representing the same textural feature) identifiedfrom the stereo images (forward- and backward-looking images)
B. Wu et al. / Earth and Planetary Science Letters 391 (2014) 1–155Fig. 2. Framework of the combined block adjustment of Chang’E-2 multi-strip imagery and LOLA data for precision lunar topographic modeling.of the same image strip. The inter-strip tie points are the corresponding points identified from the overlapping area in the stereoimages of two neighbor image strips. These tie points should bedistributed evenly in the image area. Based on the IO and EOparameters of the images, the 3D coordinates of intra-strip andinter-strip tie points in the lunar body-fixed frame can be calculated from the photogrammetric space intersection. However, theimage EO parameters would probably not be precise enough, andthe 3D coordinates of the tie points may deviate from their truelocations. There might be inconsistencies between the 3D coordinates of the same pair of inter-strip tie points identified from twoneighbor image strips. In addition, based on the image orientationparameters, the LOLA ground points can be back-projected to theChang’E-2 stereo images. If the image EO parameters are preciseenough, these back-project points on the Chang’E-2 stereo imagesshould be conjugate points representing the same textural feature.However, this is not the case due to the possible errors in the image EO parameters.The above mentioned errors or inconsistencies can be reducedor eliminated through the combined block adjustment of theChang’E-2 imagery and LOLA data. The participants of the combined block adjustment include the image EO parameters, theintra-strip tie points, the inter-strip tie points, the ground coordinates of the tie points, the LOLA ground points, and the backprojected image coordinates of LOLA ground points. Two additionalconstraints are incorporated in the block adjustment. The firstis a local surface constraint, which indicates that the calculatedground coordinates of the tie points should lie in a local surfacedetermined by its neighbor LOLA ground points. The second isan orbit height constraint, which is based on a constant circularorbit height of the Chang’E-2 spacecraft. The final output of thecombined block adjustment is the improved image EO parametersand improved ground coordinates of the LOLA points. Dense image matching (Wu et al., 2011b, 2012) can then be carried outbetween the stereo image pair for each image strip to generateenormous evenly distributed matched points. The 3D coordinatesof the matched points can be calculated from the photogrammetricspace intersection based on the improved image EO parameters, sothat lunar topographic models (e.g., DEMs) with improved interstrip consistency and improved precision can be generated. Theframework of the combined block adjustment approach is shownin Fig. 2. The numbers marked in Fig. 2 correspond to the observation equations of the block adjustment model which are describedin detail in the following section.4.2. Combined block adjustment modelFor the Chang’E-2 stereo images, the relationship of a 3Dground point ( X p , Y p , Z p ) and its corresponding pixel (x p , y p )can be represented by the following co-linearity equation (Wang,1990):xp fyp fm11 ( X P X S ) m12 (Y P Y S ) m13 ( Z P Z S )m31 ( X P X S ) m32 (Y P Y S ) m33 ( Z P Z S )m21 ( X P X S ) m22 (Y P Y S ) m23 ( Z P Z S )m31 ( X P X S ) m32 (Y P Y S ) m33 ( Z P Z S )(1)where ( X S , Y S , Z S ) are the coordinates of the camera center in object space, f is the focal length, and mi j are the elements of arotation matrix that is determined entirely by three rotation angles(ϕ , ω, κ
the Chang'E-1 imagery and laser altimeter data for lunar topo-graphic modeling through a least-squares adjustment approach, in which the Chang'E-1 laser altimeter points, the orientation pa- . egy is very valuable for the integration of data sets from different sourcestogenerateconsistent andpreciselunar topographicmod-els, which will .