Transcription
How Do You Invest in Innovation?Nasdaq-100 Index2020 Year-End Update
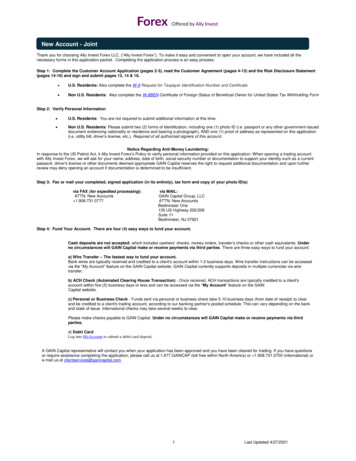
Nasdaq-100 IndexThe Benchmark of the 21stCentury Industrials
Nasdaq-100 Index: OverviewThe disruptors; the game-changers; the forward-thinkers.Companies that influence our lives daily, in multiple areas. GE, Chicago Gas Company, American Sugar Company, and the other original DowIndustrials accelerated the growth of the US economy at the turn of the 20thcentury, and helped spur its transformation from agricultural to industrial. By mid-century, GE was still one of the nation’s 10 largest companies by marketcap, joined by the automakers (GM/Ford/Chrysler), Big Oil (Exxon Mobil, Texaco,Gulf Oil), and other large, diversified industrial companies like DuPont. At the turn of the 21st century, the Internet/Tech Bubble heralded thetransformation of the economy from industrial to technological; from analog todigital; from hardware to software. Today, Apple, Amazon, Google, Facebook and Microsoft have become globalleaders in the technology sector by creating products and services that areessential to both individual consumers and enterprise customers. Fromsoftware, computing, and communications, to entertainment, advertising, and ecommerce, their platforms represent the new “diversified industrials” of the 21stcentury. Beyond the biggest names, companies like Intel and Netflix specialize innarrower applications of technology, while the rest of the Nasdaq-100encompasses innovation-driven companies in other sectors, like Starbucks.3
The Nasdaq-100: History The Nasdaq-100 Index (NDX) is comprised of the 100largest, non-financial companies listed on The NasdaqStock Market Launched on January 31, 1985 Rebalanced to modified market cap index onDecember 21, 1998 Special Rebalance effective May 2, 20114
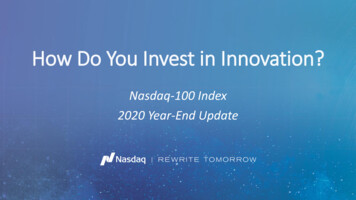
Nasdaq-100 Index: Performance vs. S&P 500INDEX ANNUAL PRICE RETURNS – 2021 DATA AS OF MARCH 31INDEX PERFORMANCE FROM 2007 TO MARCH 31, 2021Annual Price Return PerformanceCumulative Total Return PerformanceNDX60%53.54%Nasdaq-100 TRSPXS&P 500 TR80047.58%70040%23.45%20% 620%60016.26%5004000% 257%300-20%200-40%100-60%2008 2009 2010 2011 2012 2013 2014 2015 2016 2017 2018 2019 2020 202102007 2008 2009 2010 2011 2012 2013 2014 2015 2016 2017 2018 2019 2020 NDX has outperformed SPX in 11 of the past 12 years, including by morethan 30% in 2020 Cumulative total returns through March 31, 2021 were 620% for NDX –approximately 2.5 times the returns of 257% for SPX.Source: Nasdaq, FactSet, Bloomberg. Data as of 3/31/20215
Performance Data (Total 62017201820192020Calendar Year rce: Nasdaq, FactSet. Data as of 12/31/2020.S&P 1.38%11.96%21.83%-4.38%31.49%18.40%CorrelationNDX 9160.8010.9490.9500.937Calendar Year VolatilityNasdaq-100S&P 1%12.46%36.29%34.37%NDX outperformed SPX6
Historical Volatility Both the Nasdaq-100 and the S&P 500 have had very similar volatility over last 10 years9080706050403020100CBOE Nasdaq-100 Volatility IndexSource: Nasdaq, Bloomberg. Data as of 12/31/2020.CBOE S&P 500 Volatility Index7
1-Year Excess Return vs. Volatility50%Nasdaq-100 vs S&P /201112/30/201212/30/201312/30/2014Excess ReturnSource: Nasdaq, Bloomberg. Data as of 812/30/201912/30/2020020Difference In Volatility8
Coveted PlacementThe 100 that Make the Index
Nasdaq-100 vs. S&P 500: Composition Over TimeNDX vs. SPX Market CapitalizationNumber of Components in NDX and SPX by 35%35%33%28%30%25%22% 23%18%15%1 16%15%14%13%30027%23%20% 20% 20%365383 378 370 370392 390 384402414 413435 437 435 435 428 425 423 419232320016%14%13%15%15%18% 19%17%40373130% 31%26%22%18%3730%26%19%20% 17%10%24% 78579NDX Contribution to SPXSource: Nasdaq Global Indexes, Bloomberg. Data as of 006NDX/SPX Ratio203100%30Nasdaq-Listed, In NDX & SPXNasdaq-Listed, In SPX Not NDXNYSE-Listed, In SPXNDX Only (rhs)10
Nasdaq-100 Index: Constituent Size vs. S&P500Average, median and minimum market caps of the NASDAQ-100 and the S&P 500 All figures dropped during the financial crisis and have been steadily rebounding until a brief pause during 2018’s Q4 mini bear-market. Eleven of the last twelve years the average market cap has been higher in NDX than SPX. As of year-end 2020, NDX: 148B, SPX: 66B. The median market cap has been higher for NDX than SPX in each of the last eight years — as of year-end 2020 the medians were 44.1B forNDX and 25.6B for SPX. Despite any large companies, the market cap of NDX tends to be truer to large cap than SPX. The smallest company in NDX ( 17.3B) has been larger than the smallest company in SPX ( 3.1B) for the last twelve years.S&P 500: MARKET CAPNASDAQ-100: MARKET c10Dec11Dec12Dec13Dec14Dec15Dec16Dec17Dec18Source: Nasdaq, Bloomberg, Factset. Data as of 2Dec13Dec14Dec15Dec16Dec17Dec18Dec19Dec2011
Top 50 vs. Bottom 50The top positions in market capitalization weighted indexes are often heavily focused on larger holdings while putting less emphasis on smallerholdings. We can visualize it with a sample test. Let’s equally divide the stocks in the Nasdaq-100 into two segments based on market capitalization:the Top 50 and the Bottom 50. The average Price to Book ratio chart shows a consistent bias toward the Top 50 - they are highly valued (Figure 1).This means that great values exist in the Bottom 50 of the Nasdaq-100. Our back-tests also verified that the equally weighted Bottom 50 portfoliohas outperformed the Top 50 portfolio since 2001 (Figure 2).Figure 2: The Bottom 50 of Nasdaq-100 is outperformingFigure 1: Price to Book Ratios within renceTop 50Bottom 50Source: Nasdaq, Bloomberg. Data as of 2/28/2021.Top 0620052004200320022001(1)12/24/20010-Bottom 5012
The Decade of the Nasdaq-100The underlying story for the rise in the Nasdaq-100 is that the U.S.'s economic growth is shifting from capital-intensive,traditional industries (Basic Materials and Oil & Gas) to the “new-economy” sectors (Technology & Consumer Services).10-Year Sales Growth Across Industries in the Nasdaq USLarge Mid Benchmark as of December 31, 2019Industry (ICB) Breakdown in Nasdaq-100 and S&P 500as of December 31, 2020Technology128%Health Care90%Consumer Services59%Financials48%Consumer Goods45%Industrials34%Telecommunications21%Basic Materials15%28%Technology15%Consumer ServicesHealth Care6%IndustrialsUtilities5%2%Oil & GasOil & Gas-8%Financials12%3%1%2%0.2%-7%13%2%1%Basic MaterialsUtilities15%S&P 500Source: Nasdaq, Factset. Data as of dates noted above.22%9%10%Consumer GoodsTelecommunications55%Nasdaq-10013
Nasdaq-100: Top Performing ConstituentsTop 20 Performers: 2020 Full-Year Revenue Growth (%)1,234396370200 193100 The top 20 performers by price returnsaw their full-year revenues grow by35% on average (ex-Moderna) Only 2 of the top 20 price performerssaw negative YoY revenue growth988873473915038332928122 120 117 100452297 94 92 91 86 81 79 7615312 105(6)Source: Nasdaq, Factset. Data as of 12/31/2020.APPLESYNOPSYSIDEXX LABORATORIESALIGN TECHNOLOGYATLASSIANCADENCE DESIGN GNPINDUODUOZOOM VIDEOMODERNAPELETONTESLAAMAZON.COMMARVELL TECHAPPLESYNOPSYSIDEXX LABORATORIESALIGN TECHNOLOGYATLASSIANCADENCE DESIGN GNPINDUODUOZOOM VIDEOMODERNAPELETONTESLA(7)14AMAZON.COM434 434 12 companies in the Nasdaq-100registered full-year price returns of atleast 100% in 2020 Only 14 companies registered negativefull-year returnsMARVELL TECH743Top 20 Performers: 2020 Full-Year Price Returns (%)
Nasdaq-100: New Additions in 2020No.Effective Date Ticker1MarketCap, BnFY'20ReturnCompany NameICB IndustryICB Sector4/20/2020 DXCMDexCom, Inc.Health CareHealth Care Equipment & Services35.569.024/30/2020 ZMZoom Video Communications, Inc.TechnologySoftware & Computer Services67.0395.836/22/2020 DOCUDocuSign, Inc.TechnologySoftware & Computer Services41.5200.047/20/2020 MRNAModerna, Inc.Health CarePharmaceuticals & Biotechnology41.3434.158/24/2020 PDDPinduoduo Inc.Consumer ServicesGeneral Retailers155.3369.8610/19/2020 KDPKeurig Dr Pepper Inc.Consumer GoodsBeverages45.010.5712/21/2020 AEPAmerican Electric Power Company, Inc. UtilitiesElectricity41.3(11.9)812/21/2020 MRVLMarvell Technology Group Ltd.TechnologyTechnology Hardware & Equipment31.979.0912/21/2020 MTCHMatch Group, Inc.TechnologySoftware & Computer Services39.343.11012/21/2020 OKTAOkta, Inc.TechnologySoftware & Computer Services30.8120.41112/21/2020 PTONPeloton Interactive, Inc.Consumer ServicesTravel & Leisure38.8434.21212/21/2020 TEAMAtlassian Corporation PlcTechnologySoftware & Computer Services30.994.3Tesla added to S&P 500 in December 2020 – largest addition in the index’s history, approximately 7.5years after being added to Nasdaq-100. Tesla price up 2,500% in that period.Source: Nasdaq Global Indexes, Factset. Data as of 12/31/2020.Tesla initial market cap when added to NDX was 15Bn, vs. 660Bn on date of SPX addition15
Nasdaq-100 bythe Sectors
Nasdaq-100 Index: SectorsSector Breakdown While heavy in Technology, Consumer Discretionary and Health Care make up a substantial weight Consumer Discretionary includes companies like Amazon, Tesla, Netflix, Costco and StarbucksIndustryTechnologyConsumer DiscretionaryHealth CareTelecommunicationsIndustrialsConsumer StaplesUtilitiesBasic MaterialsReal EstateFinancialsAverage Weight(FY 2020)Contributed Return(FY 2020)Pure Return(FY 2020)Benchmark Return(FY : Nasdaq, Bloomberg. Data as of 12/31/2020.17
Source: Nasdaq. Data as of 12/31/2020.NQG45 - Global Consumer StaplesNQG40 - Global Consumer DiscretionaryNQG65 - Global UtilitiesNQG60 - Global EnergyNQG55 - Global Basic MaterialsNQG50 - Global IndustrialsNQG35 - Global Real EstateNQG30 - Global FinancialsNQG20 - Global Health CareNQG15- Global TelecommunicationsNQG10 - Global 132/3/201312/3/2012Sector Exposure Matters50045040035030025020015010050018
Source: Nasdaq. Data as of 12/31/2020.NQUSB10 - US TechnologyNQUSB30 - US FinancialsNQG30 - Global 132/3/201312/3/2012Technology or Financials500450400350300250200150100500NQG10 - Global Technology19
Quantifying Innovation
Research and Development Powerhouse R&D is a key driver of innovation and economic growth Companies in the Nasdaq-100 spend nearly twice as much in R&D, on average, compared to those in theS&P 500; 79 of the Nasdaq-100 are currently part of the S&P 500 Calculating R&D as a percent of sales in the last 12 months, Nasdaq-100 companies averaged 40% higherthan S&P 500Weighted Average Annual R&D Expense, BnWeighted Average R&D as % Sales9.9%11.57.1%6.51.6%3.4 Billion3.40.5NDXSPXSource: Nasdaq, Factset. Data as of 12/31/2020.SPX ex NDXNDXSPXSPX ex NDX21
Accelerating Growth of Intangible AssetsThe current crop of Nasdaq-100 constituents has grown the value of their patents by 900% since May 2007,vs. 300% across all publicly-listed, tracked companies globally. Growth for the S&P 500 overall was 450%, butonly 331% excluding the contribution of overlapping Nasdaq-100 firms. Global growth ex-US was only 268%Growth in Value of Patents,Nasdaq-100 vs. S&P 500ex-Nasdaq-100 FirmsGrowth in Value of Patents,S&P 500 vs. Global PublicCompanies ex-USGrowth in Global Aggregate Value of Patents AmongPublicly Listed Companies, 2007-2020 ( Bn)2,0001,797.91,800Nasdaq-100 companies now represent 10.6% ofglobal aggregate patent value across all publiclylisted companies, vs. only 4.3% in May 20071,6001,4001,200 331%1,279.3 268%1,000800400Source: Nasdaq, Quandl. Data as of -13Nov-12May-13Nov-11Global ex-USMay-12SPX190.4Nov-10SPX ex 085.319.0 0467.996.1Nov-0885.3 449%May-09467.9Nov-07348.0May-0867.019.0 901%May-07190.4444.1May-20600518.6Nov-20288.422
Disruptive Technology and R&D 58 companies in the Nasdaq-100 (representing 84% of index weight) recently filed patents across one ormore of 35 key areas of Disruptive Technology such as Artificial Intelligence, Clean Energy, or Blockchain46.3%26 companies in the Nasdaq-100 filed at least 1 patent relating toCloud Computing in our 12-month study period, and collectivelyfiled 34% of all such patents. Amazon, Intel & Microsoft aloneaccounted for 23% of all Cloud Computing patent activity37.9%33.7% 33.6%32.1%30.8% 30.1%29.3%27.7%24.0%22.0%18.7% 18.0%17.4%Average % of patents contributedacross 33 Disruptive Technologies15.2%12.6% 12.5%10.9% 10.5% 10.4%6.8% 6.2%5.1%2.9% 2.4% 2.0% 1.9%Source: Nasdaq as of December 31, 2020; Yewno as of November 30, 202023
Nasdaq-100 by Thematic Exposures# of Constituents per ThemeWaterGreen EconomySmart Grid InfrastructureClean EnergyDigital HealthHealthcare InnovationBiotechCybersecurityFuture MobilityRoboticsAI / Big DataCloud ComputingSemiconductorsInternet Economy5GStreamingFinTech InnovationVideo Gaming/eSports & BettingIndex Weight per Theme1651361057182413171716635Source: Nasdaq, Bloomberg, FactSet. Data as of 3/31/2021.Based on overlap with existing Nasdaq Thematic Indexes, except for Digital Health,Healthcare Innovation, 5G, Streaming, and Video Gaming/eSports & Betting wherecompetitor products were analyzed.WaterGreen EconomySmart Grid InfrastructureClean EnergyDigital HealthHealthcare InnovationBiotechCybersecurityFuture MobilityRoboticsAI / Big DataCloud ComputingSemiconductorsInternet Economy5GStreamingFinTech InnovationVideo Gaming/eSports & 7.0%29.8%15.1%26.2%33.6%16.0%3.2%4.6%24
The Fundamentals
Nasdaq-100 Index: Fundamentals The fundamental data behind the NASDAQ-100 has drastically improvedover the past decade despite a volatile economy and the greatestfinancial market collapse since the Great Depression. Earnings, the most basic number to value a company, have skyrocketed,showing maturation of the companies as they increase revenues butreduce costs. Costs have been controlled, shares were bought back,dividends have increased and P/E has contracted. Since 2003, NDX has had a Compound Annual Growth Rate (CAGR) of:o 20% in earningso 12% in revenueso 25% in dividend valueo- 7% in P/E The shift in NDX fundamentals has resulted in significant outperformanceover other US large cap indexes.Source: Nasdaq, Factset. Data as of 12/31/2020.26
Nasdaq-100 Index: Valuation vs. Sales GrowthNDX Sales per ShareNDX 88001/1/2008Sales: 377%Price: 665%Valuation: 17%457/1/2007 Fundamental story has beenthe main driver of long-runrecovery, rewarding the growthof NDX companies9001/1/2007 The trend broke during 2020,with P/E climbing to a range inthe mid-to-upper 30sSales Growth vs. Price Return vs P/E7/1/2006 From 2014-2019, NDX P/E ratio(TTM basis) had stabilized inthe low-to-mid 20s, belowwhere it was in the mid-2000s1/1/2006 NDX P/E (rhs)Source: Nasdaq, FactSet, Bloomberg. Data as of 3/31/2021.27
Nasdaq-100 vs. S&P 500: Fundamentals Over Time5,000200320044,50020054,000200620073,5002008 44x20093,000201020112,5002012 23.5x20132,000201420151,50020161,0002017 2.85x 7.4x500 3.5x 2x2018201920200NDX EarningsSPX EarningsNDX RevenuesSPX RevenuesNDX DividendsSPX DividendsCurrent TTM Dividend Yield: 0.72% (NDX) vs. 1.42% (SPX)Source: Nasdaq, Factset, Bloomberg. Data as of 12/31/2020. Current TTM Dividend Yields as of 4/5/2021.28
Full-Year 2020 Earnings AnalysisDriven by the global pandemic, 2020 saw an unusually high number of extraordinary (i.e. “one-time”) itemsimpacting company full-year earnings, especially in the S&P 500. While headline (i.e. “recurring”) earningswere down 18% YoY, unadjusted earnings were down 32%. In the Nasdaq-100, the differences were marginalTrailing One-Year EPS at Index Level(“Headline” i.e. from Continuous Operations)325.31 4.5%339.86Unadjusted Trailing One-Year EPS at Index Level(Before “Adjustments for Extraordinary Items”)314.13 q-100S&P 50020192020Source: Nasdaq, Bloomberg. Data as of 12/31/2020.Nasdaq-100S&P 5002019202029
Full-Year 2020 Earnings AnalysisThe impact to earnings for S&P 500 companies stemmed from a number of different sectors, including Energy,Telecommunications, Health Care, and Industrials. The 10 biggest single-company write-downs totaled 113Bnalone, out of nearly 270Bn in aggregate. On an unadjusted basis, this leads to a much higher P/E for SPXImpact of 2020 Earnings Adjustments on IndexP/E, Trailing One-Year as of 12/31/202037.9239.7938.7930.33Nasdaq-100Adjusted P/ES&P 500Unadjusted P/ESource: Nasdaq, Bloomberg, Factset. Data as of 12/31/2020.Unadjusted2020EarningsCompany Name( Bn)EXXON MOBIL CORP-22.2AT&T CORP-5.3OCCIDENTAL PETROLEUM CORP-15.9BRISTOL MYERS SQUIBB-9.0BAKER HUGHES CO-10.1SCHLUMBERGER LTD-10.5BOEING CO-11.8MARATHON PETROLEUM CORP-9.9DELTA AIR LINES INC-12.4MERCK & rnings25.518.511.010.910.98.97.37.37.06.0While these are not technically “recurring” items, they should not beignored. S&P 500 companies also experienced material write-downsin prior market crises (e.g., Energy in 2014-15, Financial in 2008-9)during which Nasdaq-100 companies experienced marginal impacts30
Nasdaq-100 Index: Aggregate Revenues vs. S&P500NDX vs. SPX, Full-Year Revenues, T The aggregaterevenues ofNasdaq-100companiesreached 24%of the totalreported byS&P 500companies in2020 (vs. only7% in 2003)1435%1230%1024%25%820%615%410%27%5%00%2003 2004 2005 2006 2007 2008 2009 2010 2011 2012 2012 2014 2015 2016 2017 2018 2019 2020NDXSource: Nasdaq, Factset. Data as of 12/31/2020.SPXNDX vs. SPX Ratio (rhs)31
Nasdaq-100 Index: Aggregate Earnings vs. S&P500NDX vs. SPX, Full-Year Unadjusted Earnings, B On anunadjustedbasis, theaggregateearnings ofNasdaq-100companiesreached 47% ofthe totalreported by S&P500 n 2020 (vs. only6% in 2003)60%6%00%2003 2004 2005 2006 2007 2008 2009 2010 2011 2012 2012 2014 2015 2016 2017 2018 2019 2020NDXSource: Nasdaq, Factset. Data as of 12/31/2020.SPXNDX vs. SPX Ratio (rhs)32
Nasdaq-100 Index: Aggregate Dividends & YieldFull-Year Dividends Paid ( B)NDX:vs. CASHIndexDividend Yield as of Year-End/ DEBT RATIONDX: DIVIDENDS Apple, Cisco,Amgen, Comcastand others haveincreaseddividends in thelast couple ofyears, and thetrend looks tocontinue withmore 200.20%00.00%DividendsSource: Nasdaq, Factset. Data as of 12/31/2020.Dividend Yield (rhs)33
Nasdaq-100 Index: Aggregate Cash vs. Debt LevelsNDX: DIVIDENDSTotal Cash vs. Total Debt at Year-End, BNDX: CASH / DEBT %CashSource: Nasdaq, Factset. Data as of 12/31/2020.DebtCash to Debt Ratio (rhs)34
A Truly Global ExposureThe Nasdaq-100 tracks a set of companies that tend to be more globally-oriented – by their percentage ofinternationally-derived revenue – than the S&P 500. In aggregate, 38% of NDX sales were international vs. 28% forSPX. The average NDX company is more international, and the index has a lower ratio of purely domestic firmsS&P 500Nasdaq-100% of International SalesConstituent Counts% of International Sales44%40%Constituent Counts37938%28%1218119Int'l % of TotalSalesAverage % Int'l(ex-Domestic)# with Int'l SalesSource: Nasdaq, Factset. Data as of 12/31/2020.# of DomesticOnlyInt'l % of TotalSalesAverage % Int'l(ex-Domestic)# with Int'l Sales# of DomesticOnly35
DisclaimerNasdaq is a registered trademark of Nasdaq, Inc. The information contained above is provided forinformational and educational purposes only, and nothing contained herein should be construed asinvestment advice, either on behalf of a particular security or an overall investment strategy.Neither Nasdaq, Inc. nor any of its affiliates makes any recommendation to buy or sell any securityor any representation about the financial condition of any company. Statements regarding Nasdaqlisted companies or Nasdaq proprietary indexes are not guarantees of future performance. Actualresults may differ materially from those expressed or implied. Past performance is not indicative offuture results. Investors should undertake their own due diligence and carefully evaluate companiesbefore investing. ADVICE FROM A SECURITIES PROFESSIONAL IS STRONGLY ADVISED. 2021. Nasdaq, Inc. All Rights Reserved.36
Nasdaq-100 Index: Performance vs. S&P 500 INDEX PERFORMANCE FROM 2007 TO MARCH 31, 2021 Cumulative total returns through March 31, 2021 were 620% for NDX - approximately 2.5 times the returns of 257% for SPX. INDEX ANNUAL PRICE RETURNS -2021 DATA AS OF MARCH 31 Source: Nasdaq, FactSet, Bloomberg. Data as of 3/31/2021 5