Transcription
Study of Faults and Fractures by Multi-scale Data Integration: A Geological Modeling Case in the Dickman Fieldof Ness County, Kansas State*Jianjun Zeng1, Christopher L. Liner1, Johnny Seal1, Po Geng1, and Heather King1Search and Discovery Article #20171 (2012)**Posted November 30, 2012*Adapted from oral presentation at AAPG Annual Convention and Exhibition, Long Beach, California, April 22-25, 2012**AAPG 2012 Serial rights given by author. For all other rights contact author directly.1University of Houston, Houston, TX (jzeng@mail.uh.edu)AbstractFault and fracture analysis is an important step to guide the 3D reservoir property gridding for the Dickman Filed as a potential CO 2sequestration site. Due to the lack of standard logs and borehole images for such analysis, discontinuity patterns visualized by multipleseismic attributes were displayed in their original geological occurrence and tied to stratigraphic units at the reservoir scale to evaluate theirgeological integrity. The evaluation was based on the understanding of regional deformation history; the distribution patterns offault/fracture zones predicted by a carbonate deformation model; the structural-controlled maturity of karst topography; and the fault andfracture indicators from sparse well logs, core descriptions and measurements.The motion of major faults visualized by the SPICE attribute volume reflects the influence of the latest structural episode. Well tops,thickness and lithology data were used together with seismic images to determine the relative motion of blocks across faults during earlierstructure episodes. Indirect indicators of differential uplifting across faults, such as the relative roughness of karst-topography extracted fromattributes, were also used to restore the multi-episode deformation associated with faults. Possible fractured zones extracted from sixgeometry attributes revealed different vertical and lateral patterns of discontinuity. These patterns were classified into two geometriccategories: the unconfined features penetrating multiple litho-zones; and confined features mostly within an individual litho-zone. Theformer, best viewed by plane-extraction from ANT volumes, are mostly structural and associated with major faults. The latter are mostlynone-structural and best viewed as varying density patterns while marching depth slices of Chaos and Variance volumes. These patterns canbe more indicative of post-depositional changes, and some could be related to the “intra-strata” features observed in the MiddleMississippian cores in nearby Schaben Field.Multi-scale data integration improved the confidence of fault and fracture interpretation based on seismic attributes. Such interpretationshelped in the reconstruction of multi-episode deformation history of the area. Several major NW-trending faults and associated fracturedzones are likely fluid conduits, and a NE-trending fault served as the sealing fault for the hydrocarbon-producing structure.
Selected ReferencesHallberg, G.R., E.A. Bettis, III, and J.C. Prior, 1984, Geologic overview of the Paleozoic Plateau region of northeastern Iowa: IowaAcademy of Science Proceedings, v. 91/1, p. 3-11.Jorgensen, D.G., J.O. Helgesen, and J.L. Imes, 1993, Regional aquifers in Kansas, Nebraska, and part of Arkansas, Colorado, Missouri, NewMexico, Oklahoma, South Dakota, Texas, and Wyoming – Geohydrologic framework: USGS, Professional Paper 1414-B, 72 p.Liner, C., A. Gerstztenkorn, C.F. Li, and J. Smythe, 2004, Spice: A new general seismic attribute: 74 th Annual SEG International MeetingExpanded Abstracts, v. 1, p. 433-436.Marfurt, K.J., 2006, Robust estimates of 3D reflector dip and azimuth: Geophysics, v. 71/4, p. P29-P40.Marshak, S., 2001, Earth; portrait of a planet: W.W. Norton & Company, United States, 735 p.OuYang, J., 1994, Well log interpretations and reservoir descriptions: Book Series on Petroleum Exploration in the Tarim Basin, v. 9, p.235-291.Ramaker, B.J., 2006, Influence of Mississippian Karst Topography on Deposition of the Cherokee Group: Ness County, Kansas: Universityof Kansas, Master’s thesis, 183 p. Web accessed 27 August 08/5544Zeller, D. E., (ed.), 1968, The stratigraphic succession in Kansas: Kansas Geological Survey, Bulletin v. 189, 81 p.
UHJZUHJZ04/11/2011Presenter’s notes: The work is funded by US DOE awards with software donation by Schlumberger, SMT and CMG.1
UHJZUHJZ04/11/2011Presenter’s notes: Fault and fracture analysis was an important part in the 3D modeling of the Mississippian carbonate reservoir and saline aquiferas potential CO2 sequestration targets. This talk will focus on this part of the work flow after a general introduction.2
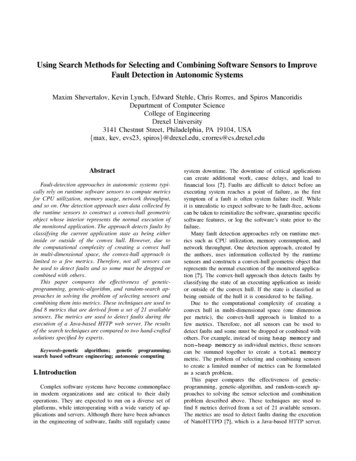
UHJZUHJZ04/11/2011Presenter’s notes: The studied area is the Dickman Field in Ness County, Kansas. The studied strata are representative of the Western InteriorPlains of aquifer, a potential target for CO2 sequestration. Data for this study included two 3D seismic surveys merged together. All wells shown onthis map have Gamma ray logs, 17 wells with neutron porosity logs, five with sonic and two with density logs. Seven wells were cored, with overone hundred porosity/permeability measurements. Four wells on section A-A’ have the full penetration through the entire target stratigraphicwindow.3
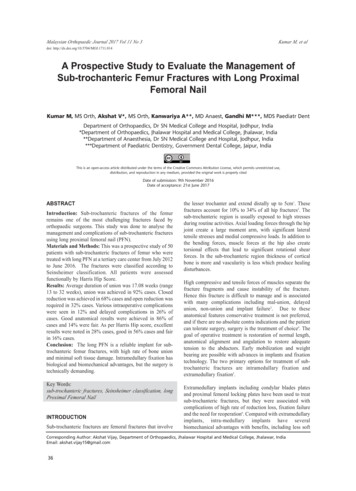
UHJZUHJZ04/11/2011Presenter’s notes: The stratigraphic window hangs on the Fort Scott Limestone of Middle Pennsylvanian age. The reservoirs include theMississippian carbonate below the Miss. Unconformity and a small pay-zone of sandstone and cherty conglomerate from the Basal Penn.channel fill. The reservoirs are bottom-water driven from the underlying Osagian-Gilmore City Limestone saline aquifer. The detailedstratigraphic correlation is shown by both seismic and well logs.4
UHJZUHJZ04/11/2011Presenter’s notes: From top down, the stratigraphic units include Fort Scott Limestone, the Base Penn. channel-fill sandstone above the MISSUnconformity and carbonate reservoirs and saline aquifer between the MISS Unconformity and the Gilmore City Unconformity, with Oil WaterContact in pink. Without dip logs and borehole images, seismic attributes were taken as major tools to start the fault-fracture interpretation.5
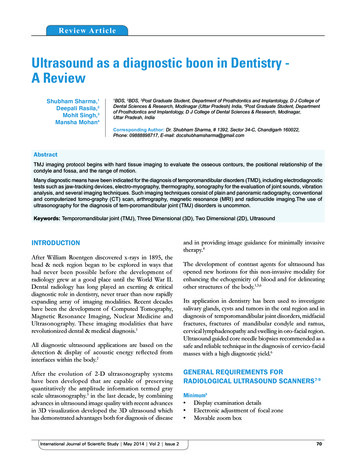
UHJZUHJZ04/11/2011Presenter’s notes: The major six attributes used are: 1. SPICE, based on wavelet transform decomposition and singularity analysis of migratedseismic data, providing a layered model rich in structural and stratigraphic details. 2. ANT based on a 4-step algorithm for mapping subtledisruption of seismic amplitude, resulting in an attribute volume for extracting planes of discontinuity in 3D. 3. Curvature used to visualizesconcave or convex features on seismic reflectors at varying arc-length, or geological scale. Other attributes used include Variance, Coherence,Chaos and local structural dips.6
UHJZUHJZ04/11/2011Presenter’s notes: To bridge the gap between features revealed be attributes at seismic scale and the geological evidences at borehole scale, allattributes volumes were depth-converted based on the five sonic logs (red dots in the map to the left) and corrected by time-depth marker pairs at 17well locations (seismic-log overlay profile in the upper-right). This made it possible to display seismic features in their real geological occurrenceand tied to corresponding stratigraphic units (cross-section correlations on stratigraphic units).7
UHJZUHJZ04/11/2011Presenter’s notes: This in turn enabled us to classify seismic discontinuity patterns into unconfined and confined features relevant to thestratigraphic framework.8
UHJZUHJZ04/11/2011Presenter’s notes: Unconfined features are high angle planes penetrating more than one stratigraphic unit up to the entire stratigraphic window.They were picked easily on SPICE profiles and best visualized by ANT plain extraction (Diagram A). Unconfined features are mostly structuraldue to the brittle deformation of carbonates. Their ideal 3D distribution patterns are shown in Diagram B: mostly bedding-perpendicular, with threeset of orientations relative to the regional stress field. The real distribution pattern, however, become more complicated in the studied areaexperiencing multiple deformation episodes. There are also some features confined within the stratigraphic units – for instance the stylolites due topressure-solution (blue arrows in Diagram B), falling within our category of confined features. Confined features have limited vertical penetration,can be bedding-perpendicular or bedding-parallel, and non-linear or linear in plain view.9
UHJZUHJZ04/11/2011Presenter’s notes: Confined features can be best viewed by walking through depth slices from Variance, Coherence, and Chaos volumes. A linearfeature in Diagram A is about 3000 ft. long (Diagram A, left) but its linearity is visible only from several depth slices. From the vertical profile(Diagram A, right), it is almost bedding-perpendicular with a vertical penetration limited to 60 ft then terminated here. Another type of confinedfeatures revealed by ANT extraction (Diagram B) are with low dip angles, 2-5 degrees and large areas of planes (Histogram and table to right),almost bedding-parallel. Confined features can be structural, like the stylolite in the previous slide, but mostly could be erosional. Some beddingparallel confined planes may be related to carbonate dissolution following the depositional architecture as observed in Osagian carbonates andtermed as “intra-strata” features by other researchers. Some bedding-perpendicular ones may be related to erosion and karst development alongfractured zones. The framework of their lateral and vertical extension is related to the varying karst development stages.10
UHJZUHJZ04/11/2011Presenter’s notes: The block diagram to left shows a conceptual model of three karst development stages and the related topographic features. Inreality those stages rarely occur at the same time and same places, since they reflect temporal or long-term carbonate exposures associated withstructural uplifting or sea-level changes. Stage A. a young stage dominated by vertical features like sinkholes confined between the palaeo-surfaceand palaeo-ground water table, distorting the surface drainage system; Stage B. a mature stage characteristics by both vertical features in A andhorizontal features like caves and tunnels near the palaeo-ground water table, and, Stage C. terminal stage of peneplain with rolling hills andrestored surface drainage system. Different stages can be shown by topographic features on local structure dip maps at Dickman on two seismichorizons: GMC top with a lot of steep-sided vertical features like sinkholes relating to younger stage A-B, and Mississippian Unconformity withrolling hills and a channel bend inheriting the clasped tunnels resulted from much long duration of exposure for erosion, during more mature stageB-C.11
UHJZUHJZ04/11/2011Presenter’s notes: Given the two ideal spatial distribution models for the unconfined and confined features, the next few slides show an examplework flow in faults and fractured zone interpretation.12
UHJZUHJZ04/11/2011Presenter’s notes: Fault interpretation started on the amplitude and SPICE profiles. Some NE-trending or NW-trending discontinuities werepicked from the profiles perpendicular (upper) and parallel (lower) to the present structural axis. The fault in yellow circle is used as an example toshow how to evaluate the geological integrity using attribute volumes and geology data.13
UHJZUHJZ04/11/2011Presenter’s notes: The NW-trending fault shown in the previous slide was best visualized by SPICE profile with an intersecting ANT slice belowthe Mississippian Unconformity indicated by blue dots (Diagram A). The offset on SPICE profile suggests a down-thrown northeast block to theright. However well top data from two wells across the fault trace indicate that the Mississippian strata between the Mississippian Unconformityand GMC is up to 60 feet thicker on the southwest side of the fault (blue well symbol) than to the northeast side of it (black well symbol). This issupported by the thickness isochron between the Mississippian and the GMC Unconformities (Diagram B). Both well data and thickness isochronindicate thinner strata on an up-thrown NE block with stronger erosion. This is in contract to the current fault occurrence formed during the laststructural episode.14
UHJZUHJZ04/11/2011Presenter’s notes: The up-thrown of NE block was supported by indirect evidences. The differential maturity of karst topography exists across thefault trace shown by the density of discontinuity patens or the “relative topographic roughness” on seismic slices shown in Diagram A. On slices ator slightly below the Mississippian Unconformity, the topographic roughness is more significant, with complicated patterns of edges anddiscontinuities on the northeast side compared with the southwest side of the fault trace. On the map of palaeo-topography at the MississippianUnconformity during the deposition of Middle Penn. Strata (B), the relief by down-cutting is the deepest on the immediate northeast side of thisfault. Moving away from the fault trace to NE, the channel shape became less significant as topographic roughness is reduced, until reaching thenext possible NW-trending fault.15
UHJZUHJZ04/11/2011Presenter’s notes: Several NW-trending planes were fund with the same story. Many of them are more visible below the Miss unconformity andmostly disappeared above it (Diagram B, upper). A few of them are visible up to Middle Pennsylvanian strata viewed from the negative curvaturevolume (Diagram B, lower). The same work flow is applied to identify the NE-trending faults that also experienced multiple episodes. The NEtrending ones looked sharper or fresher even in the youngest Pennsylvanian strata. The multi-episode faulting history in the studied area can beattributed to at least three major regional structural episodes around the Central Kansas Uplift.16
UHJZUHJZ04/11/2011Presenter’s notes: Structural episode A (Map A, made by Kansas Geological Survey, Well Top Mapper) is the faulting and up-lifting of theCentral Kansas Uplift (CKU) along major boundary fault zones during the Mid Mississippian to Early Pennsylvanian, probably related to the plateconvergence along the Ouachita Mountains Orogenic Belt. During this event both NW- and NE trending faults in the studied area (within thepurple square) had similar motion of bounding faults of CKU, different from their current occurrences. The event affected more strongly the NWtrending faults parallel to the direction of main compression. Episode B (Map B, mad by Kansas Geological Survey, Well Top Mapper) is thefaulting and uplifting of CKU during the Late Pennsylvania time. This caused not only the thinning of strata (Lancing Group) on top of the CKU,but also abrupt thickness changes across SE boundary faulting zones (Diagram B, blue arrow). Driven by this motion, the NE-trending faults in thestudied area were more active with up-thrown southeast blocks, similar to their present day occurrence. However, the relative movement of theNW-trending fault is not at the similar significance, still with an up-thrown NE block. Episode C (Diagram C) is the formation of the EldrichAnticline, a secondary structure due to the strike-slip motion during the Late Cretaceous and later. Some NW-trending faults could be reversed totheir present day occurrence during this episode or between episodes B and C. The understanding of the faulting history allows us to betterunderstand numerous discontinuity patterns revealed by the seismic attributes.17
UHJZUHJZ04/11/2011Presenter’s notes: This slide shows the results of plane-extraction from the ANT volumes. Starting with over 270 planes, we first filtered them bydegrees of confidence. Then the remaining features penetrating the target stratigraphic window were sort by their dip-angle, strike orientation andvertical penetration and areas. Although closely associated with the unconfined fault planes, many selected features were confined within theMississippian reservoir and saline aquifer zones as indicated by the OWC surfaces.18
UHJZUHJZ04/11/2011Presenter’s notes: Planes with high-confidence were plotted against the Mississippian reservoir top with well locations and well types to seeksupport from well data (3D view to upper right and map view). Evidences includes: electronic logs, drilling time logs, core measurements anddescriptions of core photographs, and reducing water production away from the NW-trending plane according to the 5-year water production recordin Dickman Filed.19
UHJZUHJZ04/11/2011Presenter’s notes: The fractured zones (blue arrows) were shown by log spikes of GR and/or sonic logs associated with highly variable andreversed formation and flushed zone resistivity. For all Mississippian fractured carbonate lithozones, over 80% of (ILD-ILS) values are negativefrom -10 to 0.20
UHJZUHJZ04/11/2011Presenter’s notes: The fractured zones (red circles) were indicated by the sharp drop of, or fluctuations in, drilling time when entering the zonesfrom basal Pennsylvania sand-conglomerates.21
UHJZUHJZ04/11/2011Presenter’s notes: Fractured zones are indicated by the extremely high permeability in cores with similar porosity. The preferred orientations ofselected fractured zones were used to guide the 3D reservoir property modeling. The contact between the Mississippian dolomite and the overlyingPennsylvanian shale is at a 45 degree angle as seen from the core of Well Elmore 1 (Nissen et. al., 2006).22
UHJZUHJZ04/11/2011Presenter’s notes: Summary and conclusions: to improve the geological integrity of fault/fracture interpretation by seismic attributes: we need 1.Depth conversion of seismic attribute volumes for tying seismic features to local stragtigraphic framework at true geological occurences; 2, theunderstanding of spatial distribution models for unconfined and confined features; 3. selections of attribute tools that can best visualize two types offeatures; and 4. Geological evidences from regional to local, and at well-scales to nail down the interpretations.23
UHJZUHJZ04/11/201124
Study of Faults and Fractures by Multi-scale Data Integration: A Geological Modeling Case in the Dickman Field of Ness County, Kansas State* Jianjun Zeng1, Christopher L. Liner1, Johnny Seal1, Po Geng1, and Heather King1. Search and Discovery Article #20171 (2012)** Posted November 30, 2012