Transcription
Using Search Methods for Selecting and Combining Software Sensors to ImproveFault Detection in Autonomic SystemsMaxim Shevertalov, Kevin Lynch, Edward Stehle, Chris Rorres, and Spiros MancoridisDepartment of Computer ScienceCollege of EngineeringDrexel University3141 Chestnut Street, Philadelphia, PA 19104, USA{max, kev, evs23, spiros}@drexel.edu, crorres@cs.drexel.eduAbstractFault-detection approaches in autonomic systems typically rely on runtime software sensors to compute metricsfor CPU utilization, memory usage, network throughput,and so on. One detection approach uses data collected bythe runtime sensors to construct a convex-hull geometricobject whose interior represents the normal execution ofthe monitored application. The approach detects faults byclassifying the current application state as being eitherinside or outside of the convex hull. However, due tothe computational complexity of creating a convex hullin multi-dimensional space, the convex-hull approach islimited to a few metrics. Therefore, not all sensors canbe used to detect faults and so some must be dropped orcombined with others.This paper compares the effectiveness of geneticprogramming, genetic-algorithm, and random-search approaches in solving the problem of selecting sensors andcombining them into metrics. These techniques are used tofind 8 metrics that are derived from a set of 21 availablesensors. The metrics are used to detect faults during theexecution of a Java-based HTTP web server. The resultsof the search techniques are compared to two hand-craftedsolutions specified by experts.Keywords-genetic algorithms; genetic programming;search based software engineering; autonomic computingI. IntroductionComplex software systems have become commonplacein modern organizations and are critical to their dailyoperations. They are expected to run on a diverse set ofplatforms, while interoperating with a wide variety of applications and servers. Although there have been advancesin the engineering of software, faults still regularly causesystem downtime. The downtime of critical applicationscan create additional work, cause delays, and lead tofinancial loss [?]. Faults are difficult to detect before anexecuting system reaches a point of failure, as the firstsymptom of a fault is often system failure itself. Whileit is unrealistic to expect software to be fault-free, actionscan be taken to reinitialize the software, quarantine specificsoftware features, or log the software’s state prior to thefailure.Many fault detection approaches rely on runtime metrics such as CPU utilization, memory consumption, andnetwork throughput. One detection approach, created bythe authors, uses information collected by the runtimesensors and constructs a convex-hull geometric object thatrepresents the normal execution of the monitored application [?]. The convex-hull approach then detects faults byclassifying the state of an executing application as insideor outside of the convex hull. If the state is classified asbeing outside of the hull it is considered to be failing.Due to the computational complexity of creating aconvex hull in multi-dimensional space (one dimensionper metric), the convex-hull approach is limited to afew metrics. Therefore, not all sensors can be used todetect faults and some must be dropped or combined withothers. For example, instead of using heap memory andnon-heap memory as individual metrics, these sensorscan be summed together to create a total memorymetric. The problem of selecting and combining sensorsto create a limited number of metrics can be formulatedas a search problem.This paper compares the effectiveness of geneticprogramming, genetic-algorithm, and random-search approaches to solving the sensor selection and combinationproblem described above. These techniques are used tofind 8 metrics derived from a set of 21 available sensors.The metrics are used to detect faults during the executionof NanoHTTPD [?], which is a Java-based HTTP server.
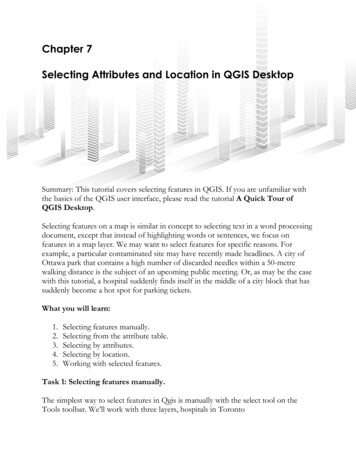
Learning Process DataCreate EnclosureDetection Phase.CollectDatameasurementProcess DataClassify DataFigure 1. During the learning phase, the convex-hull approach collects and processes runtimemeasurements. It then constructs a convex-hull enclosure that represents the normal executionof the monitored system. During the detection phase, runtime measurements are collected andprocessed. Then, each data point (vector of metrics) is classified as normal (gray points) if it isinside the enclosure, or anomalous (white points) if it is outside of the enclosure.The solutions found by the search techniques are targetedto a specific set of 9 seeded faults and are compared toeach other as well as two hand-crafted solutions specifiedby domain experts. This paper illustrates the relative effectiveness of search based software engineering techniquesas well as the solutions proposed by domain experts.The rest of the paper is organized as follows: Section IIpresents the background information on fault detection,specifically the convex-hull method; Section III describesthe search techniques used in this work; Section IV compares the solutions found using search to each other aswell as to the two hand-crafted solutions; finally Section Vstates conclusions and plans for future work.II. BackgroundAutonomic computing is a branch of software engineering concerned with creating software systems capableof self-management [?]. One of the aspects of autonomiccomputing, and the focus of this work, is fault detection.Fault detection is a step toward creating a self-healingsoftware system, meaning a system that is aware whena fault has occurred and can correct it.Existing methods of detecting software faults fall intotwo categories, signature-based methods and anomalybased methods [?]. Signature-based methods detect faultsby matching measurements to known fault signatures.These techniques can be used in static fault-checkingsoftware such as the commercial antivirus softwareMcAfee [?] and Symantec [?], as well as network intrusiondetection systems such as Snort [?] and Netstat [?]. Thesetechniques can also be used to detect recurring runtimefaults [?].If a set of known faults exists, then training a systemto recognize these faults will typically lead to better faultdetection. However, that system is unlikely to recognizefaults it has not seen before. For example, a fault caused bya zero-day virus is unlikely to be detected by commercialantivirus software because there are no known patterns torecognize.Anomaly-based methods learn to recognize the normalruntime behavior of the monitored system and classifyanomalous behavior as potentially faulty. The advantageof using anomaly-based methods is that they can detectpreviously unseen faults. However, they risk incorrectlytreating any newly encountered good states as faulty. Thisoccurs when insufficient training data is supplied to themethod.Typically, anomaly-detection methods begin by collecting sensor measurements of a system that is executingnormally. Then, they construct a representation of themonitored system and compare any future measurementsagainst that representation. A naı̈ve approach will assumethat all sensors are independent and determine the safeoperating range for each of them. In other words, duringthe learning phase, this method will record the maximumand minimum values of each sensor and then classify thesystem as faulty when any of the measurements fall outsideof their determined ranges.While the naı̈ve approach is capable of detecting somefaults, it can fail when the metrics are dependent. Therefore, more sophisticated fault detection techniques assumethat there are dependencies between metrics. Many of thesetechniques employ statistical machine learning [?], [?],[?], [?]. A common approach is to use sensor correlationsto represent a monitored system. During detection, if thecorrelations between sensors become significantly differentfrom the learned correlations, the system is classified to be
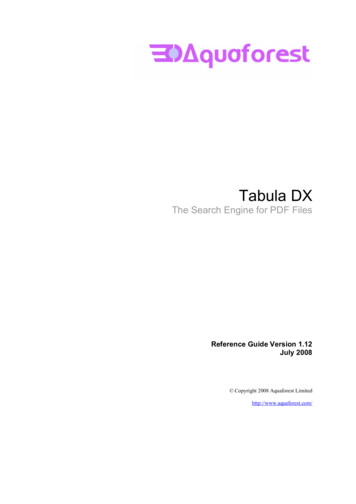
in a faulty state.SA. Convex-Hull Approach to Fault DetectionThe convex-hull method is an anomaly-detectionmethod and, thus, can detect faults not seen before. However, unlike the previously discussed anomaly-detectionmethods, it does not use statistical machine learning.Instead, it uses computational geometry and works wellindependent of whether the metrics are dependent or not.Figure 1 illustrates the phases of the convex-hull faultdetection technique, which consists of a training phaseand a detection phase. During the training phase, thenormal execution behavior of the monitored system ismodeled by constructing a convex-hull enclosure aroundgood measurements (i.e., when faults were not observed).During the detection phase, observed measurements areclassified as normal or anomalous based on whether theyare inside or outside of the convex hull.The convex hull for a finite set of points is the smallestconvex polygon that contains all of the points. A convexpolygon is a polygon such that for every two points insidethe polygon the straight-line segment between those pointsis also inside of the polygon. A convex hull for a finiteset of points in one-dimensional space (one metric) isthe line segment between the largest and smallest values.In two-dimensional space (two metrics) one can think ofeach point as a peg on a board and the convex hull asan elastic band that snaps around all of those pegs. Inthree-dimensional space (three metrics) one can think ofthe convex hull as an elastic membrane that encompassesall of the points.A problem with the convex-hull method, and the reasonfor this work, is that it is computationally expensive toconstruct a hull in higher dimensions given a large setof points. As more metrics are considered, the process ofcomputing the convex hull becomes more time consuming.Once constructed, however, the hull can classify new pointsas in or out at a rate of about 100 classifications a second.The QHull library [?], which this work uses for all of itsconvex hull calculations, is limited to 8 dimensions. Dueto this constraint, a set of sensors must be turned into aset of no more than 8 metrics. The QHull library is thepremier convex hull computational library that is used inmany mathematical tool kits. Even with its limitation to 8metrics, it is still the fastest library for computing convexhulls in higher than 3 dimensions.Evolutionary algorithms [?] have shown promise infinding good solutions in a large space of potential answers. Evolutionary algorithms begin their process byconstructing a random population of answers. Next theyevaluate all of the solutions using a fitness function. Thepopulation is then recombined via a breeding process toconstruct the following generation. Given a new population-3 16 81562041011Figure 2. The chromosome is represented asa tree structure. It has three types of nodes: aroot node (black); an expression node (gray);and a terminal node (white).the process is repeated until some acceptable answer isfound.Given the problem of selecting and combining sensormeasurements into metrics, our conjecture was that an evolutionary algorithm would find a good solution. The searchspace is large and the dependencies between differentsensors is not known. For these and other reasons, whichwill become clear further in the paper, an evolutionaryalgorithm was chosen as the start of our work.In our previous paper [?], we compared the convex hullapproach to several statistical approaches with favorableresults. During that work we selected metrics based onour intuition. This extends that work and attempts to finda better set of metrics using search based techniques.III. Search TechniquesThe search library used in this work was implementedusing the Ruby programming language [?]. While it wasinitially developed as a GP library, it supports GA andrandom search as special cases of the GP.The description of the library used to find a solution isseparated into the following parts: Section III-A presentsthe chromosome representation; Section III-B describeshow the initial population is created; Section III-C presentsthe process of evaluating a population of chromosomes;finally Section III-D describes how new populations aregenerated.A. Chromosome RepresentationFigure 2 illustrates the chromosome representation as atree structure. Each chromosome represents a function that
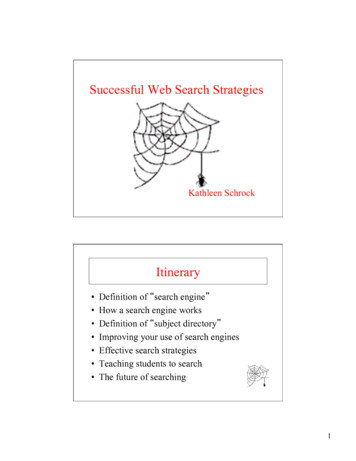
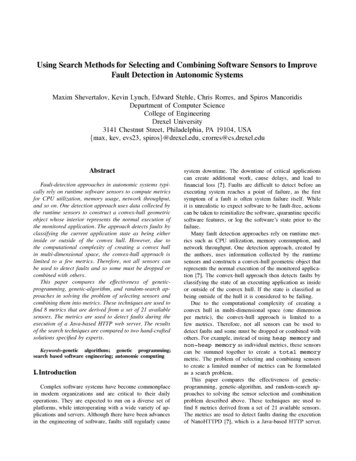
TERMINAL {1 2 3 . 21}UEXP {- EXP}Machine AJVMSensor SuiteNanoHTTPDBEXP {- EXP EXP EXP EXP}EXP {UEXP DEXP TERMINAL}S {s EXP EXP EXP EXPEXP EXP EXP EXP}Figure 3. The grammar used to generatethe initial random population. Generation begins with the S rule and proceeds until allbranches end with a TERMINAL node.accepts a set of 21 sensor measurements as input and produces a set of 8 metrics as output. The tree is constructedusing one of four nodes. The root node has 8 branches,one for each metric. Binary operation nodes canbe either addition or subtraction. Unary operationnodes negate the subtrees linked from them. Terminalnodes contain the ID value of a sensor.Using the tree structure to represent the entire solution, as opposed to each metric individually, allows thealgorithm to consider how metrics are related to eachother. Simply finding the best eight metrics independentof each other does not lead to good results because manyof the metrics are dependent and tend to have similarclassification effectiveness.Note that if the root node is forced to decomposedirectly into terminal nodes, the problem changesfrom a GP trying to evolve 8 metric formulas to a GAtrying to find the optimal subset of 8 sensors.B. Creating the Initial PopulationThe initial population is created using the grammar [?],[?] of prefix expressions presented in Figure 3. The production begins with the root node, which is expandedinto 8 EXP nodes. When expanding a node with severaloptions, one of the options is chosen at random. Once allof the productions are expanded into TERMINALS, thegenerated abstract syntax tree (AST) is simplified into thechromosome format, as demonstrated by Figure 2.It has been shown that restricting the tree height ofthe initial chromosomes can lead to good convergencerates [?]. Therefore, the initialization accepts in a parameter k that specifies the maximum height of a randomtree. When a branch of the tree being generated reaches aheight k, the generation algorithm automatically choosesa terminal node. Because each production, exceptEXP, is expanded into an EXP, which has a productionTERMINAL as one of its options, the generated AST isMonitorDBMachine BClient1Client2.ClientnFigure 4. The experimental testbed containstwo machines. The first is used to run NanoHTTPD and the autonomic framework. The second houses clients that access NanoHTTPD.guaranteed to have a maximum height of k 1.C. Evaluating a PopulationA chromosome represents a function that translates apoint in 21-dimensional space into a point in 8-dimensionalspace. Each chromosome is evaluated based on how wellit can classify data collected during the execution ofNanoHTTPD as normal or anomalous. To perform thisevaluation three data sets are needed. The first set, labeledas the training set, is a set of points used to constructa convex hull that represents normal execution. The secondset, labeled as the normal set, is a set of pointscollected during the normal execution of NanoHTTPD.These points are not part of the training set andare used to determine the false positive rate. A falsepositive occurs when a point known to have been sampledduring the normal execution of NanoHTTPD is outsideof the convex hull and is therefore falsely classified asan anomaly. The third set, labeled as the error set,is a set of points collected during the faulty executionof NanoHTTPD. These points are used to determine thefalse negative rate. A false negative occurs when a pointknown to have been sampled during the faulty execution ofNanoHTTPD is inside of the convex hull and is thereforeincorrectly classified as normal. The normal and theerror sets are divided into two subsets. The first is usedduring the training phase and second is used to evaluatethe final result.To create the three data sets described above, a casestudy using NanoHTTPD was conducted. Figure 4 presentsthe design of the testbed used in this case study. Onemachine is used to host NanoHTTPD and Aniketos, our autonomic computing framework. Another machine managesclients that request resources from NanoHTTPD. A JVMsensor suite is used to monitor NanoHTTPD’s executionand report measurements to the monitoring server. The
monitoring server stores the gathered data and processesit using the QHull library [?].NanoHTTPD was chosen for this case study becauseit is open source and manageable in size, thus making iteasy to modify and inject with faults. It is a web server thathosts static content. NanoHTTPD spawns a new thread foreach HTTP client request. If a thread crashes or goes intoan infinite loop, it does not compromise NanoHTTPD’sability to serve other files.The goal of this case study is to replicate realisticoperating conditions. To this end, it uses resources andaccess patterns of the Drexel University Computer ScienceDepartment website. Nine weeks worth of website accesslogs were collected and all resources accessed in thoselogs were extracted and converted into static HTML pages.Out of the nine weeks of logs, three weeks were chosen atrandom to be used in the case study. These were replayedagainst the statically hosted version of the website andprovided the case study with realistic workload accesspatterns.One week of request logs was used to create thetraining set. Another week of request logs was usedto create the normal set. A third week of requestlogs was used as background activity during the faultinjection experiments, thus creating the error set. Allmeasurements were normalized such that each metric’svalue ranged between 0 and 100.NanoHTTPD was injected with nine faults. These faultsrepresent coding errors, security vulnerabilities, and attacks. Two of the most common coding errors are theinfinite-loop and the infinite-recursion faults. An infiniteloop fault is presented as a while loop that iteratesindefinitely. Two versions of this fault were created. One,where each iteration of the loop does nothing, and thesecond, where each iteration of the loop performs a sleepoperation for 100ms. The goal of the slow-infinite-loopfault is to create a more realistic scenario during which aninfinite loop is not overwhelming the CPU. Similar to theinfinite-loop fault, the infinite-recursion fault also has twoversions, a regular and a slow one that performs a sleepoperation for 100ms. An infinite recursion is presented asa function calling itself until the thread running it crashesdue to a StackOverflowError exception.Another fault injected into NanoHTTPD was thememory-leak fault. Two versions of this fault were created.The first version performed a realistic memory leak andleaked strings containing the requested URLs by addingthem to a vector stored in memory. The second versionof the memory-leak fault doubled the size of the leakvector with each request.Log explosion [?] is another problem common to theserver environment and was injected into NanoHTTPD.The log-explosion fault causes NanoHTTPD to write to alog file continuously until there is no more space left onthe hard drive. While this does not cause the web serverto crash, the log-explosion fault does cause a degradationin the performance of the server.In addition to faults due to coding errors, two securityattacks were perpetrated against NanoHTTPD. In the first,NanoHTTPD was injected with a spambot trojan [?]. Oncetriggered, the spambot began to send spam email messagepackets to an outside server at a rate of 3 email messagesper second. Each message was 1 of 3 spam messageschosen at random. The messages varied in length between166 and 2325 characters each.The second attack perpetrated against NanoHTTPDwas a denial of service (DOS) attack [?]. During theDOS attack several processes that continuously requestedresources from NanoHTTPD were launched from twoseparate machines. The attack escalated with about 100new processes created every second. It continued untilNanoHTTPD could no longer process valid user requests.Each fault was triggered by a specific URL request.For example, the memory leak fault was triggered byaccessing the “/memleak” resource via a web browser.Faults were triggered after a minimum of 1 minute of faultfree execution.The entire case study took about three weeks to execute.Most of that time was spent executing fault-free experiments and the memory-leak experiment. While all otherfault experiments took only a few minutes, the memoryleak fault took several hours before NanoHTTPD failedirreversibly.Given these 3 data sets, the fitness of the chromosomewas calculated using the following function:c"a !f (x) 1 bdWhere x is the chromosome being evaluated, a is thenumber of points from the normal set classified asinside the hull, b is the total number of points in thenormal set, c is the number of points from the errorset classified as inside the hull, and d is the total numberof points in the error set. The function will return amaximum value of 2.0 if every point is classified correctlyand a minimum value of 0.0 if every point is misclassified.Note that this fitness function weights the false-positiveand false-negative rates equally.Using the error data in selecting a set of metrics altersthe goals of Aniketos slightly. While this does not completely transform it from an anomaly detection approach toa signature based approach, it certainly uses the faults as aguide. As one of the goals of this work was to evaluate theperformance of expertly chosen metrics, this modificationis acceptable.Once collected, the three data sets had to be randomlysubsampled because at their original size the QHull librarytook too long to compute the convex hull. The originaltraining set contained 604,800 sample points, andwas randomly subsampled down to 18,000. This dramatically decreased the hull computation time from several
hours to several minutes in the average case. Note that anew hull has to be computed for each chromosome in apopulation. Therefore, without subsampling, an applicationof search algorithms would have been infeasible.However, even when using a reduced set, the timeto compute the convex hull varied from a few secondsto several minutes. Therefore, any evaluation that tookover 10 minutes was stopped and that chromosome wasgiven a fitness value of 0. This effectively bred out slowchromosomes and consequently the evaluation sped upwith each generation.To further speed up the evaluation process it wasdistributed over several computation nodes. Five serverswith 16 cores each were available for our use. Becausethe servers are a shared resource, the number of availablecomputation nodes varied between 30 and 80. At itspeek performance, the algorithm was able to evaluate ageneration every nine minutes, on average.Because the QHull library was written in C, the evaluation function was wrapped in a C program that tookthe chromosome and 3 data sets as input and producedthe value of the chromosome as the output. The maincontroller was implemented in Ruby and used the providedSSH library to distribute the work across several machines.The Ruby process was initialized with the requiredinformation to form an SSH connection to each of the computation nodes. Then, during evaluation, a pool of availablenodes was maintained. To evaluate a chromosome, a nodefrom the pool was chosen. Given the node, Ruby created agreen thread, meaning a thread managed by the Rubyinterpreter, and used the SSH library to connect tothe machine that hosted the computation node. Once theconnection was made, the Ruby process created a newprocess on that node and executed the C program used toevaluate a chromosome. The process was set to timeoutafter 10 minutes. When the computation was complete, orstopped due to a timeout, the reference to that node wasplaced back into the pool to be reused.In addition to the time constraints, not all chromosomesproduced a training set that could be turned into an8 dimensional hull. The QHull library expects the datato have dimensionality, meaning that the produced hull isexpected to have a non-zero width in every dimension.Given the nature of the produced solution it is likelythat a chromosome may reduce the original 21-dimensiontraining set so that the 8-dimension training setbreaks the dimensionality constraint. This occurs when ametric has no width, or two or more metrics are correlatedwith one another. Any chromosome that produced a set thatcould not be used to create a convex hull was replaced by anew one. The new chromosome was computed randomlyif it replaced a chromosome during the first generationand bred if it replaced a chromosome during ildrenc1c2pnPopulationi 1c1 c2 c3 c4 c5 c6 c7 c8 c9.cnFigure 5. The breeding process to produce anew (i 1) population. Parents are selectedvia roulette wheel selection and bred 95% ofthe time. The children chromosomes are thenmutated 1% of the time before being placedinto the next generation.D. Generating a New PopulationA new generation of 100 chromosomes is bred viathe process in Figure 5. Parents are chosen via roulettewheel selection. A fitter chromosome will have a higherprobability in being selected. Once selected and bred,chromosomes are placed back into the population so thatthey can be selected again.Two selected chromosomes are bred with a probabilityof 95%, otherwise they are passed into the new populationunchanged. The breeding function is a modified singlecross-over function. Given that the root node points to8 subtrees, if a traditional single cross-over function wasused, most of the changes would occur in the metrics withmany branches, leaving metrics that contained a singlesensor unmodified. For example, consider a chromosomein which 6 out of 8 metrics led to a single sensor, whilethe other two had complicated functions with 20 uniquebranches each. In this case, the probability of choosing across-over point that modified one of the 6 single sensormetrics would be only 12%.The modification added to the single cross-over functionis that two metrics, one from each chromosome, are firstchosen at random. These represent one of 8 subtreesdirectly under the root node. Once the subtrees areselected a cross-over operation is performed using thosesubtrees. The links from the root node to either of thesubtrees are considered during the cross-over, therefore an
Training score1.9901.9931.9881.990false positive1.0%0.6%1.2%0.9%false alse positive0.8%1.3%0.8%1.0%false .7%false positive1.3%3.8%2.9%false .4%false positive1.4%1.3%1.4%false alse positive4.0%3.7%4.1%3.9%false false positive0.3%0.6%0.3%0.4%false negative31.4%31.2%31.4%31.3%Table I. The fitness of the best chromosomes discovered using various search techniques. Handcrafted1 is the result when using 7 metrics provided by a software engineer. Handcrafted2 is the result when using 6metrics provided by a system administrator.entire tree can be exchanged.Once the new chromosomes are generated, they aremutated with the probability of 1%. If a mutation operationoccurs, a node in the chromosome is chosen at random andmodified. If the selected node is a binary operatornode, it is replaced by a new binary operatornode chosen at random and based on the provided grammar. If the selected node is a negation operator, thenode is removed from the tree. If the selected node is aterminal node, it is replaced by a new terminalnode chosen at random and based on the grammar.IV. Search Algorithms EvaluationTable I illustrates the results of several search experiments and compares these results to two handcrafted solutions. Due to the time constrains described in Section III,the training set had to be sub-sampled. In order to verifythe results, three different sub-sampled sets were used inthese experiments. Each training set was generated bychoosing 18,000 points randomly from the full trainingset.Four different search experiments were conducted aspart of this work. All experiments were stopped after 12hours of execution and the best solution found by each ispresented in Table I. The first, labeled Arithmetic inTERMINAL {1 2 3 . 21}EXP {TERMINAL}S {s EXP EXP EXP EXPEXP EXP EXP EXP}Figure 6. A modification of the original grammar from Figure 3, changes the problem froma GP to a GA.Software EngineerTotal CPU TimeThread CountTCP Bytes Read TCP Bytes WrittenNumber of Open TCP Accept SocketsLoaded Class CountHeap Memory Non-heap MemoryAverage Stack DepthSystem AdministratorTotal CPU TimeThread CountTCP Bytes Read TCP Bytes WrittenNumber of Open TCP Accept SocketsNumber of Closed TCP Accept SocketsDaemon Thread CountFigure 7. Metrics developed by the domainexperts. The software engineering expert isone of the the authors of this paper. Thesystem administrator expert is the managerof the computing resources for Drexel University’s Computer Science department.Table I finds the solution via the GP search described inSection III. The second, labeled Subset Selection,solves the subset selection problem using the same algorithm as the GP with a different grammar. The grammar is altered such that the root
McAfee [?] and Symantec [?], as well as network intrusion detection systems such as Snort [?] and Netstat [?]. These techniques can also be used to detect recurring runtime faults [?]. If a set of known faults exists, then training a system to recognize these faults will typically lead to better fault detection. However, that system is unlikely .