Transcription
Ecological Applications, 12(5), 2002, pp. 1344-1363 2002 by the Ecological Society of AmericaLAND USE HISTORY, ENVIRONMENT, AND TREE COMPOSITIONIN A TROPICAL FORESTJILL THOMPSON,1 NICHOLAS BROKAW,1 JESS K. ZIMMERMAN,1 ROBERT B. WAIDE,2 EDWIN M. EVERHAM III,3D. JEAN LODGE,4 CHARLOTTE M. TAYLOR,5 DIANA GARCÍA-MONTIEL.6,8 AND MARCHETERRE FLUET7,9Institute for Tropical Ecosystem Studies, University of Puerto Rico, P.O. Box 23341,San Juan, Puerto Rico 00931-3341 USA2 LTER Network Office, Department of Biology, University of New Mexico, Albuquerque, New Mexico 87131-1091 USA3 Environmental Studies, College of Arts and Sciences, Florida Gulf Coast University,19501 Treeline Avenue South, Fort Myers, Florida 33965-6565 USA4 USDA Forest Service, Center for Forest Mycology Research, Forest Products Laboratory,P.O. Box 1377, Luquilo, Puerto Rico 00773-1377 USA5 Missouri Botanical Garden, St. Louis, Missouri 63166 USA6 Department of Biology, University of Puerto Rico, P.O. Box 23360, San Juan Puerto Rico 00931-3360 USA7 Harvard Forest, P.O. Box 68, Petersham, Massachusetts 01366 USA1Abstract. The effects of historical land use on tropical forest must be examined tounderstand present forest characteristics and to plan conservation strategies. We comparedthe effects of past land use, topography, soil type, and other environmental variables ontree species composition in a subtropical wet forest in the Luquillo Mountains, Puerto Rico.The study involved stems 10 cm diameter measured at 130 cm above the ground, withinthe 16-ha Luquillo Forest Dynamics Plot (LFDP), and represents the forest at the timeHurricane Hugo struck in 1989. Topography in the plot is rugged, and soils are variable.Historical documents and local residents described past land uses such as clear-felling andselective logging followed by farming, fruit and coffee production, and timber stand improvement in the forest area that now includes the LFDP. These uses ceased 40-60 yrbefore the study, but their impacts could be differentiated by percent canopy cover seenin aerial photographs from 1936. Using these photographs, we defined four historic coverclasses within the LFDP. These ranged from cover class 1, the least tree-covered area in1936, to cover class 4, with the least intensive historic land use (selective logging andtimber stand improvement). In 1989, cover class 1 had the lowest stem density and proportion of large stems, whereas cover class 4 had the highest basal area, species richness,and number of rare and endemic species. Ordination of tree species composition (89 species,13 167 stems) produced arrays that primarily corresponded to the four cover classes (i.e.,historic land uses). The ordination arrays corresponded secondarily to soil characteristicsand topography. Natural disturbances (hurricanes, landslides, and local treefalls) affectedtree composition, but these effects did not correlate with the major patterns of speciesdistributions on the plot. Thus, it appears that forest development and natural disturbancehave not masked the effects of historical land use in this tropical forest, and that past landuse was the major influence on the patterns of tree composition in the plot in 1989. Theleast disturbed stand harbors more rare and endemic species, and such stands should beprotected.Key words:biodiversity; conservation; disturbance; land use history; Luquillo ExperimentalForest; Puerto Rico; soil; species diversity; topography; tree community; tropical forest.I N TR O D U C T I O N"An ecosystem is a historical construction, so complex that any actual state has a negligible a priori prob,ability" (Margalef 1968:30). Nonetheless, if one knowsthe details of an ecosystem's history, and how environmental factors such as soil and topography influenceManuscript received 27 November 2000; revised 3 I August2001: accepted 6 September 2001; final version received 21 December 2001.8 Present address: Woods Hole Ecosystems Center, 7 MBLStreet, Woods Hole. Massachusetts 02543 USA.9 Present address: Metropolitan District Commission. Natural Resources Section. P.O. Box 628. Belchertown. Massachusetts 01007 USA.structure and composition, much of that ecosystem'spresent state can be understood. This approach has successfully explained characteristics of temperate and boreal forests where there are adequate data on both historical land use and environment (Glitzenstein et al.1990, Foster 1992, Hörnberg et al. 1999, Motzkin etal. 1999). For tropical forests, also, there is informationon past land use (Gordon 1982, Bush and Colinvaux1994, Burslem et al. 1998) and detailed descriptions ofpresent stand characteristics and environments (e.g.,Dallmeier and Comiskey 1998). Few tropical studies,however. have synthesized land use and environmentto explain present stand characteristics (Clark et al.1995, Zimmerman et al. 1995). and history has often1344
October 2002LAND USE HISTORY IN A TROPICAL FORESTbeen ignored in tropical forest research (Clark 1996.Whitmore and Burslem 1998).In this paper, we evaluate the relative influence ofpast land use vs. environment on the present tree composition of a tropical forest in Puerto Rico, and weassess the implications of our results for conservationof biodiversity. At issue are such questions as: Howlong do the effects of land use persist after those usesend? Do environmental features such as topographyand soil override past land use in determining tree composition? How do different past land uses affect presentspecies diversity? The answers to these questions mayhelp us to understand the present species compositionand assess its stability, in order to predict and managefuture forest composition in the face of disturbance andchange (Lugo 1995).Environmental factors such as soil and topographyare well known to affect individual tree species, community composition, forest structure, and dynamics(Ashton 1969, Newbery et al. 1986, Baillie et al. 1987,Duivenvoorden 1996). In Puerto Rico, for example, thetree Dacryodes excelsa (see Table 1 for botanical authorities) is often found on ridges and Inga spp. oftenoccur along streams (Crow and Grigal 1979, Basnet1992, Scatena and Lugo 1995). Tropical forest heightand canopy dynamics also reflect soil and topography(Hartshorn 1978, Jans et al. 1993, Poorter et al. 1994).In Puerto Rico, for instance, streamside forest has moretreefall gaps than does forest in other topographic settings (Scatena and Lugo 1995).The effects of land use are less well studied thanenvironmental factors. Prehistoric land uses are inferred from the presence of soil charcoal and archaeological artifacts (Sanford et al. 1985, Piperno 1990,Horn and Sanford 1992, Taylor et al. 1999). These landuses still affect general forest composition (e.g., Gómez-Pompa and Kaus 1990, Peters 2000), but preciseeffects are obscure (Lambert and Arnason 1982). Thedisturbance from human impacts that ended a few centuries ago is implied from the present abundance oflong-lived secondary tree species (Hartshorn 1980,Bush and Colinvaux 1994, Burslem et al. 1998, Proctorand Miller 1998). Human activity in the past century,however, readily explains details of forest structure andcomposition (Foster and Brokaw 1982, Saldarriaga etal. 1988, Clark et al. 1995). In Puerto Rico, the effectsof past land use on present forests have been demonstrated at the landscape scale (Thomlinson et al. 1996,Foster et al. 1999), in recently abandoned agriculturalareas (Zimmerman et al. 1995. Aide et al. 1996). andwithin forest stands (García-Montiel and Scatena1994). However, the relative effects of past land usesvs. the effects of environmental factors such as topography and soil on tree species composition and diversity are not well known, in Puerto Rico or elsewherein the tropics.Besides our forest study plot in Puerto Rico. thereare a number of other large tropical forest plots in1345which environment and species composition are wellunderstood (Condit 1995). Unlike our plot. however.these others have been little affected by humans. Inorder to weigh the relative impacts of land use vs.environment on tree composition, our study exploitsan unusual combination of detailed information on landuse history, environment, natural disturbance, and species distributions in a tropical forest stand. Althoughunusual in detail, the features of this stand have broadrelevance because the land uses and environmental factors that influence this forest are widespread (Beard1944, Perfecto et al. 1996, Grieser Johns 1997, Kellmanand Tackaberry 1997, Lugo et al. 1999).M ETHODSStudy area and siteThis study was conducted in the University of PuertoRico’s El Verde Research Area (18 20' N, 65 49' W)in the Luquillo Experimental Forest, Luquillo Mountains, Puerto Rico (Waide and Reagan 1996). In vegetation and topography, the Research Area is typicalof the tabonuco forest zone (below 600 m elevation)in the Luquillo Mountains (Brown et al. 1983, Lugoand Scatena 1995) and is in an area of forest that hassuffered from human disturbance (Foster et al. 1999).The forest is classified as subtropical wet in the Holdridge life zone system (Ewel and Whitmore 1973) andtropical montane in Walsh’s (1 996) tropical climatesystem. The forest type is locally named “tabonucoforest,” after a dominant tree, Dacryodes excelsa.Rainfall at the field station averages 3500 mm/yr.March and April tend to have less rainfall than othermonths, but there is usually no month with 200 mm(Brown et al. 1983).The study site was the 16-ha (320 500 m) LuquilloForest Dynamics Plot (LFDP; southwest corner at18 20' N, 65 49' W) which is part of the Luquillo Experimental Forest Long-Term Ecological Research(LTER) program and the Center for Tropical ForestScience network of forest plots. Establishment of theLFDP began in June 1990, when it was professionallysurveyed and PVC posts were sited to divide the plotinto 400 20 20 m quadrats. Each quadrat was thendivided into 16 5 5 m subquadrats. The south edgeof the LFDP was located 35 m from the “radiationcenter” used in the Rain Forest Project (Odum andPigeon 1970), and the radiation in 1963 may have damaged a few small trees at the edge of the plot. TheLFDP was previously known as the “Hurricane Recovery Plot” (HRP; Zimmerman et al. 1994).In this paper, we analyze the LFDP tree communityas it was at the time Hurricane Hugo struck the forestin 1989. Hurricanes have severely damaged forest inthe Luquillo Mountains every 50-60 yr, on average,in the past few centuries (Scatena and Larsen 1991).This includes hurricanes in 1928 and then in 1932, 57yr before the present study. Other natural disturbances
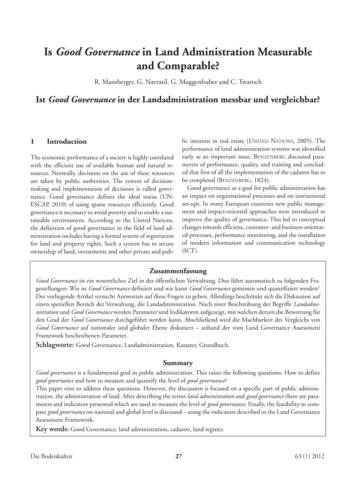
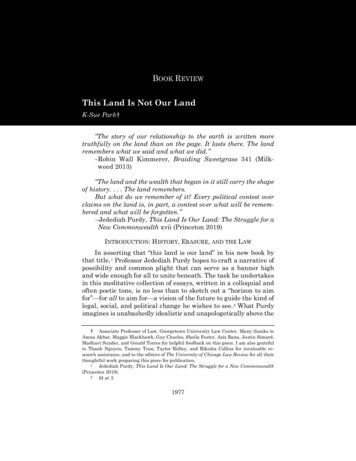
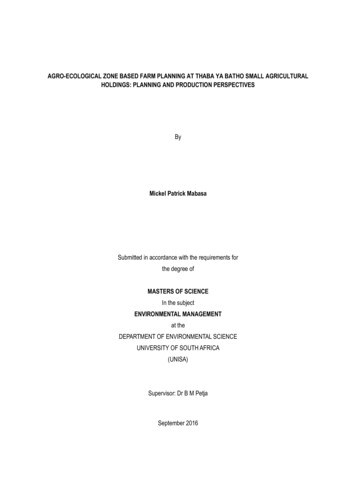
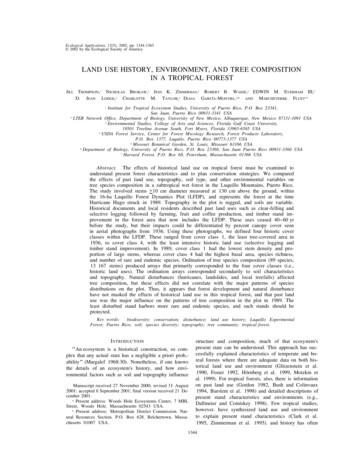
1346Ecological ApplicationsVol. 12, No. 5JILL THOMPSON ET AL.FIG. 1. Topographic map of the 16-ha Luquillo Forest Dynamics Plot (LFDP) at El Verde, Puerto Rico. The grid showsthe altitude of the 20 X 20 m quadrats with interpolations of the 5 5 m subquadrats. (Modified from Willig et al. [1996],copyrighted 1996 by the Association for Tropical Biology, PO. Box 1897, Lawrence, Kansas 66044-8897. Reprinted bypermission.)in Luquillo forests include small-scale treefalls unrelated to hurricanes, landslides, and flood damage alongstreams (Guariguata 1990, Scatena and Lugo 1995).Elevation, topography, and soilsTopography on the LFDP includes northwest-running drainages that form steep northeast- and southwest-facing slopes (Fig. 1). Elevation ranges from 333m a.s.l. at the northern end of the LFDP to 428 m atthe south. The elevation for each 20 20 m quadraton the plot was calculated as the mean of the surveyedelevations for the four quadrat corners. The percentageslope of each quadrat was also derived from cornerelevations. Slopes are steeper at the higher, southernend of the LFDP. Each quadrat was assigned to one offour topographic classes (valley, slope, bench, or ridge)based on the predominant class in each quadrat as determined from the topographic map. Slopes were designated when 15%, whereas benches were defined asrelatively flat areas not associated with valleys or ridgetops.The Soil Survey Staff of the U.S. Department ofAgriculture surveyed LFDP soils using qualitative observations, surface sampling along transects, randomlyselected plots. and I m deep randomly located soil pits(Soil Survey Staff 1995). Results from that survey wereinterpolated to form a picture of the soils across theLFDP. Using the soil map, we assigned a soil type (Fig.2) and a code for percent rock cover to each 20 20m quadrat, based on the predominant soil in each quadrat. All the soils are formed from volcaniclastic sandstone. Zarzal, Cristal, and Prieto clays on the LFDPare deep. Coloso and Fluvaquents are formed from alluvium in the stream channels. Zarzal covers 67% ofthe LFDP, Cristal 22%, Prieto 6%, Fluvaquents 4%,and Coloso 1 %. Zarzal clay covers most of the northernand southern parts of the LFDP, with Cristal in themiddle and east. Zarzal has low fertility, Cristal andColoso low to moderate, Prieto moderate, and Fluvaquents moderate to high (Soil Survey Staff 1995). SoilpH values are: Zarzal 4.8, Cristal 5.0, Coloso 5.1, Prieto 5.4, and Fluvaquents 6.1. The sequence Zarzal, Cristal, Prieto, Coloso, and Fluvaquents represents a gradient of increasing wetness and poor drainage (SoilSurvey Staff 1995).Land use historyInformation on the history of land use in and aroundthe LFDP came from several sources, including interviews, public documents, forest surveys, and aerialphotographs. In the early 1990s, we interviewed localresidents to determine the land use history of El Verdeforest and, in particular, El Verde Tract 11 in whichthe LFDP is now located (García-Montiel 2002). First
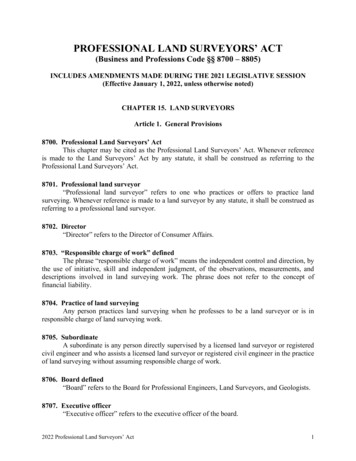
October 2002FIG. 2.Rico.LAND USE HISTORY IN A TROPICAL FOREST1347Distribution of soil types and perennial streams in the 16-ha Luquillo Forest Dynamics Plot at El Verde, Puertowe spoke with Alejo Pinto Estrada, who had lived inthe area all his life and was manager of El Verde FieldStation. He introduced us to other lifelong residents ofthe area whom we questioned generally about past landuse. We corroborated their information using the Archives Generales de Puerto Rico (1854, 1865, 1866,1885, 1905), follow-up interviews with the originalinformants, and interviews with other residents.Gerhart (1934) conducted a cruise survey in 1934and collected information on El Verde Tract 1 1 (inwhich the LFDP is located) while the USDA ForestService was considering it for purchase. The surveyorswalked magnetic east-west transects 100 in apart and20 m wide. assessing the timber value and describingthe condition of the vegetation in qualitative terms suchas “cutover,” “culled,” or “virgin.” These descriptions were standard forestry survey terms that essentially mean substantial tree removal (cutover), selectivelogging (culled), or minor human disturbance (virgin:not recorded where the LFDP is now located). Otherobservations recorded by Gerhart (1934) included thepresence of coffee and qualitative state of tree regeneration. Odum (1970) described the activities of theForest Service after El Verde’s purchase in 1934.Assessment of’ historical canopy cover fromaerial photographsTo look for evidence of past land use, we analyzedaerial photographs of the Luquillo Experimental Forestarea taken in 1936 (Foster et al. 1999). Using the pho-
Ecological ApplicationsVol. 12, No. 5JILL THOMPSON ET AL.1348tographs. we divided the LFDP into four sections according to apparent percent canopy cover in 1936. Canopy cover classes were defined as: cover class 1( 20%), cover class 2 (20-50%), cover class 3 (5080%), and cover class 4 ( 80%). We designated each20 20 in quadrat according to its cover class. Quadrats straddling the boundaries between cover classeswere assigned to the predominant cover class in thatquadrat. Cover classes were also assigned on a 5 5m subquadrat scale for use in species accumulationcurves. When designating the canopy cover class. wedid not distinguish between cover of planted trees vs.natural forest.Inventory of stemsWe identified, tagged. and mapped to the nearest 0.5m (within 5 5 m subquadrats) all self-supportingwoody stems 10 cm D130 (diameter at 130 cm aboveground; D130 avoids the ambiguity of "breast height"[Brokaw and Thompson 2000]) in the LFDP. The diameters of leaning or prone stems were measured at130 cm along the trunk from the rooting point. Thesemethods generally followed Condit (1998), with theexception that if a tree had multiple stems 210 cm D130originating at a height 130 cm above the ground, wetagged and measured the diameter of each stem separately. In this paper, we used either the number of separate stems 10 cm D130 or individual trees (whichmight have more than one stem 10 cm D130), as required for the different analyses that we will describe.Trees were identified by sight in the field or fromvoucher specimens (see Table 1 and the Appendix forspecies names). Botanists at the University of PuertoRico, Missouri Botanical Garden, and New York Botanical Garden identified vouchers, which are depositedat El Verde Field Station and New York Botanical Garden. Nomenclature follows Liogier (1985, 1988, 1994,1995, 1997), except that we used Henderson et al.(1995) for palms.The plot census started in 1990, the year after Hurricane Hugo (September 1989). In order to reduce theloss of information through tree mortality and decomposition after the hurricane, we made a rapid inventorybetween September 1990 and February 1991 of steins( 10 cm D130) that had been damaged and/or apparentlykilled by Hurricane Hugo. An inventory of all livestems ( 10 cm D130) on the LFDP started in June 1990and continued until February 1992. Together, these inventories constitute the first census of the LFDP forstems 10 cm D130, and we believe that these datarepresent the tree community as it would have been atthe time of Hurricane Hugo. In later inventories (afterFebruary 1992). we found some large ( 10 cm D130)unrecorded stems that we suspect, because of their size,may have been overlooked in the tangle of hurricanedamage during the first census. Using the individualgrowth rate of these stems (if they had been measuredmore than once), or the species-specific median growthrate (for stems 10-30 cm D130), we calculated the probable size of these unrecorded stems at the time of thefirst census. If a stem would have been 10 cm D130at the time of the first census, we included the stem inthe first census data (the estimated diameters were alsoused to calculate basal area. Although adding"missed" sterns produced large percentage changes fora few uncommon species, the overall effect was relatively small. The "missed" stems assigned to the firstcensus represented only 2.2% of the total stem numbersand 1.4% of the total basal area. and are unlikely toaffect the overall analysis. Large Cecropia schreberiana and Trema micrantha (L.) Blume found after thefirst census were not allocated to it, as our observationsand growth data suggest that these fast-growing pioneerspecies most likely established after Hurricane Hugo.Several large Prestoea acuminata (a palm, syn. P. montana [Henderson et al. 1995]) were also found in inventories after the first census. The lack of secondarygrowth in P. acuminata precludes diameter extrapolations to determine the stem diameter at the time ofthe first census. The allocation of "missed" Prestoeaacuminata to the first census was made on an individualstem basis, depending upon the diameter ( 10 cm D130)and stem height when first encountered. The growthform of Cyathea arborea (tree fern) also precludes diameter extrapolations, and its "stems" were generally 10 cm diameter before they reached a height of 130cm from the ground. Cyathea arborea stems found afterthe first census were, therefore, not allocated to it irrespective of their diameter when first measured. Theinclusion of additional stems and corrections to the dataand species identifications account for the differencesin species and stem numbers between this paper andZimmerman et al. (1994).As previously mentioned, we inventoried dead stems(between September 1990 and February 1991) that webelieved had been killed by Hurricane Hugo. Of these1259 dead stems (9.6% of the total in the first census),1101 were identified to species from bark and tree form.and 12 were identified as Inga sp. Of the dead stems,146 (1.1% of the total in the first census; "Dead" inthe Appendix) were impossible to identify. These unidentified stems were included in the total stem number,basal area. and size class distributions calculated forthis census.AnalysesWe plotted species-area and species-individual accumulation curves following the method in Condit etal. (1996). The whole LFDP was divided into severalsets of non-overlapping squares of different sizes: 6400squares measuring 5 5 m, 1600 of 10 10 m, 400of 20 20 m, 96 of 40 40 m, 40 of 60 60 m, 24of 80 80 m, and 15 of 100 100 m. In cases inwhich the rectangular LFDP could not be divided intothe required squares, a strip along the east or northedge of the plot was omitted. For each set of squares
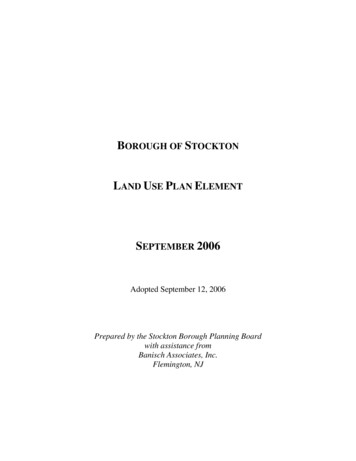
October 2002LAND USE HISTORY IN A TROPICAL FORESTTABLE 1. Density (stems 10 cm D130, diameter at 130 cmabove ground) and basal area (m2) ha–1 of all tree speciesin the entire 16-ha Luquillo Forest Dynamics Plot (LFDP)at El Verde, Puerto Rico, at the time of Hurricane Hugo.LFDP, 16 haFamily and speciesAnacardiaceaeMangifera indica L. ‡AnnonaceaeGuatteria caribaea Urb.Oxandra laurifolia (Sw.) A.Rich.AraliaceaeDendropanax arboreus (L.)Decne. & Planch.Schefflera morototoni (Aubl.)Maguire, Steyerm. & FrodinArecaceaePrestoea acuminata (Willd.) H.E. MooreRoystonea borinquena O.FCook§BignoniaceaeTabebuia heterophylla (DC.)BrittonBoraginaceaeCordia borinquensis Urb.§Cordia sulcata DC.BurseraceaeDacryodes excelsa VahlTetragastris balsamifera (Sw.)KuntzeCecropiaceaeCecropia schreberiana Miq.CelastraceaeMaytenus elongata (Urb.) BrittonChrysobalanaceaeHirtella rugosa Pers.§TypicalNo.mature stemsheight† per .10.001TABLE 1.Continued.LFDP, 16 haTypicalNo.maturestemheight? per haBasalarea(m2)msm-m1.09.90.1100.545Fabaceae, MimosoideaeInga laurina (Sw.) Willd. Ex L. 1-m1-inInga vera Willd. Ex L.Inga sp. (I. laurina or I. 80.174m-l0.10.002mm0.14.10.0030.3220.310.90.0 150.3331m1.00.10.0690.001MagnoliaceaeMagnolia splendens Urb. 10.10.002MalpighiaceaeByrsonima spicata (Cav.) HBKByrsonima wadsworthii Little3sm-msm-m9.80.81.0330.02 1sm0.30.004m0.60.01 01 32.07 10.0060.047m0. I0.0 IOm-1m-1m3.90.80.80.8720.1470.032sm0.10.001Family and speciesMargaritaria nobilis L.Sapium laurocerasus Desf.§Fabaceae, PapilionoideaeAndira inermis (W. Wright)DC. (HBK)Lonchocarpus latifolius (Willd.)DC.Ormosia krugii Urb.Pterocarpus officinalis Jacq.FlacourtiaceaeCasearia arborea (Rich.) Urb.Casearia sylvestris Sw.Homalium racemosum Jacq.Laetia procera (Poepp. &Endl.) EichlerLauraceaeBeilschmiedia pendula (Sw.)Hemsl.Nectandra antillana Meisn.Nectandra turbacensis (Nees)MezOcotea floribunda (Sw.) MezOcotea leucoxylon (Sw.) Laness.Ocotea moschata (Meisn) Mez§Ocotea portoricensis Mez§MalvaceaeHibiscus pernambucensis Arruda‡MelastomataceaeCalycogonium squamulosumCogn.§Henriettea fascicularis (Sw.)M. GómezMiconia tetradra (Sw.) ceaeBuchenavia tetraphylla (Aubl.)111.82.93 ICyatheaceaeCyathea arborea (L.) J. E. Sm.sm0.30.003CyrillaceaeCyrilla racemiflora L.m-11.50.102ElaeocarpaceaeSloanea herteriana carpus altilis (Parkinson)Fosberg‡Ficus crassinervia Desf.Ficus americana Aubl.Pseudolmedia spuria (Sw.) Griseb.sm-msm8.210.50.2460.234MyrsinaceaeArdisia obovata Ham.ClusiaceaeCalophyllum calaba L. ‡Clusia clusiodes (Griseb.)D' ArcyClusia rosea Jacq.EuphorbiaceaeAlchornea latifolia Sw.Aclorneopsisfloribunda(Benth.) Muell. Arg.Croton poecilanthus Urb. Drypetes glauca Vahl1349MeliaceaeGuarea glabra VahlGuarea guidonia (L.) SleumerSwietenia macrophylla King‡Trichilia pallida Sw.sm-msm-m1mmsm-m
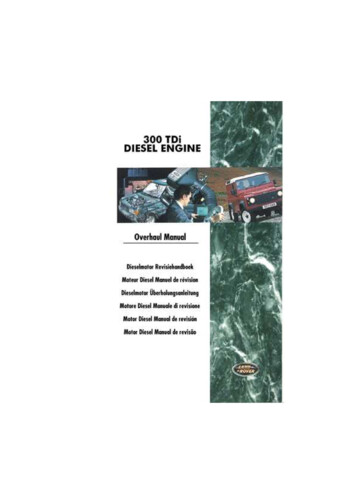
JILL THOMPSON ET AL.1350TABLE 1Continued.LFDP. 16 haFamily and speciesTypical No.mature stemsheight† per haMyrtaceaeEugenia domingensis BergEugenia stahlii (Kiaersk.) Krug& Urb.§Myrcia deflexa (Poir.) DC.Myrcia leptoclada DC.Myrcia splendens (Sw.) DC.Syzygium jambos (L.) Alston‡Basalarea(m2)mm0.42.50.0 yctaginaceaePisonia subcordata Sw.10.10.033OleaceaeChonanthus domingensis Lam.m11.80.659PolygonaceaeCoccoloba diversifolia Jacq.Coccoloba swartzii aeGuazuma ulmifolia Lam.sm-m0.10.016SymplocaceaeSymplocos martinicensis izophoraceaeCassipourea guianensis Aubl.RubiaceaeAntirhea obtusifolia Urb.Chione venosa (Sw.) Urb.Faramea occidentalis (L.) A.Rich.Genipa americana L. [naturaland planted]Guettarda valenzuelana A.Rich.Ixora ferrea (Jacq.) Benth.Rondeletia portoricensis Krug& Urb.§RutaceaeZanthoxylum martinicense(Lam.) DC.SabiaceaeMeliosma herbertii RolfeSapindaceaeCupania americana L.Matayba domingensis (DC.)Radlk.SapotaceaeManilkara bidentata (A. DC.)A. Chev.Micropholis guyanensis (A.DC.) PierreMicropholis garciniifoliaPierrellTheaceaeTernstroemia luquillensis Krug& Urb. Total deadTotal live and deadEcological ApplicationVol. 12, No. 5of the same size e.g., the 1600 10 10 m squares.we calculated the mean number of species per square.The mean number of species per square was then plotted against the size of that quare to produce a speciesarea curve. Species-individual curves were constructedin the same way but were plotted with the mean numberof species per square against the mean number of individual trees (not separate stems) in the same size ofsquare. These methods avoid unrealistic spatial configurations found in repeated-curve methods (Condit etal. 1996).These analyses were repeated for each section ofhistorical cover class in the LFDP, using non-overlapping square-shaped plots with the same sizes as thoselisted for the whole LFDP The number of squares fittedinto each cover class varied with the size and shape ofthe cover class. The number and location of squares 10 10 m depended upon the cover class designationat the quadrat (20 20 m) scale, whereas the 5 5m squares were based on cover class at the subquadratscale. Using the finer resolution subquadrat scaleslightly changed the total size of each cover class.When arranging squares 40 40 m, we omitted somemarginal areas in each cover class that could not fitinto squares. Cover class 1 had an irregular shape witha total area of only 1.16 ha. The closest possible approximation to a 100 100 m square was constructedwithin this class.We searched for distinctive distributions of tree communities relative to historic canopy cover class andpresent environmental factors on the LFDP by usingNonmetric Multi-dimensional Scaling (NMS), incorporating PCORD (McCune and Mefford 1997). NMSis preferred over other ordination methods because itis based on ecologically relevant measures of community (dis)similarity. Analysis is conducted on theranks of dissimilarity values (“distances”) such that itis a nonparametric procedure (Clarke 1993). We presentthe ordination of species stem density in each of the400 20 20 quadrats (rather than 5 5 m subquadrats), because the quadrat scale better matched the environmental variables and increased the sample size ofstems within plots. A comparison of 5 5 m vs. 20 20 m distributions showed little difference. For eachquadrat, we used stem density per species (analysis ofrelative density and relative basal area gave similarresults). The ordination was performed by NMS usingSorenson’s dissimilarity distance matrix (Jaccard’s index produced nearly identical results). As suggested by † Mature height classes are 1, large ( 21 m); m, medium(9-21m); sm, small (4.5-9m); sh, shrub ( 4.5 m). See Littleand Wildsworth (1964). Little et al. (1974). and Little andWoodbury (1976).‡ Exotic in Luquillo Mountains (Little and Woodbury1976).§ Endemic to Puerto Rico (Little and Woodbury 1976). Endemic to Luquillo Mountains (Little and Woodbury1976).
October 2002LAND USE HISTORY IN A TROPICAL FORESTMcCune and Mefford (1997). Principal ComponentsAnalysis (PCA) was carried out first and the axis scoreswere used as a starting point in NMS. This was doneto increase the likelihood that NMS, which is an iterative procedure. would find the best solution (minimumstress), avoiding local minima (for additional explanation. see Clarke 1993. McCune and Mefford 1997).Three axes from NMS were interpreted by correlatingthem (Kendall’s tau) with species stem density perquadrat and with a secondary matrix containing dataon historical cover class, percentage slope, elevation,topographic type, soil type. and degree of rockiness ineach quadrat. Elevation and percentage slope were continuous variables. whereas cover class, topography, soiltype, and rockiness (ranked in increasing percent rockarea per quadrat) were ordinal variables. Soil type androckiness were coded from the soil map as previouslydescribed (Soil Survey Staff 1995). Soil types werealso coded as increasing in soil “wetness” along thegradient: Zarzal, Cristal, Prieto, Coloso, and Fluvequent.RESULTSLand use history of El VerdeInterviews with long-time residents, historical documents, Forest Service records, and aerial photographsfrom 1936 provide a history of land use at El Verde.Between 1924 and 1934, El Verde Tract 11 (includingthe present LFDP) was owned by the Bli
ological artifacts (Sanford et al. 1985, Piperno 1990, Horn and Sanford 1992, Taylor et al. 1999). These land uses still affect general forest composition (e.g., Gó- mez-Pompa and Kaus 1990, Peters 2000), but precise effects are obscure (Lambert and Arnason 1982). The