Transcription
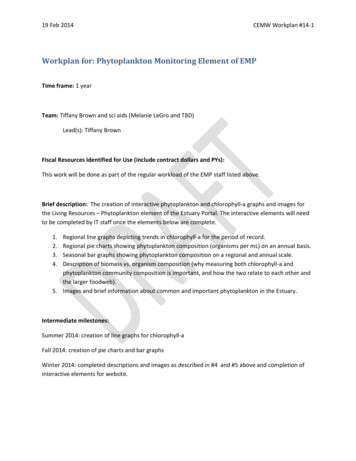
19 Feb 2014CEMW Workplan #14‐1Workplan for: Phytoplankton Monitoring Element of EMPTime frame: 1 yearTeam: Tiffany Brown and sci aids (Melanie LeGro and TBD)Lead(s): Tiffany BrownFiscal Resources Identified for Use (include contract dollars and PYs):This work will be done as part of the regular workload of the EMP staff listed above.Brief description: The creation of interactive phytoplankton and chlorophyll‐a graphs and images forthe Living Resources – Phytoplankton element of the Estuary Portal. The interactive elements will needto be completed by IT staff once the elements below are complete.1.2.3.4.Regional line graphs depicting trends in chlorophyll‐a for the period of record.Regional pie charts showing phytoplankton composition (organisms per mL) on an annual basis.Seasonal bar graphs showing phytoplankton composition on a regional and annual scale.Description of biomass vs. organism composition (why measuring both chlorophyll‐a andphytoplankton community composition is important, and how the two relate to each other andthe larger foodweb).5. Images and brief information about common and important phytoplankton in the Estuary.Intermediate milestones:Summer 2014: creation of line graphs for chlorophyll‐aFall 2014: creation of pie charts and bar graphsWinter 2014: completed descriptions and images as described in #4 and #5 above and completion ofinteractive elements for website.
19 Feb 2014CEMW Workplan #14‐1Deliverables: Interactive graphs for the water quality portal, a description of the importance ofphytoplankton and chlorophyll‐a in the estuary, and information on important phytoplankton in theEstuary coupled with images.
24 Feb 2014CEMW Workplan #14‐2Workplan for: Zooplankton StudyTime frame: August 2014Team: (Name all individuals who will be contributing. These should also be the people in the Asanagroup entitled with a description similar to the workplan title. Asana tasks within the project can bedetailed there‐like who’s doing which pages of the Water Quality section.)Lead(s): April Hennessy (CDFW)Fiscal Resources Identified for Use (include contract dollars and PYs):Brief description: (This should be as clear as possible, but still remain brief. Detail if the task includes ITneeds outside of the project, if it’s dependent on other things happening, if it includes loading pages orjust mocking them up, etc.)Create seasonal or monthly regional indices for zooplankton to be featured in annual Status and TrendsIEP Newsletter article as well as on the Estuaries Portal.Intermediate milestones: (Brief description and date of completion)March 2014‐ 2013 zooplankton data completed, QC’d, and appended to databaseApril 2014‐ 2013 data released, regional indices developed for 2013 and other annual graphs updatedMay 2014‐ annual status and trends article written and graphs completedJune 2014‐ update graphs and summaries for Estuaries PortalJuly 2014‐ post updated graphs and summaries on Estuaries PortalDeliverables: Zooplankton data matrices, annual zooplankton status and trends newsletter article, andzooplankton pages of estuary portal updated.
2/25/2014CEMW Workplan #14‐3Workplan for: Habitat Portal PagesTime frame:New pages completed by end of 2014Team:Lead: Kristal Davis FadtkeIndividuals to reach out to for participation: Judy Kelly, Cliff Harvey, Kristen Cayce, Hildie Spautz, SanFrancisco Estuary Partnership (Adrien Baudrimont?)Fiscal Resources Identified for Use:Kristal Davis Fadtke – 10% timeBrief description:Develop additional pages for the Habitat section of the portal. This will include pages that answer thefollowing questions: “How healthy are SF Estuary habitats?”, “Why are habitats a key attribute?” and“How do we determine the health of habitats?” In the development of these pages the focal categorieswill be indentified and health indicators will be described. Content will be pulled from existinginformation and will rely heavily on the 2011 State of the Bay report. The proposed 2015 State of theBay‐Delta report may provide detailed analyses to further enhance these pages in the future. Anothercomponent in the development of these pages will be to explore obtaining additional data for CARI toclassify habitats in the Delta.Intermediate milestones: Modify existing pages to be more consistent with Living Resources section – May 2014Identify and describe focal categories – August 2014Identify and describe health indicators – October 2014Mock up pages for review – November 2014Upload new pages to portal – December 2014Deliverables:New pages for the Habitat section of the portal that answer the following questions: “How healthy areSF Estuary habitats?”, “Why are habitats a key attribute?” and “How do we determine the health ofhabitats?”
25 Feb 2014CEMW Workplan #14‐4Workplan for: Development of Fish Monitoring Data Access andVisualization for Living Resources Portion of the Estuaries Portal.Time frame: 1 YearTeam: Kris Jones and Matt DekarLead(s): Kris Jones and Matt DekarFiscal Resources Identified for Use (include contract dollars and PYs):This work will be done as part of the regular workload of the staff listed above. Additional funding maybe needed to develop the graphical interface for these data (e.g., to develop interactive maps andfigures).Brief description: This work will incorporate data from the U.S. Fish and Wildlife Service’s Delta JuvenileFish Monitoring Program (DJFMP) into the Living Resources portion of the Estuaries Portal. The DJFMPsamples fish year‐round approximately weekly at three long‐term trawl locations and at 58 beach seinesites throughout the San Francisco Estuary. We also aim to incorporate additional survey data from theDepartment of Fish and Wildlife (DFW); however, further outreach is needed with key DFW staff beforeany specific plans can be made relating to these datasets (a separate workplan will be developed fordeliverables relating to DFW datasets).In addition to having the aforementioned datasets accessible via the Estuaries Portal, this projects aimsto develop interactive elements for visualization of these data (e.g., interactive maps and graphs).Crosswalks will also be developed, which will allow users to explore relationships between fisheries dataand other biological and environmental datasets accessible through the portal.1. Develop portal content, which provides the background and details regarding the methods forthe fish surveys, including metadata.2. Develop portal content, which provides any relevant species specific background. Also developcontent which relates to the visualization of the data (as described in #3, below).3. Develop an interactive graphical interface which allows for the visualization of inter‐ and Intra‐annual trends in fisheries and environmental data (e.g., using bar and/or line charts); our teamwill work with the Monitoring Council’s Data Management Workgroup to develop thesevisualization tools.4. Develop GIS layers for fish survey data, which show the relative abundance of species in theDelta (time frames TBD). Develop similar layers for other biological and environmental data(e.g., phytoplankton, zooplankton, water quality etc.); our team will work with the MonitoringCouncil’s Data Management Workgroup to develop these visualization tools.
25 Feb 2014CEMW Workplan #14‐4Intermediate milestones:Summer 2014: numbers 1 and 2 (above)Winter 2014: number 3 (above)Spring 2015: number 4 (above)Deliverables: Interactive maps and graphs for the Estuaries Portal, as well as the associated supportingportal content pages (as described above; numbers 1‐4).
25 February 2014CEMW Workplan #14‐5Workplan for Water Element of SF Estuary PortalTime frame: Completed introductory and detail water quality pages by the end of 2014 calendar year.Team: Lead(s): Erin ForesmanTeam: Jon Rosenfield, William Templin, Jason Lofton, Stephanie Fong, Meghan Sullivan,Valentina Cabrera‐StagnoFiscal Resources: 100K of EPA support for TMDL Assessments and salinity gradient visualization plusstaff time.To meet Strategic Plan item(s):Brief description: The Water Quality element will be divided initially into water quantity and quality.The water quality element will describe existing water quality status in the SF Estuary using the CWA303(d) list as the primary, though not the only resource for indicating level of water quality. We will alsodiscuss other water quality issues that are not yet listed on 303(d). The water quantity section willaddress issues of hydromodification in the SF Estuary. There are some IT services that will be providedby Tetratech through an EPA contract.Intermediate milestones: (Brief description and date of completion) Spring 2014 – narrative content developed for the introductory water quality and quantitypages, circulate for review and revision.Summer 2014 – narrative content developed for detailed water quality and quantity pages;circulate for review and revision.Fall 2014 – TMDL progress assessments and salinity visualization materials added to draft pages;circulate for review and revision.End 2014 upload to CEMW site.Deliverables: Introductory and detailed pages describing water quality and quantity impairments andissues in the SF Estuary. Introductory material will focus on basic concepts and policy requirementswhile detailed pages will provide access to water quality data for specific contaminants and stressors.Other deliverables include 15 TMDL progress assessments and salinity gradient maps.
February 24, 2014CEMW Workplan #14‐6Workplan for: Expansion of Bird pagesTime frame: through Dec 2015 (?) or identified deadline for production of State of the Estuary reportTeam: To be determined. May include Delta Bird Restoration Network participants; PRBO staff; DanikaTsao and other DWR staff.Lead(s): Hildie Spautz, CDFWFiscal Resources Identified for Use (include contract dollars and PYs):Hildie Spautz – 0.10 PYNo additional resources yet identified.Brief description:1)2)3)4)Update current content with new data for selected species if it becomesavailable. Obtain data from PRBO and other sources of bird data. CreateGIS layers and interactive content.Add content describing drivers, conceptual models, links to other pagesincluding habitat and ecological processes.Develop bird indicators for State of the Estuary report, and concentrateefforts on those species for Portal. ExceptionIf additional volunteers become available, develop content for otherspecies that are not directly part of the SOE reportIntermediate milestones: (Brief description and date of completion)1)2)Outline for updates to existing content, data needs, and detailed plan forgetting there.Proposed list of bird indicators for State of the Estuary report and outlinefor their developmentMay 2014Dec 2014Deliverables:1)2)3)Updated data on current bird species pages. New content may beintegrated with existing pages, or may require configuration and additionalpages will be created.GIS layers and associated survey data.Develop bird indicators for State of the Estuary reportSept 2014Dec 2015 (?)
February 24, 2014CEMW Workplan #14‐7Workplan for: Expansion of Ecological Processes pagesTime frame: Update 1 – September 2014, and State of the Estuary report updates – September 2015Team: Hildie Spautz, Stephanie Fong, Kris Jones, Matt Dekar.Lead(s): Hildie Spautz, CDFWFiscal Resources Identified for Use (include contract dollars and PYs):Hildie Spautz – 0.10 PYNo additional resources yet identified.Brief description:1)Update food web diagrams with interactive content & links to otherpages.2)Develop ecological process indicators for State of the Estuary report, andconcentrate efforts on those for Portal.If additional volunteers become available, develop content for otherecological processes that are not directly part of the SOE report, e.g.:a. Floodplain processesb. Climate and climate change3)Intermediate milestones: (Brief description and date of completion)1)2)Outline for updates to existing content, data needs, and detailed plan forgetting there.Proposed list of ecological process indicators for State of the Estuary reportand outline for their developmentMay 2014Dec 2014Deliverables:1)Updated interactive food web diagrams. New content will replace existingpages, or may require configuration and additional pages will be created.2)Fully developed ecological processes indicators for State of the EstuaryreportSept 2014October 2015
3. Seasonal bar graphs showing phytoplankton composition on a regional and annual scale. 4. Description of biomass vs. organism composition (why measuring both chlorophyll‐a and phytoplankton community composition is important, and how the two relate to eachdother an the larger foodweb). 5.
