Transcription
Design of an in-line, digital holographic imagingsystem for airborne measurement of cloudsScott M. Spuler* and Jacob Fugal†National Center for Atmospheric Research, Earth Observing Laboratory and Advanced Studies Program,P.O. Box 3000, Boulder, Colorado 80307-3000 USA*Corresponding author: spuler@ucar.eduReceived 14 December 2010; accepted 21 January 2011;posted 25 January 2011 (Doc. ID 139635); published 28 March 2011We discuss the design and performance of an airborne (underwing) in-line digital holographic imagingsystem developed for characterizing atmospheric cloud water droplets and ice particles in situ. The airborne environment constrained the design space to the simple optical layout that in-line non-beamsplitting holography affords. The desired measurement required the largest possible sample volumein which the smallest desired particle size ( 5 μm) could still be resolved, and consequently the magnification requirement was driven by the pixel size of the camera and this particle size. The resultingdesign was a seven-element, double-telecentric, high-precision optical imaging system used to relayand magnify a hologram onto a CCD surface. The system was designed to preserve performance andhigh resolution over a wide temperature range. Details of the optical design and construction are given.Experimental results demonstrate that the system is capable of recording holograms that can be reconstructed with resolution of better than 6:5 μm within a 15 cm3 sample volume. 2011 Optical Society ofAmericaOCIS codes: 090.0090, 220.3620, 120.4640, 010.1100.1. IntroductionSmall cloud droplets and ice particles have largelybeen measured by airborne in situ probes that measure particles one at a time. Although this type ofmeasurement yields answers to many science questions, it says little about the immediate environmentof individual cloud particles or the small lengthscales in which important cloud processes occur,e.g., collision-coalescence, turbulence-induced particle clustering, inhomogeneities in light scatteringdue to local variations in size and spatial distributions, local ice- and liquid-particle partitioning inmixed-phase clouds, etc. To understand these cloudprocesses there is a need to observe particles in theirlocal environment and on length-scales that arephysically relevant.To measure a statistically relevant cloud particlesize distribution, of the order of 103 particles need0003-6935/11/101405-08 15.00/0 2011 Optical Society of Americato be measured that would give a 10% statisticaluncertainty in 10 size bins. For the purposes of thispaper, we apply the name cloud particles (liquid andice) to the diameter range from 2 μm to 100 μm,above which we consider them precipitation particlesthat proceed in cloud processes with different dynamics. With a typical cloud concentration of theorder of 100 particles cm 3 in this diameter range,a sample volume of 10 cm3 is required. A spatiallylocalized and instantaneous measurement of this10 cm3 sample volume contains information aboutthe immediate environment and neighboring particles of the whole ensemble of particles.Measuring an ensemble of small particles in asample volume was one of the first practical applications of holography. The technique, invented in 1948by Dennis Gabor [1], allows for the reconstruction ofwavefronts in three-dimensional (3D) space. The layout for a simple in-line hologram is shown in Fig. 1.Holography records phase information by introducing a background or reference wave, which convertsphase differences into intensity differences. It is a1 April 2011 / Vol. 50, No. 10 / APPLIED OPTICS1405
Fig. 1. Simple in-line hologram. Reference plane wave illuminates an object field—in this case, single particle located at z froman image plane. Diffracted light from particle and reference waveinterfere at image plane. Hologram, which is the interference pattern, contains all necessary information required to reconstruct 2Dsize and 3D location of particle.two-step process in which the interference patternbetween the object field and the reference wave isformed and recorded on photographic material orelectronically (e.g., with a CCD). After the photographic material is developed, the object wave canbe reconstructed optically by illuminating the hologram with the reference beam or, in the case of adigital image, reconstructed numerically on a computer. The reconstructed images can be used todetermine the size distribution within the samplevolume and contain information about the particlerelative 3D positions and shape. This is anotheradvantage over light-scattering, one-at-a-time,particle-measurement methods, which are widelyand traditionally used for airborne particle measurements and must make assumptions about particlecomposition and shape to infer the particle size.Airborne holographic instruments for measuringcloud particles have been implemented in bothfilm (or glass photographic plate) forms [2–4] and digital forms [5,6]. Additionally, ground- [7,8] andlaboratory-based [9] instruments for measuring natural cloud particles and precipitation- or laboratoryformed cloud particles have been used. Digitalholography offers the significant advantage of acquiring and storing holograms rapidly; however, asignificant constraint is the pixel count and resolution of the imaging devices. The few airborne instruments that employed digital holography did notcapture volumes large enough to estimate cloud particle size distributions from a single hologram withgood statistics. To our knowledge, the only existingairborne holographic instrument for cloud particles,digital or otherwise, is the one developed with the optical system described in this work.The main objective of this project was to develop adigital holographic imaging system—suitable for aircraft studies—with a sufficiently large volume that astatistically relevant size distribution can be obtained within a single spatially localized volume.2. Design ConsiderationsWhen developing a new instrument, there are manyfactors that define and constrain the design space.For this development, the most stringent design considerations were the severe airborne environmentand the need for sampling the largest possible vo1406APPLIED OPTICS / Vol. 50, No. 10 / 1 April 2011lume while still resolving the desired smallest particle. Relevant considerations of the former constraintinclude high-vibration, temperature and pressureswings, condensation and deposition on optics, limited power for heating, low mass and compact space,and aerodynamic requirements. For example, on atypical jet aircraft, the air speed is 200 m s 1 andcan cause the impaction and shattering or splashingof particles on the probe body (the particles we desireto measure). The latter requirement, regarding sample volume and resolution, is equally challenging, requiring a high NA design suitable for capturing thediffracted light of the smallest particles over a largefield-of-view. The field-of-view requirement generallymeans larger lenses while the high NA generally requires tighter tolerances on lens surface quality andmounting. Lastly, there is the limited budget inwhich to design, acquire, and assemble the lensesand their mounts.The foregoing constraints require a compact, lowweight system that will not lose alignment with thevibration, temperature, and pressure swings, andwill be mechanically stable enough to meet standards required for Federal Aviation Administration(FAA)-certified aircraft. Furthermore, the probe bodyrequires a design that will minimally disturb theflow and will deflect shards of shattered particlesaway from the sample volume. Therefore, the samplevolume must be located as near the leading edges aspossible. These constraints make systems with complex beam paths (such as those with beam splittingand beam recombining) impractical. For this reason,we chose an in-line, non-beam-splitting configuration similar to Gabor’s first system [1]. An in-line configuration means that the angle between thescattering and reference beam is 0 , which doesnot preclude splitting and recombining at 0 [10,11]. By “non-beam-splitting,” we mean that thescattered and reference beams remain on the sameaxis throughout the system. We also chose to use digital holography as opposed to film for the usual reasons of convenience of data recording and processingand also for compactness and robustness. We did thisdespite knowing film is still orders of magnitude larger in field-of-view, and an order of magnitude betterin resolution than digital holography [12].The choice of in-line, non-beam-splitting holography has two advantages other than simplicity of setup. First, the entire hologram can be used to searchfor particles where off-axis holography has a samplearea smaller than the full hologram to avoid the overlap of real and virtual images [11]. Also, a lowerresolution is acceptable with in-line holography, because the “carrier wave” that occurs in off-axis holography between the reference and object waves [12]does not need to be resolved. Disadvantages includethe overlap of the virtual and object images, whichgrows worse with larger particle size and particlesappearing closer to the hologram. Also, with in-line,non-beam-splitting holography, there are limitationsin particle density and particle size before too much
light is occluded or scattered by the particles, rendering the hologram unintelligible from speckle noise[13] and the violation of the assumption that the remaining unscattered reference wavefront is not severely affected by the particles that scatter lightout of the beam. However, for particle sizes anddensities of typical cloud conditions, this constraintis not experienced [6]. Finally, in-line non-beamsplitting means we cannot avail ourselves of any ofthe numerical aberration-compensation techniquessuch as those that require either off-axis [14,15] orin-line beam-splitting phase-shifting setups (beamsplitting being necessary for phase-shifting) [11] toretrieve the phase and thus correct for aberrations.Therefore, we must control the system aberrationswith optical methods. Although, to our knowledge,there are no aberration corrections to in-line, nonbeam-splitting holography, there are phase retrievalalgorithms for in-line holograms that prove useful forremoving the virtual images that appear around thereal images in in-line holograms (e.g., [8]).3. Wavelength and Component SelectionWe chose to use a UV wavelength to increase thesample volume—to make smaller particles resolvable at positions further from the real hologram. Themaximum depth, zmax , at which a particle is resolvable appears aszmax ¼ ðDap Dp Þ ð2:44λÞ;ð1Þwhere Dap is the size of the aperture (camera size orlens input pupil size), Dp is the smallest resolvableparticle diameter, and λ is the wavelength.For the coherent illumination source, we selecteda frequency-tripled, passive Q-switched, diodepumped solid-state Nd:YAG laser. It has an adjustable pulse rate up to 3 kHz, a pulse energy of 15 μJper pulse, and a pulse width of 1 ns. The short pulseduration limits particle smearing to 0:2 μm duringtheir illumination when flying at 200 m s 1 . The laserbeam profile was stable and reasonably smooth forpulse rates between 1 and 2 kHz.We chose to use an interline CCD to take advantage of its fast electronic shutter to keep sunlightfrom significantly affecting the holograms, despitethe fact that full-frame readout CCDs have a fewtimes more pixels. We selected the largest framecamera available within our budget that would fit inside a standard underwing canister. The camera usesthe Kodak KAI-16000 35 mm format CCD chipthat has 4872 3248 pixels, with a pixel pitch of7:4 μm, which makes a 36 mm 24 mm frame witha 43:4 mm diagonal. The camera was operated at3:3 frames s, with an exposure time of 650 μs. Toavoid requiring a timing circuit, the laser pulse ratewas set at the reciprocal of the camera’s exposuretime or about 1538 pulses s. This ensured that everyexposure of the camera had a single illuminating laser pulse. The intervening few hundred laser pulsesthat illuminated the interline CCD between expo-sures did not affect the image in the process of beingread out. By operating at 355 nm, the CCD quantumefficiency was reduced to about 10% compared toabout 50% at 532 nm wavelength. However, it wasstill sensitive enough to use without modification—including leaving the microlens array on the CCDsurface and the antireflection-coated CCD coverglass intact.4. Optical and Optomechanical DesignBecause we ultimately want to measure particle positions and search for particle clustering, designingthe instrument with the camera at the leading edgeof flow was not desirable. The fixture to hold the camera would severely disturb the flow and would overwhelm the sample volume with shattered particles inthe presence of large cloud ice particles. Therefore,an optical system was required to relay the hologramand image it on the CCD surface. Additionally, optical magnification was required to measure the smallest particles. To unambiguously resolve a particlerequires that it fill more than about two adjacentpixels on a side. Therefore, the minimum magnification required can be defined asM 2Dpixel;Dpð2Þwhere Dpixel is the pixel diameter and Dp is thesmallest resolvable particle diameter. To unambiguously resolve the smallest particle size we are interested in ( 5 μm) with a 7:4 μm pixel camera requireda optical magnification of approximately 3 . We alsohad to consider that the optical system would nothave impractically tight tolerances on lens surfacesor their mounts. In the end, in an effort to constraincost and complexity, we chose to design the systemwith a magnification of 2:5 .In the far field, the scattering for in-line holography (by definition forward-scattering) is diffractiondominated, i.e., the small particles scatter light forward as if they were diffracting circular disks [6,16].So each particle can be considered as an opaque twodimensional (2D) aperture with a shape equal toits cross section. The NA of the diffracted light isgiven byNA 1:22λ;Dpð3Þwhere λ is the wavelength and Dp is the diameter ofthe particle. Therefore, the smallest particles in thesample volume will require the largest NA. Reducingthe wavelength reduces the NA requirement and hasthe potential benefit of reducing the optical complexity. However, imaging systems designed for shorterwavelengths have a greatly reduced selection of optical materials with sufficient transmission, as mostoptical glasses are useless for wavelengths 350 nm.Finally, as mentioned previously, choosing anin-line, non-beam-splitting geometry meant we1 April 2011 / Vol. 50, No. 10 / APPLIED OPTICS1407
could not correct for aberrations during the numeric reconstruction process, i.e., use numericalaberration-compensation techniques. Thus we hadto design an imaging optical system as aberrationfree as required to resolve the smallest particlesthroughout the sample volume. Other holographicsystems have also required sophisticated multielement lenses. For example, Malone et al. [17] provideddetail about a diffraction-limited nine-element lensthat was designed to relay a hologram away froma harsh environment that would damage the delicatehigh-resolution holographic film. Additionally, highquality microscope objectives are routinely used inholographic microscopy to provide magnificationand increase the system NA for high-resolutionimaging [18,19].As previously discussed, the airborne lens systemneeded to operate over a wide temperature range—from 65 to 35 C. Because of electrical power limitations on the aircraft, we chose to design the lenssystem so that it would not require active temperature control (i.e., as a passively athermalized system.) Therefore it had to be designed to accountfor the variation in index of refraction with temperature, the thermal expansion of the glass types andhousing materials, and mount-induced deformations.Additionally, it is important to accurately measurethe original sample volume. The sample volume—which is numerically reconstructed from a singlehologram—is a function of the optical system magnification. The reconstructed volume scales from thehologram as a function of the optical system magnification, xM yM zM 2 , where M is the optical magnification and x, y, and z are the spatial dimensions ofthe reconstructed volume. Therefore, uncertainty inthe hologram magnification and uniformity across itsfield translates to uncertainty in the reconstructedparticle position and size. Thus we chose to use anoptically invariant magnification lens design knownas double telecentric. A double-telecentric lens is anafocal optical system working as a finite-conjugateimaging lens—designed so both the object spaceand image space chief rays are approximately parallel to the optical axis. The design avoids magnification variance due to positional errors and hasvery low distortion. More details about this type oflens design have been discussed within the contextof holographic optical data storage recordingsystems [20].The optical system was designed with a numericalaperture of 0.087—able to collect scattering from5 μm diameter particles at the 355 nm wavelength illumination—and 2:5 magnification to unambiguously resolve down to 6 μm particles with the 7:4 μmCCD pixel size. The design required a 9:6 mm 14:4 mm hologram to be relayed to a 24 mm 36 mm CCD detector with diffraction-limited performance. To meet the performance requirements, thesystem required seven high-UV-transmission elements. The multielement lens system was optimizedfor athermal performance and minimal ray bendingat each glass surface to relax the decenter and tilttolerance. All the individual lenses were designedto remain within the decentration, tilt, and despacebudget for the operating temperature conditions.During the optical design, changes in the best focusposition of the lens were minimized over the complete temperature range. The system was opticallymodeled as a sealed barrel, so the atmospheric pressure scales with temperature.The final lens design is shown in Fig. 2. The substrate for the last element in the lens system wasselected to be fused silica. This material has hightransmission at 355 nm wavelength, but must beused carefully in a system that is operated over awide temperature range, due to its large thermo-optic coefficient. This final meniscus element has relatively low optical power and functions as mainly as acorrector plate for temperature changes and imagetelecentricity. In the final design, the stop—alsowhere the collimated laser beam focuses—ended upvery close to the front surface of the fourth lens element. To avoid potentially damaging the lens, an absorptive neutral density (ND) filter was used toattenuate the laser (a 0.5 ND filter made from0.91-mm-thick NG4 Schott glass (Schott AG, Germany), which had 8% T at 355 nm wavelength). Afterlaser collimation and other aperture losses to flattenthe beam intensity, the ND filter reduced laser energy entering the lens to approximately 0:7 μJper pulse. The attenuation level was experimentallyverified to not damage the lens material and to stillhave acceptable image contrast in a single laser shot.Although this approach worked well, the potentialrisk for lens damage (e.g., if the ND filter was mistakenly removed) remains somewhat unsatisfactory.The lens mounting material—416 stainlesssteel—was selected during the athermalizationFig. 2. (Color online) Details of seven-element imaging lens designed to relay 355 nm wavelength hologram and provide 2:5 magnification. Beam travels left to right.1408APPLIED OPTICS / Vol. 50, No. 10 / 1 April 2011
The system was flushed with dry nitrogen during assembly and then sealed with a thin bead of flexibleepoxy to keep moisture, dust, and other contaminants from entering and depositing on the opticalsurfaces. The final optomechanical design is shownas an exploded view in Fig. 3.5. Experimental ResultsFig. 3. (Color online) Semitransparent exploded view of lens solidmodel. Each element is mounted in a “poker chip” subcell. Lenselements 1 to 4 are smaller and stacked into left side of lens tube.Larger elements 5 to 7 are stacked into tube from opposite end.Proper lens spacing was obtained with spacers made of same material as subcells and lens tube.optimization of the lens system. Its linear expansioncoefficient (9:9 10 6 C) is a close match to theremaining glasses used (ranging from 6.6 to8:2 10 6 C), which minimizes stress-induced birefringence that could degrade performance. The steelwas chemically blackened by a black oxide treatmentto reduce stray light.Following a technique described by Yoder [21],each lens element was mounted and aligned precisely within a subcell, or “poker chip,” that couldbe inserted in sequence into a precision-bored innerdiameter of the main lens tube. Each subcell wasdesigned with a tangential shape interface to theconvex lens surface. This shape provides an even distribution of pressure on the optic and provides anarea that is as large as practical (i.e., forces are distributed evenly and not concentrated on a fewpoints). The lens elements were aligned to less than10 μm decenter and 0:2 mrad tilt within each subcelland secured with a flexible epoxy adhesive (3M 2216,3M, USA). Retainer rings were used to axially constrain the stack of subcells in the main lens tube.After the lens was assembled, it was arranged on analuminum optical breadboard for testing with the laser, camera, and delivery optics, as shown in Fig. 4.Resolution tests were performed with a 1951 USAF(U.S. Air Force, USA) positive optical test pattern(glass slide with chrome pattern) as the principal testobject. The 355 nm laser beam was expanded, intensity-flattened (aperture applied to clip low intensitywings of the Gaussian beam), collimated, and used torear-illuminate the target.The assembled lens relays and magnifies whateveris located at the object plane onto the camera CCDsurface (i.e., the image plane). In the case in whichthe target is positioned at the object plane, a conventional image is formed. When the target is locatedaway from the object plane (i.e., the conventional image is out of focus) a hologram is formed at that location, and the real hologram is relayed to the camera.A conventional image of the resolution target obtained with the assembled optical system is shownon the left side of Fig. 5. The line-pairs of the resolution target have bar widths that range from 7.8 to4:4 μm and 3.9 to 2:2 μm, for groups 6 and 7, respectively. Since determining the resolution can be potentially subjective, a black and white threshold wasapplied to the original image to provide a check.The filtered image is shown on the right side of Fig. 5.The conventional images demonstrate that the optical system provides a resolution down to the detector limit. The resolution is limited by the 2:96 μmeffective pixel size of the camera (7:4 μm actual pixelsize divided by 2:5 optical magnification). Targetline-pairs that are about the same size as the effective pixel sizes and smaller have varying degrees ofFig. 4. (Color online) Experimental layout used to test in-line holographic imaging system.1 April 2011 / Vol. 50, No. 10 / APPLIED OPTICS1409
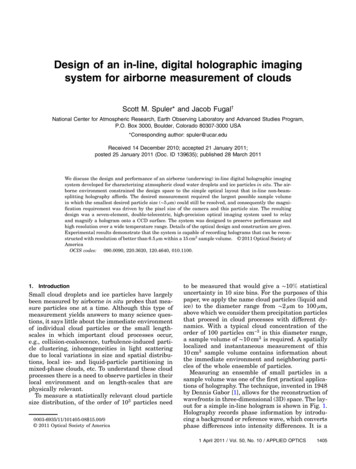
Fig. 5. (Color online) Conventional image of USAF 1951 resolution target obtained with assembled lens system. Right imagehas black and white threshold filter applied to help identifyresolution limit. Last horizontal and vertical line-pair with allthree bars distinguishable is group 7, element 3, which has abar size of 3:1 μm.cross talk, and therefore appear to have higher orlower resolution depending solely on the positionof the target. For example, the horizontal line-pairsfor group 7, element 4, are clearly resolved in theblack and white threshold image; however, theselines have a bar width of 2:8 μm, which is belowthe effective pixel size of the system.A. Testing to Measure Resolution over Full TemperatureRangeTo test the temperature performance of the opticalsystem, the complete test setup—lens, laser, camera,and delivery optics, all mounted on an optical breadboard—was placed in an environmental chamber.The laser and camera were temperature-regulatedto maintain temperature at 25 C. The resolution target was placed at 135 mm from the object plane, andimages were obtained with the chamber temperatureat 20 C, 0 C, 20 C, 40 C, and 65 C. The lenstemperature was monitored with two thermocouplesand allowed to come to equilibrium with the chamberair temperature before collecting the images.The digital holograms collected at each temperature were processed exactly as in Fugal et al. [22].They were reconstructed to form the sharpest imageFig. 6. Conventional image of resolution target used for volumetests. Four smallest sections of pattern used in resolution analysisare identified by white boxes, and radial distance from target center is labeled.1410APPLIED OPTICS / Vol. 50, No. 10 / 1 April 2011by adjusting the reconstruction distance to the target. There was no degradation in image quality inthe reconstructed images over the full temperaturerange. In other words, there was no change in thesmallest resolvable line-pair with temperature.The reconstructed best focus of the target decreased0:2 0:05 mm from 20 C to 65 C. The expectedchange in expansion of the aluminum breadboardgenerally accounts for this shift. The contraction indistance between laser expansion and collimationlenses mounted on the aluminum breadboard alsoslightly altered the laser collimation.B. Reconstructed Hologram Resolution throughoutSample VolumeTests were conducted to measure the reconstructedhologram image quality throughout the desired sample volume (shown as a dotted box in Fig. 4). For thistest, a USAF pattern wheel was used as the test object. A conventional image of this target was obtainedwith the assembled optical system and is shown inFig. 6. The repeating pattern allowed us to measureresolution at different field points of the imaging system. The target was positioned so that four of thesmallest sections of resolution patterns were visiblewithin the imaging field-of-view. These sections areidentified in Fig. 6 with white boxes, and the distancefrom the target center is labeled. The radial distances ranged from 2:3 mm to 7:3 mm from the targetcenter. The physical size of the imaged portion of thetarget was 9:6 mm 14:4 mm—an area of 1:38 cm2.The volume resolution tests were performed atroom temperature with the target placed at distances of 10, 25, 75, and 150 mm from the assembledlens object plane. In the same manner as describedabove, the holograms were reconstructed to the sharpest image by adjusting the effective distance to target within the reconstruction code. The smallestresolvable feature size in the reconstructed targetwas measured at each distance for each of the fourFig. 7. (Color online) Reconstructed hologram of resolution targetunder worst-case test conditions. Right image has black and whitethreshold filter applied to help identify resolution limit. Targetwas positioned 152 mm from object plane, and image is zoomedin to show test pattern at 7:3 mm radial distance from target center. Last horizontal and vertical line-pair with all three bars distinguishable is group 6, element 3, which has a bar width of 6:2 μm.
Fig. 8. Reconstructed resolution as a function of target distance from hologram real image (or conjugate image). Smallest resolvablefeature size in reconstructed hologram was measured at four radial locations on the target. Radial distance from target center is shownin legend.radial locations on the target. The smallest resolvable line-pair on the test pattern image was determined visually for both vertical and horizontal linepatterns. Figure 7 shows the reconstructed hologramfor the worst-case test conditions. The target was positioned 152 mm from the object plane, and the imageis zoomed in to show the test pattern at 7:3 mm radial distance from the target center. The image onthe right had a black and white threshold filter applied to help identify the resolution limit. Althoughthe simple thresholded image is slightly noisy, thelast line-pair with all three bars distinguishable isgroup 6, element 3, which has a bar width of 6:2 μm.The complete results of the resolution volume testare shown in Fig. 8. The smallest resolvable horizontal and vertical line-pairs were averaged to calculatethe effective resolution limit. The effective 2D resolution was found to be better than 6:5 μm for targetdistances up to 150 mm at all of the radial positionsmeasured. The loss in resolution at the higher radialpositions is likely due to edge effects. Based on theseresults, it was estimated that at least 75% of the central area of the imaging system field-of-view—aneffective area of about 1 cm2 —will provide this resolution for a distance of up to 15 cm from the objectplane. Therefore, the test demonstrates that the holographic imaging system has a resolution of 6:5 μmwithin a volume of 15 cm3.6. ConclusionsAn in-line holographic imaging system was developed to achieve a significant improvement in themeasurement of cloud and small ice particle size distributions. The conditions that shaped the designspace and the resulting imaging system requirements were discussed. The design details were givenregarding how the lens was constructed and tested.Laboratory tests using a resolution target demonstrated the optical resolution and athermal performance from 65 C to 20 C. The system wasdemonstrated to have a resolution (of target line-pairbar widths) 6:5 μm within a 15 cm3 volume. This volume is sufficiently large that statistically relevantsize distributions of cloud particles can be obtainedwithin a spatially localized volume.Since the completion of this work, the optical system has been integrated into a flight-certified pr
Airborne holographic instruments for measuring cloud particles have been implemented in both film (or glass photographic plate) forms [2-4] and di-gital forms [5,6]. Additionally, ground- [7,8] and laboratory-based [9] instruments for measuring nat-ural cloud particles and precipitation- or laboratory-formed cloud particles have been used .