Transcription
The 16th International Conference on Auditory Display (ICAD-2010)June 9-15, 2010, Washington, D.C, USASONIFICATION STRATEGIES FOR EXAMINATION OF BIOLOGICALCELLSAlistair D N Edwards1, Andy Hunt2, Geneviève Hines3, Vanessa Jackson4, Alyte Podvoiskis2, RichardRoseblade2, Jon Stammers21Department of Computer Science2Department of Electronics3Department of BiologyUniversity of YorkHeslington, York, UK YO10 5DD4Cytology DepartmentLeeds Teaching Hospitals NHS TrustBritannia HouseMorley,Leeds UK LS27 0DQalistair@cs.york.ac.ukABSTRACTCervical cancer is one of the most preventable forms of thedisease thanks to the fact that pre-cancerous changes can bedetected in cervical cells. These cells are examined visuallyunder microscopes, but the objective of this project was toascertain whether their examination could be improved if thevisual inspection were accompanied by an auditoryrepresentation. A number of different sound mappings weretested. This paper also traces the way the sound experimentsevolved in parallel with the underlying research on cell imageanalysis. The main conclusion is that in this kind of application,the important parameters to sonify are the ‘badness’ of the celland the reliability of that rating, and some likely soundmappings to convey this information have been identified.1.BACKGROUNDCervical cancer is a slow onset disease whose precursor signscan be detected by inspecting visually, under magnification,samples of cervical cells. The UK National Health Service(NHS) cervical screening program organizes in England thecollection and inspection of about 4 million samples each year[1]. It is a highly successful program which saves an estimated4,500 lives each year in England [2].The work described in this paper is part of a project whichaims to produce an auditory representation of the visualinformation contained in the sample slides, as a means ofincreasing the number of clues on which the cytologist (medicalperson working on cell analysis) bases his/her decision on thenormality of the sample. The ultimate aim is to improve theaccuracy of screening, thereby to reduce the number of errors(false negatives and false positives) and hence to improveefficiency, reduce stress and in some cases to save lives.In order to achieve this, a mapping from the existing(visual) data to sounds had to be devised. This paper describesa number of approaches that were tested. It represents work-inprogress. There is not, as yet, an optimum sonification tool, butit is felt that lessons have been learned along the way that willbe of use to other researchers. The work illustrates some of theproblems of making decisions in the vast space of sounds aswell as some of the practicalities of developing sonifications inparallel with research on the phenomena to be sonified.2.REVIEWThe practice of medicine can be very much a multi-modal skill.Traditionally doctors have relied on touch, smell and hearing aspart of the diagnostic process and many are skeptical of themodern trends towards purely visual and numerical approaches.The stethoscope is an example of the medical use of sound.It is not a sonification, as such, since it directly presentsexisting sounds (there is no data transformation involved) butnevertheless it demonstrates the power of sound in this context.Experiments have been carried out on the use ofsonification in medical applications. An excellent summary ofthese was presented in a tutorial by Hermann and Baier atICAD 2006 [3].As suggested above, modern medicine relies to a greatextent on visual representations of data including the kinds ofline graphs generated by machines such as electrocardiographsand electroencephalograms (ECG and EEG) for heart and brainmonitoring. Physicians learn to recognize patterns in thesetraces which are indicative of particular conditions. A numberof researchers have investigated the power of sonifiedalternatives, in which the doctor may hear the crucial patterns,including ECGs [4] and a number of different attempts tosonify EEGs [5-9]. Electromyography (EMG) is a similartechnique for evaluating and recording the activation signal ofmuscles, and these have also been sonified [10].Sonification has been applied to the identification ofdiseased tissue in magnetic resonance imaging (MRI) images[11]. Another experiment was relevant in that it was concernedwith the identification of malignancy [7]. This uses a vocalencoding. Grayscale images are reduced to a vector of threevalues per pixel, ‘the first denoting the probability that the pixelbelongs to an abnormal nucleus, the second being theprobability that the pixel belongs to a normal nucleus, and thethird being the probability that the pixel does not belong tonucleic tissue.’ (ibid.) These values are used to controlparameters of vocal tract models in generating vowel sounds.A previous attempt to sonify cells was carried out byNattkemper and colleagues [12]. They investigated multichannel fluorescence images of cells in a blood sample,whereby the intensity values identify the presence of a molecule
The 16th International Conference on Auditory Display (ICAD-2010)via immunofluorescence. Their sonification was also vocalrelated, based on the mapping of data vectors to diphones,thereby generating ‘artificial words’. Testing was carried outwith non-biologist participants under three conditions: visual,auditory and combined. Participants had to match sample cellsto a reference cell and classify them as either identical ordifferent. These were then scored as either correct, falsepositive or false negative.Results showed no difference between the three conditions.However, this result should not be discouraging. As long as thecombined results are no worse than the (conventional) visualmethod, there is scope for improvement. In particularNattkemper et al. were working with non-experts. Furthermore,they were being tested under artificial conditions. In a morerealistic environment, where technicians are examining samplesfor hours at a time, the use of multiple channels might prove tomake a difference.3.INTRODUCTION TO THE PROJECTIt is important to clarify the aims of this project. The idea is tosupport the human cytologist in making decisions about thecells under review; it is not to provide automated classificationof the cells. There are viable approaches to automated screeningof cervical cells (e.g. [13]). In practice these can be used toscreen out clearly normal samples, but when it comes to makingmore difficult discriminations, human operators are stillrequired.By the same token, sonification in this context cannot referto the generation of an alarm when an abnormal cell isencountered. To be able to do that would amount to automatedscreening.Rather, the idea is to present the cytologist with additionalinformation which is either not present in the visual image, or ishard to discern within it. Additional information can come fromsources such as: the direct computation of certain cell statistics (size ofcell, size of nucleus, etc.), which the cytologist needs toestimate using his/her experience; the microscope magnification power used to produce theaudio, which could be higher than that used whilescreening; the use of image enhancement methods, for instancecontrast enhancement, on particularly dark regions of theslides.The auditory field is envisaged as a complement to the visualfield and matching the cytologist’s screening pace.The project involved a number of different aspects. Mucheffort was expended on processing the visual images in order toextract the information to be displayed in the auditory form. Itwas also necessary to find a suitable auditory mapping todisplay that information and it is this latter aspect which ispresented in this paper.A number of different approaches were investigated. Thesereflect development of the ideas, but also the fact that theobjectives changed as the parallel research on the cell analysischanged. That is to say that ideas developed as to what was tobe conveyed in the sounds. This paper thus represents a reviewJune 9-15, 2010, Washington, D.C, USAof the development of the sonification strategies. It is hopedthat the reader will learn about some alternative approaches tosonification, the tools that were used to create them and ourlessons from coping with the shifting sands of research. Furtherdetails of this research can be found in [14].4.BACKGROUNDCervical cancer takes time to develop. There is usually a periodwhen some of the cells lining the cervix develop abnormalchanges but are not yet cancerous; these can give rise tocervical cancer later on. Doctors can pick up these changesthrough screening, and a simple treatment can prevent cancerdeveloping.Women who get cervical cancer have had past infectionswith a high-risk strain of HPV (Human Papilloma Virus, orwart virus), but the vast majority of women infected with theseviruses do not go on to develop cervical cancer.A vaccine to prevent HPV infection has now been licensedfor use within the European Union. This vaccine preventsagainst the strains of HPV that are most likely to cause cervicalcancer. However, it is not complete protection against allstrains. Also, as it takes between 10 and 20 years for a cervicalcancer to develop after HPV infection, it will still be importantfor women to carry on with cervical cancer screening.Nowadays, cervical cancer amounts to 10% of all cancercases diagnosed in women worldwide, with around 2,880 newcases diagnosed in the UK every year1.Thus cervical cancer represents one of the most preventableforms of the disease and regardless of the development ofvaccination, screening is going to continue to play a vital part.Women take part in the test by making a visit to theirgeneral practitioner’s surgery or to a family planning clinic,where a doctor or a nurse sweeps around the cervix with animplement to collect a sample of surface cells. The sample isthen either smeared and fixated onto a glass slide (smearmethod) or preserved in a fluid (Liquid Based Cytologymethod) and sent to a laboratory. Women should receive thetest result within 6 weeks from the date of the test2.At the laboratory, the samples are stained with thePapanicolaou (‘Pap’) stain. As a result of the staining process,the cells and their major components (cytoplasm, nucleus) aremade visible. The sample on the slide is protected by a glasscover strip. All slides are labelled and matched to a patientdatabase. The staining process is described in some detail in[15].Across the UK, the preparation method used for smears isthe Liquid Based Cytology (LBC) method – which gives betterquality slides. The term ‘smear’ is frequently given a generalmeaning that includes both smears and LBC slides.The slides go through a strict screening process, whoseaims are 1) to detect any abnormal cell changes, 2) to assess thetype and severity of abnormal cell change when it is observed,and 3) to report the presence of a number of infectious agents,when .org.uk/cervical/index.html
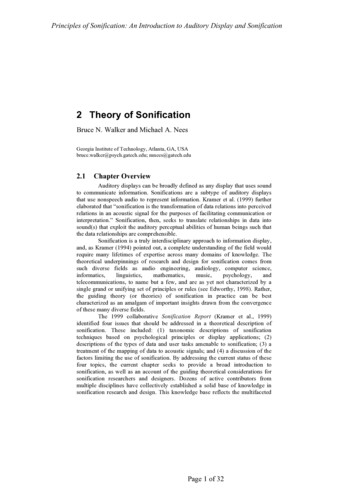
The 16th International Conference on Auditory Display (ICAD-2010)The number of cells per slide varies, depending on anumber of factors, but it is usually of the order of 40,000 to10,000. See Figure 1.Two screening modes are used: the full screen where everycell in the slide must be inspected, and the rapid screen, used inquality control reviews, where only a reduced number of fieldsof views are inspected. Full screenings should be processed at arate of 8-12 slides per hour and a recommended rapid screentakes about 60 seconds [16].In a full screen, the slide is scanned methodically, in avertical or horizontal fashion and using overlapping fields ofview. The screening of a slide is usually done at a lowermagnification (x10 or x20), switching to x40 if anything ofinterest is present on the field of view. Also, although with theLBC technique the cells are mostly arranged on the slide in amonolayer, the cells themselves have a thickness that can beexplored by adjusting the lens’s focus. The outline of a normalcell’s nucleus should be regular and unchanging on the wholethickness of the cell. Cell clumps are also often inspected atvarious focus depths.June 9-15, 2010, Washington, D.C, USAalso something that people are good at. In other words,coherent data, represented appropriately can reveal patterns.Many branches of information technology are concerned withthis kind of processing: either automatically identifying thepatterns in the data, or transforming the data so that the patternsbecome more apparent to the human observer – orcombinations of both of these. This is the objective ofsonification: to transform data into an (auditory) form tofacilitate pattern recognition and hence extraction ofinformation by human users.In the case of this project, data are available from thescanning (in visible light) of microscopic cells. Those data areconventionally presented as visual pictures (visualizations), andskilled operators learn to extract the relevant information fromthat representation (i.e. to recognize abnormal cells). Yet, thereis no reason why the same data should not be represented in anauditory form. There are a number of potential benefits: information which is contained in the data but which isnot apparent in the visual representation may be detectedin the auditory one; presenting the same data on different channels simultaneously may help the user’s interpretation; multimodal presentation may also (positively) affect other,higher-level human factors, such as concentration,attention and (alleviation of) boredom.With these objectives in mind and given the data that wereavailable from cell samples, appropriate and effective soundmappings had to be found. A number of different approacheswere tried and they are described in the following sections.5.1. Color mappingFigure 1. An LBC slide at x40 magnification. This slidecontains no abnormal cells.Cytologists work under a strictly controlled regime withregard to the number of hours they can work and the breaks thatthey must take. Despite all the care taken, errors do occur. Falsenegatives and false positives are both to be avoided as much aspossible. A false negative is clearly dangerous as it implies awoman who is likely to develop cancer believing that she ishealthy. False positives cause patients unnecessary stress andover-treatment.The objective of this project is to provide the cytologistswith additional support in their task. The hope is thatinformation encoded in sounds will help them to analyzefeatures of cells that are hard to detect visually or even notpresent in the visual rendering.5.APPROACHES TO SONIFICATIONData represent the lowest level of information. In digitaltechnology, data is represented (and can be measured) in bitsand can be easily manipulated and transformed. At a higherlevel, data can be transformed and combined to representinformation. This can be achieved through technology, but it isSince smear slides are colored with chemical stains, anoverview of the status of cells is aided by the fact that cellnuclei are colored purple, and that other colors tend to attach tocertain cell attributes. Typical signs of abnormal cells include: enlarged cell nuclei irregular nuclear outlines uneven distribution of chromatin (nuclear material) generally dark staining of the nuclei.Thus an algorithm was created which deduced the average HSV(Hue, Saturation and Value, a measure of Brightness) of asection of the slide containing several cells [17]. Using thesoftware toolkit Pure Data1 the user was allowed to move themouse freely around the image, and sound was continuallysynthesized, mapping luminance and hue onto a frequencyscale, and saturation onto the sound’s amplitude.The synthesis method was very simple, so that the focuscould be on the effectiveness of the interaction. Frequencymodulation of two sine waves was used, and a series ofexperiments was carried out to ensure that the more intenselydark-stained a cell was, the higher the carrier frequency, themore extreme the modulation, and the louder the overallamplitude. This has the effect of making darker areas give riseto loud, high frequency sounds which were (on purpose) ratherunpleasant. This allowed the user to freely move around the1http://puredata.info/
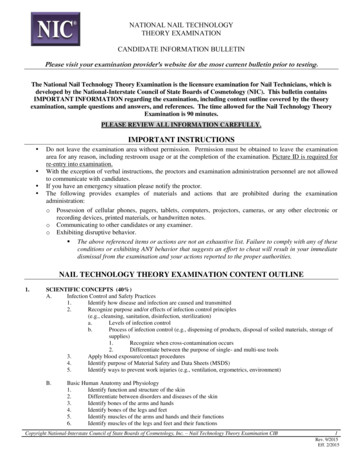
The 16th International Conference on Auditory Display (ICAD-2010)image and easily hone in on areas which were more densely anddarkly stained.In experiments, test participants were asked to identify acell field as ‘normal’, ‘slightly abnormal’ or ‘abnormal’, simplyby listening to the sounds produced as they moved around animage (invisible to them) of a field of cells. Our researcherPodvoiskis concluded:Results from both experiments showed subjects wereable to identify and classify images based on a soundrepresentation only. These results were proven to bestatistically significant. [17]It is interesting to note that the test participants at this stagewere not trained cytologists, but music technology students, yetthey were able to identify correctly the more grossly abnormalcells by sound alone.However, these very positive effects were only apparentwhen grossly abnormal cells were present in suitably largeclusters, and could be picked up by a user moving a mouse to‘focus in’ on such denser areas. Subsequent study showed thatthe majority of cells which need to be identified by cytologistsare usually much more borderline, and this method was not ableto distinguish these. In addition, the synthesis method was verysimple and would not stand up to long-term listening.The technique of mapping colors of a cell-field to sound isstill worthy of further investigation, particularly if the spatialposition of each contributing cell could be portrayed in sound.5.2. Scanning images for textureNext, we undertook a series of experiments [18] working withCSound 1 , to generate sounds which represented the internalstructure of individual cells. One of the major indicators ofabnormal cells is an irregular distribution of chromatin insidethe cell nucleus.This work explored the use of granular synthesis to createsounds whose perceived ‘grittiness’ portrayed the severity ofthe distribution of the chromatin, and was thus an indicator ofabnormality. The mapping used looked at the gradient of pixeldarkness to show where the dark spots were placed within thecell’s nucleus. The horizontal spacing of these spots wasportrayed using stereo panning; the vertical was represented bya frequency scale. The user is not allowed to freely scan theimage with a mouse, but instead the computer performs anauto- scan left to right across the cell and then repeated downthe cell.The segmentation and modification of the image prior tosonification (using custom-defined image processing algorithmsin MATLAB) became an important part of the work (Figure 2),but one which was time-consuming.1http://www.csounds.com/June 9-15, 2010, Washington, D.C, USAFigure 2. Interface to the MATLAB/CSound sonificationtool, allowing basic control of the audio scan carriedout on visually processed cell images.Test participants reported that the granular sounds were highlyirritating and would not be put up with for long periods.Later phases of the work explored the use of filtered noisesounds as a ‘softer and smoother’ portrayal of the chromatin,and later still some more-musical notes based on piano synthesis. Some promising results were obtained by using thescanning technique to directly sonify the pixels as binary valuesonce they had passed through the thresholding algorithm.One of the main limitations of this method is the long time(not available to pressured cytologists) taken to: visually identify a cluster of cells zoom in to the correct resolution modify the image’s coloration to achieve best contrast listen to the scanning of the nuclear data from left to rightand then downwards.However, the main problem with this approach is that, whateverthe sound quality, it would inevitably be perceived as in somesense an ‘average’ of the cells in view, whereas what thecytologist is generally looking for is the one cell (or smallnumber of them) which is abnormal, that is not average.The following studies were then carried out to discover if itwere possible to clearly portray the state of multiple cellssurrounding the current position by using sound spatialization.5.3. Sound SpatializationWe undertook an investigation into whether all the cellssurrounding the user’s current position could be rendered in asonic space around the listener [17].The software used was Scilab2, an open-source computationpackage similar to MATLAB. Data was spatialized using HeadRelated Transfer Functions (HRTFs). The image being‘viewed’ was split into 9 segments surrounding the current‘centre-point’. The software produces a radar-type sweeparound the image, and generates sound in the correspondingpositions for a listener wearing headphones.At this point in the research it was decided to produce a‘badness’ rating for each cell undergoing examination, by preprocessing the cell data, mapping to a number from 1 to 10,where 1 is ‘normal’ and 10 is ‘highly abnormal’.2http://www.scilab.org/
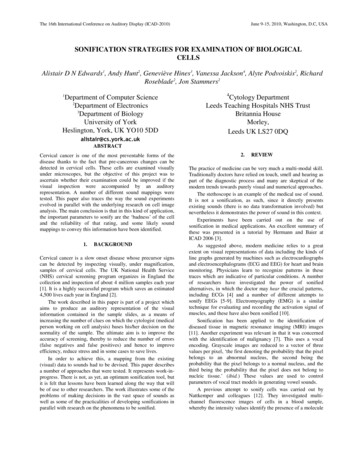
The 16th International Conference on Auditory Display (ICAD-2010)June 9-15, 2010, Washington, D.C, USAWe experimented with a variety of sonification methods toand not an obvious linear mapping of ‘badness’. Future work inportray the ‘badness’ of each cell surrounding the listener.this area should attempt to dispense with the disorientatingThese included:‘sweep’ and to play all of the sounds together in one surrounda) Additive synthesis, where increasingly discordantsound field, which is much more analogous to how multipleovertones are added as the badness number increases. Thissounds reach our ears from the real world. Based on thesewas found to produce mostly unpleasant sounds.sounds, a questionnaire was devised where the participantsb) Sampled audio files, where sounds are used to represent awere the screening cytologists of the Leeds NHS Trust. Itnatural landscape (based on [7]). Cows gently mooing werecovered questions about:mapped onto ‘not bad’, dogs barking were in the middle The individual’s music preferences and listening modeand a person screaming represented the severely abnormal(headphone, iPod, speakers, live music etc.);cells. (Table 2). their attitude to the research (bearing in mind these arevisual analysts being asked to consider audio input);User tests found that the sampled audio portrayal was mucheasier to listen to and locate. However, the apparently arbitrarychoice of animal sounds came across as quite bizarre to some,Sample OriginalMax‘Badness’Notes on Design 9Created from a slice of human speech. Very short and quiet.2.wav80-23.54100-199Unedited recording of a ‘popping’ sound made with lips.3.wav57-11.24200-299Edited recording of a bubble popping in boiling water.4.wav53-25.79300-399Synthesized ‘pop’ sound – high in treble content. Short reverb used.5.wav379-3.69400-499Edited recording of noises made with the mouth. EQ applied.6.wav154-0.15500-599Synthesized ‘pop’ combined with recording of mouth noises. EQ7.wav354-5.93600-699Recording of another type of mouth ‘pop’, with effects.8.wav315-0.01700-799Synthesized ‘pop’ combined with recording of mouth noises. EQ9.wav424-0.19800-899Synthesized ‘pop’ combined with recording of mouth noises. Reverb.10.wav649-0.01900-999Boiling water recording with heavy editing. Huge amounts of EQ and reverbused.Table 1. Sounds used in the sound preferences experiment.‘Badness’ 9700-799800-899900-999Soundcow mooingfrog croakinghorse whinnyingbird tweetingcat meowingseagull cryingman shoutingdog barkingmonkey howlingwoman screaminghear sounds which were directly related to real-world sounds(such as some of the examples water-type sounds) and manywere not convinced how ‘musical’ sounds might be perceived.Table 2. Mappings from ‘badness’ values to sounds. how they would prefer to interact with a sound-generatingsystem; their thoughts about what different types of cell should‘sound like’.The questionnaire concluded with a practical session: The playback of several of the sounds, and the request torate them as ‘good’ to ‘bad’, and ‘like’ to ‘hate’. Several cell images, with the subject being asked to selectfrom a choice of 3 sounds which best represented that cell.(Figure 3).Results showed that cytologists, on the whole, would like tohear an ear-catching, alarm-type sound when an abnormal cell ispresent, but that a quiet sound should be present the whole time,to ‘show that the system is still working’. They did not want toFigure 3. Sample selection screen. Participantsindicated which sound they felt best represented thecells in view.5.4. Subjective sound selectionIt had become evident in the image analysis research that itwould be possible to calculate two quantities for cells: 1) theapparent degree of abnormality and 2) the confidence of thatrating. It also became evident that the distinction was notbetween ‘good’ and ‘bad’ cells, but rather between normal andbad. That is to say that most of the cells a cytologist will see arenormal. The message to be communicated (aurally) to thecytologist for the majority of cells should be calm and neutral.
The 16th International Conference on Auditory Display (ICAD-2010)For cells which might be abnormal there should be an alertingsound (but not an alarm – see the earlier discussion) and thesound should be more insistent if the probability of abnormalityis greater.None of the previous experiments specifically providedguidance on the choice of such sounds. It was therefore decidedto embark on a different kind of experiment to help withidentifying suitable kinds of sounds. Some of the soundsgenerated in the earlier experiments were to be included,though, for comparison.It was important to test the perception of sounds by as widea population as possible in order to identify ones which wouldbe likely to have the highest acceptability to any users. Wewould want to include specialists (cytologists) in the testing,but not to be exclusive to them. It was therefore necessary toask people to map sounds to qualities that would be meaningfulto them – and not cell images which would convey meaningonly to cytologists. It was therefore decided that the mappingshould be to ‘Smiley faces’, as in Figure 4.In order to capture data from as wide a population aspossible, the test was mounted on the Web1. Visitors started ona briefing page and gave their assent to taking part. They wouldthen hear a set of 42 sounds, one at a time (and only once each).They would then select which of the Smileys they thought bestmatched the sound. They also had the option of selecting Don'tuse this sound, in which case they were invited to explain theiropinion. This was in order to ensure that sounds which are(generally) aesthetically unacceptable could be identified. Atthe end of the sounds the participants filled in a shortbackground questionnaire.NormalUndecidedBadFigure 4. The three Smileys used in the experiment.Normal represents most cells, which are not cause forconcern; bad would be a cell which is almost certainlyabnormal and undecided represents the (common) casein which the cell may be abnormal, but the probabilitythat it is so is not high.The sounds used varied greatly. Some came from theprevious experiments, others were everyday sampled soundsand still others were based on everyday sounds but processed insome way. We started with no preconceptions. That is to saythat we had no intent as to which sounds would be mapped towhich image. The aim was to find out about the kinds of soundswhich mapped well to the categories. Later we wouldinvestigate how to create a set of sounds which would thenconvey the required categories – and the spaces between them.That is to say that it is not anticipated that all cells will beclassified into one of the three classes; there will be a largespace between (for instance) Normal and Undecided.1http://www-users.cs.york.ac.uk/ alistair/sonifyJune 9-15, 2010, Washington, D.C, USAThis experiment is continuing and it is too soon to draw anyconclusions. It is perhaps not surprising that initial resultssuggest high levels of subjectivity in responses. This reinforcesthe observation that sound aesthetics are vital and subjective. Itmight imply that different sound sets should be provided fromwhich individuals can select.6.DISCUSSIONPattern matching is a fundamental skill, not the least in medicalinvestigations. Many researchers have remarked on the powerof human hearing to detect patterns in sounds and hence havetried to apply sonification as an alternative or an addition tovisual pattern recognition in medical data. That is the approachapplied in this project.The richness of the sound space gives much scope for theuse of sounds – but it also poses a dilemma for the designer inmaking choices as to what kinds of sounds to use and how tomap the relevant parameters onto them. This is a commonproblem, articulated in most publications on sonification.Within this project was also apparent another problem (which isprobably common in other similar projects) – that the underlying application represents a moving target as the research onit develops.The work on extracting data from the cell images andclassifying it was proceeding in parallel with the developmentof sounds, and the ideas as to what was important about thecells changed.The initial assumption was that all cells in the visual fieldshould be sonified in parallel. That was dropped because itbecame apparent that any such sonification would effectivelypresent an ‘average’ of the cells, whereas it is the one or twonon-average (abnormal) cells which are important. Thus, it wasdecided to concentrate on the one ‘most interesting’ cell in
Leeds Teaching Hospitals NHS Trust Britannia House Morley, Leeds UK LS27 0DQ ABSTRACT Cervical cancer is one of the most preventable forms of the disease thanks to the fact that pre-cancerous changes can be detected in cervical cells. These cells are examined visually under microscopes, but the objective of this project was to