Transcription
Low Temperature PlasmaTechnology LaboratoryCALIBRATION OF LANGMUIR PROBESAGAINST MICROWAVES ANDPLASMA OSCILLATION PROBESFrancis F. Chen, John D. Evans, and Wade ZawalskiLTP-1202February, 2012Electrical Engineering DepartmentLos Angeles, California 90095-1594UNIVERSITY OF CALIFORNIA LOS ANGELES
Calibration of Langmuir probes against microwaves and plasma oscillationprobesFrancis F. Chen, John D. Evans, and Wade ZawalskiElectrical Engineering Department, University of California, Los Angeles 90095The use of Langmuir probes for measuring plasma density is subject touncertainty because the theories commonly used to interpret the data give widelydiffering results. This is especially troublesome in partially ionized plasmas used,for instance, in the semiconductor industry, since no existing theory adequatelytreats the case when there are a few collisions between ions and neutral atoms. Inthis work, plasma densities measured by microwave interferometry and plasmaoscillation probes are compared with those from probe data analyzed withLangmuir’s Orbital Motion Limited (OML) theory, the Allen-Boyd-Reynolds(ABR) theory, and the Bernstein-Rabinowitz-Laframboise (BRL) theory. It isfound that ABR underestimates and BRL overestimates the density, the problemsbeing the neglect of ion orbiting in ABR and the effect of ion-neutral collisions inBRL. The best theory is either OML or the geometric mean between the ABRand BRL results. For thicker probes, other methods are suggested.I. History of this paperThis experiment was conducted during a one-week visit by W. Zawalski fromHiden Analytical, Ltd., in the approximate year 2000. The results were written into along paper a year later by J.D. Evans and submitted to Plasma Sources Sciences andTechnology1 in 2001. After several interchanges with the referees, the lead author (JDE)did not succeed in making the requested changes before leaving UCLA and the physicscommunity altogether. The data taken by Evans and Zawalski lay fallow for over adecade, though a few of the results were published previously2. The entire set has beenrecovered by the senior author (FFC) and is presented in this shortened paper. This workextends an earlier study by Tuszewski and Tobin3 which used low-frequency RF(radiofrequency) discharges in which compensation for RF pickup was difficult. Theyfound probe-derived densities to be a factor of 2-3 higher than those from microwaveinterferometry but could not eliminate RF interference as the cause.II. BackgroundElectrostatic probes, appropriately named after Langmuir, are the simplest method tomeasure local values of plasma density n and electron temperature Te. The general technique hasbeen described in various books4,5,6,7 and will not be reviewed here. Electron temperature can beobtained from a semi-logarithmic plot of the electron current collected by the probe. Plasmadensity can be obtained by the ion saturation current Isat, and the interpretation of Isat is thesubject of this paper. Here electron and ion densities are assumed to be equal in all plasmas ofconsequence. In principle, electron density can also be obtained from the electron saturationcurrent, but we do not using this datum because that current can be altered by collisions and strayfields in practical plasmas.In 1926 Mott-Smith and Langmuir8 calculated the ion current Ii(Vp) at negative values ofthe potential Vp applied to a cylindrical probe. It was assumed that the ions started at infinityisotropically with the same energy, and that there was no sheath. That is, the plasma potential Vs
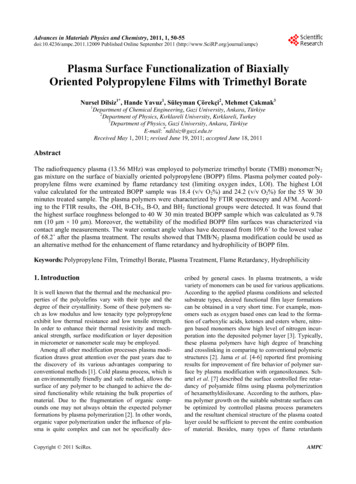
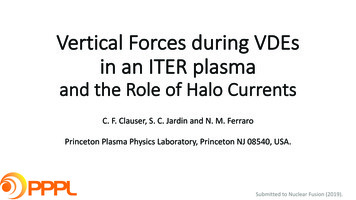
2(for space potential) varied very gently from the probe to infinity. The ions approaching theprobe with large angular momentum would orbit and miss it, while those with small angularmomentum would be collected. The ion current could then be given by a very simple formula:1/ 22 e(Vs1 V p ) I i Ap ne π M ’(1)Where Ap is the probe surface area, e is the electron charge, M is the ion mass, and Vs1 is asubstitute for the space potential. This formula predicts that Ii2 should vary as Vp, giving astraight line I2 – V plot from which n can be calculated. The intercept Vs1 of this line is not thereal Vs because Eq. (1) is not valid near Vs, and Ii actually curves near there. Eq. (1) is extremelyuseful because it is independent of both ion energy and the Maxwellian Te, both of which havecanceled out. The density n can be obtained by a simple fitting of this line to the Isat data byadjusting n and Vs1. Later, Langmuir extended the theory to Maxwellian ions with a temperatureTi starting from a sheath edge at a radius s. The result was a group of more complicatedformulas involving error functions. A series of unreasonable approximations is necessary toreduce this set to Eq. (1). An attempt9 to justify Eq. (1) physically was unsuccessful, but a linearI2 – V plot fits experiment better than all other theories.Since most plasmas have very small Debye lengths λD, a sheath should form around aprobe tip, creating an “absorption radius” inside of which the electric field is so strong that ionsinside this radius would be drawn in by an electric field strong enough to prevent any orbiting.The first attempt to treat the case of a thin sheath around a probe was made by Allen, Boyd, andReynolds10 in 1957. This is called the ABR theory. Ions were assumed to start from infinitywith no transverse energy, so that they all traveled radially to the probe. A sheath was formed topartially shield the probe’s negative voltage, and all ions were collected without orbiting. Thepotential distribution and ion current could be computed from a fairly simple radial differentialequation, which originally was for spherical probes but has been extended to cylindrical ones11.The neglect of orbiting was too severe a simplification, and in 1958 one of us (FFC)convinced I.B Bernstein to tackle the problem of including both sheath formation and orbiting.The problem was complicated by the fact that orbiting ions contribute twice to the ion density ateach radius, while collected ions, whose number is not known beforehand, contribute only once.Bernstein’s elegant solution12 was a two-part differential equation that was computed byRabinowitz. Monoenergetic ions were assumed to start at infinity isotropically. Extending thisto Maxwellian ions with temperature Ti turned out to be a more difficult problem because ofnumerical instabilities. J.G. Laframboise succeeded in this task; his results were given in anunpublished paper13 and have been summarized by Chen4,11. This is called the BRL theory. Thenumerical curves have been fitted to algebraic approximations by Steinbruchel14, Tuszewski andTobin3, and Chen2. These three theories, OML, ABR, and BRL, will be used to compute the iondensity from measured ion currents.III. Apparatus1. Plasma source. Experiments were carried out in the chamber shown in Fig. 1. APlasmaTherm ICP (Inductively Coupled Plasma) source is mounted on top of a vacuumchamber lined with small permanent magnets forming a “magnetic bucket”15, which helps toconfine the plasma drifting down from the source. The three-turn antenna is wound around theperiphery of the ceramic source chamber. Though the RF energy is deposited only in a thin skinlayer near the circumference, the plasma density is almost radially uniform, as shown in Fig. 2.How this can happen has recently been explained by Curreli and Chen16. The antenna is driven
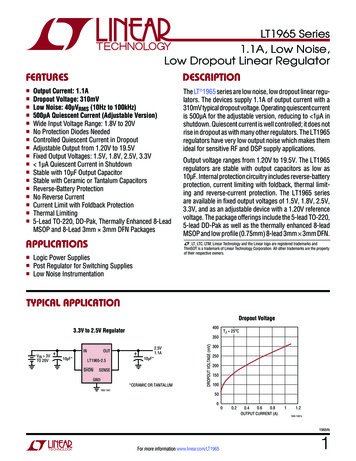
3at 2 MHz by an RFPP Model RF10M generator up to 1 kW. Plasma was produced at 300, 450,600, 750, and 900 watts at neutral argon pressures of 1, 2, 5, and 10 mTorr, yielding a matrix of20 conditions spanning typical conditions in industrial plasma processors. 0R (c m )10Z(c m )A ntenn aC eram icLiner1020Plasm aOscillationProbe (POP)M icrow aveInterfero m etry(M W I) W in dowHiden ESPLangm uirProbe30Fig. 1. PlasmaTherm ICP source on top of a magnetic bucket. A 3-turn spiral antenna is wrapped around a 1cm thick ceramic liner which contains the plasma it creates when energized with RF. A Hiden ESP Langmuir probe (right) and the POP (left) are visible through an MWI access window. All diagnostics samplethe region R 0, at axial distance z 22 cm from the top of the source. Machine parameters: module I.D. 32cm, module-bucket interface at z 16.4 cm, bucket I.D. 35.5 cm, bucket height 20.5 cm, RF power Prf 300 – 900 W, neutral pressure p0 1 10 mTorr Ar, plasma density n 4 1010 – 5 1011 cm -3 and electrontemperature Te 2 – 4 eV.1210n (1010 cm-3)3 mTorr, 1.9 MHzPrf(W)88002402006420-505r (cm)101520Fig. 2. Density profiles in the ICP of Fig. 1. The density is peaked on axis even though the skin depth of the RF isonly 3 cm.2. Diagnostics. The diagnostic system is shown in Fig. 3. The Langmuir probe isinserted from the bottom. At the same height, 22 cm below the top plate, a microwaveinterferometer (MWI) beam is injected across the plasma to measure the line-integrated plasmadensity by comparing the phase shift between the leg that passes through air and the one thatgoes through the plasma. The electronics for this are from an HP 8510C network analyzer.Near the Langmuir probe there is also a Plasma Oscillation Probe (POP) consisting of a hotfilament and an antenna connected to a spectrum analyzer. This diagnostic will be describedlater. The MWI and POP measure the electron density, which should be the same as the iondensity measured by the Langmuir probe.
4Fig. 3. Conceptual cutaway (top) view of experimental setup, including the essential elements of the diagnostics.Also shown (dotted lines) is the plasma volume subtended by the MWI signal beam path, which encompasses theregion sampled by the POP and Langmuir probes.The Langmuir probe is the Hiden ESP Mk2 system consisting of a probe, a voltagesweep circuit, and software ESPsoft HAL IV to collect and analyze the data. The probe has atungsten tip of radius Rp 0.075 mm and length Lp 1 cm and an RF compensation system withRF chokes and a large RF compensation electrode as prescribed by Sudit et al.17 The softwarecan apply a cleaning voltage to the probe and take an I – V (current-voltage) curve of severalhundred points in a couple of seconds. It can also analyze the data with the OML or ABR theoryautomatically or semi-automatically with user inputs. Our analysis was done, however, withExcel files written by the authors.IV. Measurements1. Langmuir probes. Figure 4 is an example of probe data taken in this experiment.The I2-Vp (or V) plot in the ion region is close to linear. It is fitted with a polynomial. RFcompensation is so good that the ln(Ie)-Vp plot is linear over almost three orders of magnitude,indicating a Maxwellian distribution. The derivative dI/dV whose minimum should occur at thespace potential, shows a well defined peak. However, not all data are this good in RF plasmas.0.12-20.10-6dI / dVI 0V(a)0500510V15(b)202530
516100DataFit10I (mA)82I (mA)212IeIe (fit)Ie Fig. 4. (a) Entire I – V curve; (b) Derivative of I – V curve with a sharp minimum indicating the plasma potential;(c) Plot of Ii2 vs. Vp (o) and straight-line fit ( ); (d) Semilog plot of Ie vs. Vp and straight-line fit to a Maxwellian.A critical parameter is ξp Rp/λD, the ratio of probe tip radius to the Debye length, whichdetermines whether the sheath around the probe is thin or thick, and whether there is anabsorption radius. To illustrate how I – V curves change with ξp, we next show recent data froma helicon discharge, which can reach higher densities than an ICP.0.2510IeIe(fit)Ie (0)Ii squaredIi squared (OML)0.200.15Ie (mA)2I 0(a)24 V681012(b)Ii2Fig. 5. (a) Plot ofvs. Vp as in Fig. 4c. (b) Semilog plot of Ie vs. Vp and a Maxwellian fit, as in Fig. 4d. Forconvenience the Ie data were taken only up to l mA. The OML result is n 0.80 1011 cm-3 and KTe 1.60 eV (ξp 1.92)Figure 5 shows the ion and electron parts of a low-density discharge. We first analyzethe data with OML theory. We see that Ii2 in (a) falls on a straight line, whose least-squares fityields the density n according to Eq. (1). The electron current Ie is obtained by subtracting thestraight-line Ii fit from the total current. The ln(Ie) vs. Vp plot is shown in Fig. 4b. A Maxwelliandistribution appears as a straight line on this plot, sinceI e nevthe e(V p Vs )/ KTe,(2)where vthe is the electron random velocity. It is seen that the ln(Ie) points form a straight line, afit to which has a slope yielding KTe, according to Eq. (2). Since n is already known from Ii (avery convenient feature of the OML formula), the horizontal position of the fitting line yields Vs.Note that Vs1 in Eq. (1) is only the intercept of the ion fit and is not the actual Vs, since Ii(Vp)curves near floating potential Vf and deviates from a straight line there. The behavior of Ii nearVf is immaterial, since n is determined from the points at large negative Vp. The red line in theln(Ie) plot gives the raw Ie data before Ii subtraction. An accurate value for KTe depends on an
6accurate subtraction of the ion current. Use of this part of the I – V curve is necessary only if RFcompensation is insufficient to give a true Te nearer to Vs.When the same data are analyzed with the BRL theory (Fig. 6), the theoretical ion currentdeviates from a straight line only slightly at the highest Vp . Both n and Te agree with the OMLanalysis because n is low enough that ξp is small, and in this limit BRL reduces to OML.100.2510.15I (mA)2I (mA)20.200.100.10.010.050.00-100IeIe(fit)Ie (2)Ii g. 6. Same data as in Fig. 5 but analyzed with the BRL theory. The result is n 0.81 1011 cm-3 and KTe 1.60eV (ξp 1.93).0.2510IeIe(fit)Ie (2)Ii squaredIi(theory)0.200.15I (mA)2I -50V510Fig. 7. Same data as in Fig. 4 but anal
Plasma was produced at 300, 450, 600, 750, and 900 watts at neutral argon pressures of 1, 2, 5, and 10 mTorr, yielding a matrix of 20 conditions spanning typical conditions in industrial plasma processors. Antenna Z(cm) R(cm) 0 10 30 10 20 Plasma Oscillation Probe (POP) Microwave Interferometry (MWI) Window Hiden ESP Langmuir Probe Ceramic .