Transcription
Digital microscope testmaterials and test methodsDocument version 2Notes on the status of this document This is a very early draft and at this stage reviewers should consider the document structure and content ratherthan focus on specific details. Areas where there is substantial uncertainty are shown in red test and manysections are as yet undefined and marked 'TBD' – volunteers to provide input for these sections would bewelcomed.This is currently written as an ICC White Paper that provides recommendations. Is this appropriate or is thereanother direction that should be considered?The current approach suggested is on the whole a measurement‐based approach and may be unnecessarilycomplex. An alternative visual assessment approach would also be possible but that approach may make it moredifficult to define acceptance criteria.Measuring slides and displays is currently described as being out of scope for this white paper. Should we includepointers to 'best practice' documents? There are standards for the measurement of displays but I do not know ofany standards for the measurement of microscope slides. In order to obtain representative measurements ofslides, consideration must be given to the geometry of the viewing optics.Contributing authors' declaration of interestW Craig ReviePeter JacksonWei‐Chung ChengMike ShiresYukako YagiDavid McDowellEmployed by FFFEI Limited, a developer of imaging hardware and software. FFEI has developeda scanning hardware platform that is provided on an OEM basis to a number of manufacturersof whole slide imaging systems.Retired Biomedical Scientist. Part time lecturer in Cellular Pathology, Bradford university.Honorary researcher University of Leeds Pathology and Tumour Biology.[TBD]Employed by The University of Leeds and runs the Histology Service for the Leeds Institutes ofMolecular Medicine.[TBD: Assistant Professor of Pathology at Harvard Medical School and Director of the PathologyImaging and Communication Technology Center at MGH.][TBD: Retired imaging expert with many years of experience of standardising processes forimaging systems. Expert for Kodak in many ISO Committees for many years.][TBD: is this necessary?]ICC draft white paperVersion 2
1 Contents1Contents. 22Scope. 43Introduction . 44System overview . 55Measurement methods . 56Reference slide (colour) . 66.1The set of colours . 66.2Measurability. 76.3Stability . 76.4Slide identification . 86.5Scanning requirements. 87Reference image file . 88Display and viewing conditions. 88.1Presentation of slide images . 88.2Viewing conditions . 8Description of tests . 999.1Capture‐to‐display test using telespectroradiometer. 99.2Capture‐to‐display test using contact spectrophotometer. 99.3Capture module test. 99.4Display module test . 99.4.110Test for displayed digital values . 9Test scenarios and tolerances. 1010.1Product qualification . 1010.2Installation qualification . 1010.3Periodic qualification . 1010.4Visual assessment. 1011Identification of operating mode. 1012Annex A: stains and staining protocols . 1112.1Haematoxylin and Eosin (H&E). 1112.2Diaminobenzidine (DAB) with Haematoxylin counter stain. 1112.3Papanicolaou (PAP). 1112.4Perls' Prussian blue. 1112.5Periodic acid‐Schiff (PAS). 1112.6Reticulin . 1112.7Millers elastic Van Gieson. 1112.8Shikata . 1112.9Giemsa stain . 1112.10Ziehl Neelsen technique. 1212.11Grocott . 12ICC draft white paperVersion 2
12.12Alcian blue PAS. 1212.13Jones methenamine silver. 1212.14Gram. 1212.15Congo red stain for amyloid . 1212.16Masson trichrome . 12ICC draft white paperVersion 2
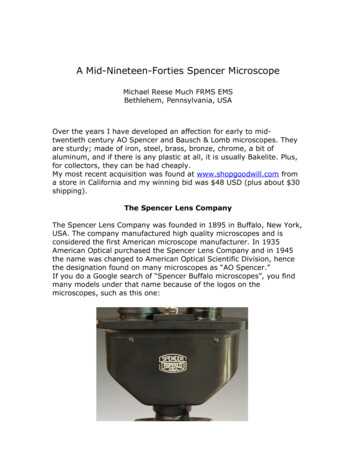
2ScopeThis ICC white paper provides recommendations for the design of test materials, test methods and tolerances for theassessment of colour performance of digital microscopes, in particular whole slide imaging (WSI) systems. This islimited to bright field RGB imaging of stained pathology slides and particular attention is given to the assessment ofsamples stained with variations of Haematoxylin and Eosin (H&E) as this is the predominant staining protocol used inmost laboratories worldwide.To some extent the assessment methods assume that ICC colour management methodology is used and in particularthat an ICC profile for the image capture system is associated with the images produced. The test methods, however,do not rely on any particular calibration model and digital microscope vendors are free to use any calibration systemthey would like as long as they meet the overall colour aims.One source of substantial colour variation is the process of slide staining which has not been standardised andindeed staining to accommodate the preference of individual pathologists is a widespread practice. Although thestaining of slides is out of the scope of this white paper, some understanding of the likely variations in colour due todifferent staining practice is necessary to ensure that the test materials includes a suitable set of colours.The primary objective of these assessment methods is to ensure that digital microscopes are fit for purpose and toimprove the reliability of diagnosis of disease using these systems.3 IntroductionDigital microscopes, in particular whole slide imaging (WSI) systems provide an alternative to conventional opticalmicroscopes as a means to assess stained tissue samples. WSI systems provide many potential benefits such asimage analysis, remote diagnosis, education and easy case review. There is, however, a need for a framework thatwill allow regulators and users of these systems to check their colour consistency.The figure below shows a generic schematic for a digital microscope system. A microscope slide that has beenstained and prepared for viewing is illuminated by a light source and focused by means of imaging optics on RGBsensors. The image captured by these sensors is then processed in some way to create an RGB image of the slide.Viewer software presents the RGB image of the slide on a display for viewing. The way in which the image ispresented on the display along with the viewing environment determines the colour seen by the image observer(usually a pathologist).The spectral responses of the RGB Sensors of digital microscopes do not in general match those of a typical humanobserver, such as that defined by the CIE standard colorimetric observer. Nor do the responses of different digitalmicroscopes match each other. In addition the processing, viewer software, display response and viewingenvironment introduce further variables. Some form of colour management is required to reduce these errors sothat the set of colours that are important to a pathologist are displayed consistently on the display.There is therefore a need for an independent colour assessment method that uses a standard microscope slide andthat will test that the set of colours on this slide are displayed correctly. This white paper makes recommendationsfor a reference microscope slide and defines a method for assessing images of the reference slide when presentedon a display.For some systems, the RGB image of the slide can be assessed independently of any display and so additionalguidelines are provided for the assessment of these image files to allow the image capture module to be assesICC draft white paperVersion 2
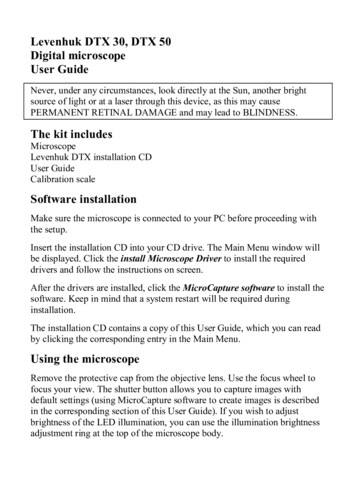
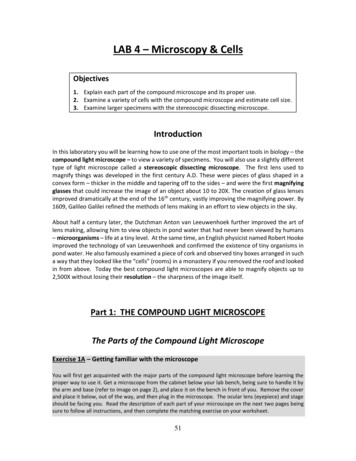
independently of other system components. Similarly, guidance is provided for assessment of the image displaymodule comprising the viewer software, display hardware and viewing environment. In this way, these two majorsystem components can be assessed independently.[TBD: describe objectives and limitations of the test materials and methods]4 System overviewA simplified flow diagram for the test methods is shown below.A reference slide is scanned by a digital microscope whose image capture module prepares an image file which isstored on the system. This image is prepared for on‐screen viewing by a display module and the displayed image isviewed by an observer or measured by a measurement system.The details of the image capture module vary from system to system but generally include imaging optics, RGBimage sensors and image processing software. Similarly the display module includes viewer software which includesan image processing component, device driver software, display hardware and firmware and the viewingenvironment. The test methods have been designed to test the image capture module and display module withoutrequiring any knowledge of the specific details of how these systems operate.This white paper provides recommendations for the construction of a reference slide, a method for obtainingmeasurements of the reference slide (A), a method for estimating colour values in the slide image file (B) and amethod for measuring the display colour values as perceived by the image observer (C).In some cases it is useful to be able to assess the display module independently of the image capture module, forexample where third party viewer software is used, and this is shown schematically in the figure below. This whitepaper provides recommendations for a reference image file, associated reference image colour values (D) and ameans for measuring the display colour values (E).Methods for assessing colour accuracy and other image attributes for an end‐to‐end test (A compared to C), for animage capture module test (A compared to B) and for the display module test (D compared to E) are described.[TBD: the colour summit identified additional image attributes of dynamic range and spatial resolution. Should testmaterials and methods be defined for these here or would this be better in a separate specification?]5 Measurement methodsThe measurement of microscope slides and of displays is a complex topic which is out of scope of this white paperbut best practice methods (where they exist) should be adopted when making measurements.[TBD: We can provide more information of our method for discussion (WCC).ICC draft white paperVersion 2
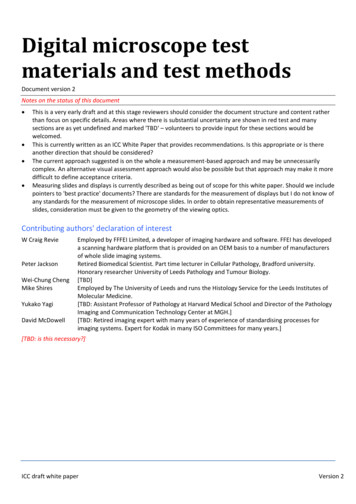
Do we need to address the measurement method in detail in this white paper? We expect someone will eventuallyprovide colour phantoms with the truth as products or services. However, I think it is important to bring up someissues related to the measurement results. For example: whether the measurement data is provided as spectral transmittance or tristimulus values with a presumed lightsourcehow uniform is the material of the colour phantom (e.g. colour filter vs. photographic film)what is the colour variation when the colour phantom is illuminated with different light sources (e.g. halogen vs.LED)Colour measured is highly dependent on the measurement geometry – specifically the light path through the materialbeing measured. The difference between different measurement geometries can be as much as 20% in optical densityso this may be an issue we can avoid although we could indicate that it is out of scope for this paper.Providing only tristimulus values would limit the usefulness of the phantom and if we provide spectral absorbance (ortransmittance) we do not need to provide the additional data about the phantom colour under different light sources.Most measuring instruments can provide reasonable spectral measurement data.]6 Reference slide (colour)The basic idea of a reference slide to be used to test colour is shown in the figure below. The slide comprises anumber of coloured patches with known (measured) colours along with measurement datums and slideidentification information.[TBD: the content, size, shape and location of coloured patches, the shape and location of the measurement datumsand details of slide identification may vary significantly from what has been shown here.]For a reference slide to be useful when testing the colour reproduction of a microscope system a number of aspectsneed to be considered: the set of colours on the slide should be representative of the colours encountered in day‐to‐day work,colours should be measurable,colours should be stable over time,the slide should be clearly identified,it should be possible to scan the slide easily on the systems to be tested.It would be impossible to include and test every possible colour that can appear on stained slides and so a subsetmust be selected. This subset should include colours that cover the gamut of colours, should include intermediatetones and perhaps most importantly a set of neutral tones.6.1 The set of coloursIt is usual to stain slides using a small number of stains which means that for any given staining protocol the range ofcolours expressed on an individual slide is constrained to a small region of colour space. The most commonly usedstaining protocol uses Haematoxylin and Eosin stains (H&E) and the typical set of colours for an H&E stained sampleis shown below.[TBD: add plot of H&E slide colours][TBD: it would be possible to define a reference slide that considers only H&E staining by including only colours thatarise in H&E stained slides. This approach would mean that such a system can only be qualified with reference to H&EICC draft white paperVersion 2
staining and it would seem that it would be more generally useful to qualify systems for a range of staining protocols.We need to decide how to address this. To start this discussion, a set of stains and staining protocols is provided inAnnex A.][Is tissue type important? The stain protocol and tissue type produce the resulting colour. We should include somediscussion of the tissue type here.This is a topic that needs further discussion and I agree that we need something here. The colour for most stainingprotocols depends only on the ratio of the two dyes present. This ratio changes depending on the tissue type but itmay be possible to use something other than tissue as the carrier for the stain and we should explore that topic.]6.2 MeasurabilityIt is important to be able to make measurements of coloured patches in a way that can be repeated. To achieve this,patches should be uniform in colour when viewed at the imaging resolution to be qualified. The measurementcentre, measurement aperture dimension and the required positional tolerance should be clearly specified.[TBD: details of uniformity requirement and anticipated repeatability.]Measurements should be spectral absorbance including samples over the range 380‐720nm with at most a 10nmsampling interval.[TBD: The objective magnification must be included when discussing the physical size of the colour patches. Commonmagnification for digital microscopes is X20 and X40 and both of these magnifications should be considered whendesigning a suitable target.][TBD: this is a highly simplified measurement model and if we decide this is the right approach will need furtherdetail including measurement tolerances.][TBD: is there an expectation that individual slides will be measured? If so how will their measurements be identified /communicated?The measurement location (in XY coordinate) could be included as part of the measurement data if the colour patchesare not perfectly uniform. This info can be used to study the discrepancies in the Capture‐to‐Display tests.There may be significant variation in the ability of scanners to pinpoint locations over the entire imaging area basedon a single datum. This can be solved by pattern recognition algorithms if the texture around the spot is unique oradditional datums are added to the slide. A simple cross correlation coefficient method can be used to identify some“markers” in tissue samples on the glass slide, and then use these markers to construct the XY coordinate system.We anticipate that a commercialized colour phantom will come with a long file describing the spectral reflectance ofevery patch. Technically it is not difficult to add two more columns to record the XY positions along with a descriptionof the datums.]6.3 StabilityMany coloured materials change in colour when exposed to light and the materials used to make the calibrationreference slide coloured patches should be selected to ensure that the colours are stable over a suitable period (howlong). The conditions in which the reference slide is stored may affect its stability.The required storage conditions along with the period over which the slide is stable should be clearly identified onthe reference slide.ICC draft white paperVersion 2
6.4 Slide identificationEach calibration reference slide should have a unique identification code to allow it to be referenced by anyassessment. This is particularly important in cases where the measurement data is stored separately from thereference slide.6.5 Scanning requirementsIt should be easy to scan the reference slide using the system configuration to be used for diagnostic work. Theautomated scanning of uniform colour areas presents some difficulties for digital microscopes as in many casesthese systems need some kind of variation in order to focus.[TBD: it may be necessary to add some marks to the slide to ensure that suitable focus can be achieved.]7 Reference image file[TBD: this image file will be equivalent to a scan of an idealised reference slide on a reference digital microscope andwill include an ICC profile that specifies image colours. There are many details to be considered when defining thisideal image but the most significant factors are the illumination source and sensor sensitivities of the referencedigital microscope. Candidates for these are CIE Illuminant E (spectrally flat) and the CIE colour matching functions(x bar ( ), y bar ( ), z bar ( )) which represent a standard observer (or perhaps more realistically a simple transformof these). Together along with spectral absorbance measurements of a reference slide these can be used to producean idealised image of the slide.]8 Display and viewing conditionsMany of the details of display requirements are outside of the scope of this white paper but care should be taken toensure that the display white point, colour gamut, dynamic range, uniformity and viewing angle are suitable for itsuse in diagnostic pathology.[TBD: we should refer to other best practice documents for display measurement and perhaps to providerecommendations for these criteria.]8.1 Presentation of slide images[TBD: this section will specify how to present images of the reference slide on screen ensuring that measurements ofthe display correspond with measurements of the reference slide.]8.2 Viewing conditionsIt is anticipated that displays will be used in a variety of different viewing conditions and that the image will beappropriately adjusted to ensure consistent appearance across viewing environments. Steps should be taken tocontrol the viewing environment to ensure that the ambient lighting remains well controlled and that there are nohighly coloured elements visible (directly or reflected on screen).[TBD: more details of minimum and maximum recommended illumination levels, ambient illumination colour andanticipated display compensation, perhaps based on DICOM GSDF.][TBD: what kind of colour match is required?This is perhaps the biggest point for discussion. It seems clear from discussions with pathologists they can workeffectively in a wide variety of viewing conditions and that the important aspect seems to be to ensure that the'colour context' is preserved. I think it would be impossible to agree what is meant by a perceptual match as this isinevitably to some extent subjective but we could probably agree requirements for a relative colorimetric match andthis may be the simplest approach. If we were to adopt this approach the viewing environment would be included bymaking measurements with a telespectroradiometer (for Product Qualification tests) and would be modelled bymeasuring the ambient using a contact spectrophotometer with an ability to measure ambient.So perhaps achieving a Relative colorimetric match is a reasonable objective.]ICC draft white paperVersion 2
9 Description of tests[TBD: is the following set of tests appropriate?]9.1 Capture‐to‐display test using telespectroradiometer[TBD: describe how to conduct A‐C test using teleradiometer. Scan slide and present image on screen and measureimage. Will need some way to measure the average colour of a region presented on screen, also need to considermagnification.One alternative to measuring the average colour of a certain region, which may be an odd shape would be to firstprofile the display (i.e., to build a display model, or obtain the mapping from DVI to CIEXYZ) and then predict theCIEXYZ of every pixel in this region. An FPGA could be used to retrieve the DVI signals.This may be more complex overall and may become quite complex as it would seem to require a profile of every pointof the display to provide a reasonable measure of its characteristics and is only practical when the display is sRGB.]9.2 Capture‐to‐display test using contact spectrophotometer[TBD: describe how to conduct A‐C test using contact instrument with radiant mode to perform a simple check of theviewing environment. Details will be similar to the above.]9.3 Capture module test[TBD: describe how to conduct A‐B test. This is basically a matter of scanning the reference slide and performing anassessment of the image created (including the associated ICC profile). This should include some description of how tocalculate the average and standard deviation of colour of a region of an image and on how to compare two sets ofcolours.][If the ICC profile is included in the A‐B test, what colour manager do we use? The factory software or our own?There may be scope for a new for a new product in this area to automate the process but the choice of colourmanagement module is unlikely to introduce significant variation compared to other variables although with 8‐bitdata precision, different CMMs always obtain different results due to the errors accumulated in the calculationprocess. This is worse for display devices because speed precedes accuracy so the differences are often in the range ofseveral delta‐E. Such colour errors seem minor when comparing with the other variables in a WSI system.We do need to consider the effect on the dynamic range reduction and colour quantisation introduced by such aprocess. Concern about this issue has been expressed by some pathologists who consider this to be a more seriousproblem than the colour accuracy issue.]9.4 Display module test[TBD: describe how to conduct D‐E test. Will be similar to the capture‐to‐display testing but will use the referenceimage rather than a scanned image.]9.4.1 Test for displayed digital values[Shall we add another checkpoint where the digital RGB values for examining the effects of the image viewer, colourmanager, and the display system hardware (graphics card) and software (display driver)? An FPGA board could beused to monitor the DVI signals.The FPGA approach helps the calibration check process in the following ways: Capture check: By isolating the display, the capture stage (A‐B) can be examined independently. The readout ofthe FPGA (DVI in sRGB) should be compared against the measurement (the calculated truth) of the colorphantom. If a WSI system passes such a test (even when a telespectroradiometer is not available), then at leastits image files are sound.Display calibration: The FPGA can directly inject pixel data (in sRGB) into the display for testing or profiling. Thedisplay can evaluated quickly without using the WSI scanner hardware or software. In comparison, a colorcalibration kit relies on system software to control the display, and the output display signals may or may not betampered by the display driver or graphics card.ICC draft white paperVersion 2
Cost: The FPGA hardware (by putting together off‐the‐shelf components) costs less than 350, which is cheaperthan a decent telespectroradiometer.Speed: The FPGA measures pixel values in milliseconds. The telespectroradiometer takes, say, 5 seconds to obtainone reading.Accuracy: The FPGA measures digital data with 100% accuracy. In contrary, optical measurement is sensitive tothe instrument calibration, measuring geometry, ambient light and temperature, etc.This model will be fine for sRGB but will be difficult to use in the case where the dis
Digital microscopes, in particular whole slide imaging (WSI) systems provide an alternative to conventional optical microscopes as a means to assess stained tissue samples. WSI systems provide many potential benefits such as image analysis, remote diagnosis, education and easy case review. There is, howev