Transcription
AIA Annual FundsReport 2019For Policyholdersaia.com.sg
AIA ANNUAL FUNDS REPORT 2019CONTENTSCEO MESSAGE2INTRODUCTION4IMPORTANT NOTICE5FUND PERFORMANCE SUMMARY6PORTFOLIO STATEMENTAIA Acorns of Asia FundAIA Elite FundsAIA Emerging Markets Balanced/Equity FundAIA European Equity FundAIA Global Balanced FundAIA Global Bond FundAIA Global Equity FundAIA Global Property Returns FundAIA Global Resources FundAIA Global Technology FundAIA Greater China Balanced/Equity FundAIA Growth FundAIA India Balanced/Opportunities FundAIA India Equity FundAIA International Health Care FundAIA Japan Balanced/Equity FundAIA Managed PortfoliosAIA Multi SelectAIA Regional Equity FundAIA Regional Fixed Income FundAIA S Money Market FundAIA US Equity 25STATEMENT OF ASSETS AND LIABILITIES129CAPITAL AND INCOME ACCOUNT135NOTES TO THE STATEMENTS147INDEPENDENT AUDITOR’S REPORT149ANNUAL STRATEGIC ASSET ALLOCATIONUPDATE FOR GUIDED PORTFOLIOS1521
2AIA ANNUAL FUNDS REPORT 20199 March 2020Dear AIA PolicyholderWe are pleased to update you the performance of AIA Annual Funds for the Year 2019.Disregarding the volatilities observed in the first three quarters of the year, the equitymarkets across the globe reported stellar returns by the end of 2019. For the first threequarters in 2019, bonds and gold delivered good returns amidst reports of deterioratingeconomic data. The escalation of US-China trade tensions, concerns on global growthand the ongoing uncertainty of “Brexit” led to lower bond yields for most part of the year,especially for short-duration bond instruments as investors flocked to safe-haven assets,resulting in the much talked about inverted yield curve. Several central banks reactedquickly to cut interest rates over the course of the year while European Central Bank hadalso restarted asset purchases. The 10-year US Treasury (“UST”) yield dropped more than100 basis points to a year-to-date low of 1.46% in early September 2019 before retracinghigher to end the year at 1.92%, following optimism on a phase one US-China trade dealand a decisive victory won by the UK Conservative Party to implement Brexit deal. InSingapore, government bond yields moved largely in tandem with UST yields which wererelatively more volatile during the year.The surprise was the accompanying strong performance of equities, reminiscent of thestrong rally observed two years ago in 2017. This is largely attributed to the about-facechange in stance by major central banks around the world, with most signaling a looseningmonetary policy to starve off an economic slowdown. With this tidal wave of central bankliquidity, a metaphorical calming shot in the arm was provided, sending both equities andbond yields alike to their respective historical highs and lows.We observed that US-China trade developments continue to influence sentiments in theequity markets. As we come to the end of 2019, global equities (as measured by MSCIWorld Index) delivered a total return of 28.4% with dividends in USD terms and with theannouncement of an impending interim trade deal, global and US equities rallied to newhighs. The S&P 500 Index gained 31.5% with dividends while Asia excluding Japan equitiesalso delivered a decent return of 18.2% with dividends. Within the Asia excluding Japanregion, Taiwan was the top performing market as the technology sector benefitted fromrising expectations of 5G adoption. Malaysia was the worst performer and the only marketthat suffered a negative return. As interest rates declined, strong demand for yield assetslifted the Singapore REITs, with the FTSE Straits Times REIT index gaining 27.2% withdividends and significantly outperforming the Singapore equities market.A low-interest-rate environment and the recently concluded phase one trade agreementbetween US and China are likely to set the stage for an improving growth outlook in 2020.This is supported by leading indicators such as the Global Composite Purchasing ManagerIndex, which appears to have bottomed in the fourth quarter of 2019. China is also expectedto maintain a loose fiscal policy to buttress growth prospects. A re-acceleration in globalgrowth should help arrest the negative earnings revision trend that was evident in most of2019, this is essential to sustain healthy returns, especially for asset classes like equitieswhere valuations have risen substantially.On the AIA front, 2019 financial market’s performance is reflected in the performance ofour Investment-linked Plan (ILP) funds. All our ILP funds delivered positive performance
AIA ANNUAL FUNDS REPORT 2019for the year. The best performers were sectoral funds - AIA Global Technology Fund andAIA Global Property Returns Fund. Both funds delivered impressive performance of morethan 30% for 2019.Our flagship funds like AIA Acorns of Asia Fund and AIA Regional Equity Fund haveachieved commendable performance of 14% and 19% respectively for the year. For fixedincome funds, both AIA Regional Fixed Income Fund and AIA Global Bond Fund deliveredoutstanding performance of more than 6% for the year, driven by monetary stimulus fromcentral banks which led to the fall in bond yields. These funds are also ranked top quartilewithin their respective peer group, bearing testimony to the rigorous selection process forthe appointment of our ILP fund managers.2020 will continue to be a year of uncertainty and volatility with potential escalation of globaltrade war, geopolitical tensions and the US Presidential election. Staying invested, anddiversification is key in such an environment where valuations are no longer as attractive.To achieve this, it is important to leverage on the investment capabilities of our best-in-classfund managers to deliver long-term returns and to stay ahead of the game.One could consider the AIA Platinum Wealth Elite plan launched in July 2019. This bespokewealth solution, a strategic initiative by AIA, offers protection and wealth creation. Thisplan provides access to renowned institutional fund managers as well as leverages on thedynamic asset allocation capabilities of AIA Investment Management, through a choice ofthree specially crafted portfolios linked to your risk profile.AIA remains a key life insurer managing one of Singapore’s largest investment-linkedinsurance funds with more than S 8 billion assets under management as at 31 December2019.We look forward to serving your financial needs and being your insurer of choice for yearsto come. Thank you for your continued trust in AIA.Yours sincerely,Patrick TeowChief Executive OfficerAIA Singapore3
4AIA ANNUAL FUNDS REPORT 2019INTRODUCTIONWelcome to the AIA Annual Funds Report 2019The following pages offer a review of AIA Funds for January to December 2019. For eachfund you will find useful information including: Portfolio Statements - contains a breakdown of the fund’s holdings – the assets that thefund manager has invested in. This information is broken down by country, industry type,asset class and top 10 holdings. Statement of Assets and Liabilities - describes the market value of the fund, and itsassets and liabilities. Capital and Income Account - outlines the fund’s income (namely interest on deposits)minus expenses (investment expenses and fund charges) to arrive at its net income orloss for the year.You will also find updates on Guided Portfolios, which are four well diversified portfoliosput together by AIA with advice from our strategic partner, Mercer. Updates include: Latest Strategic Asset Allocation developed by Mercer in their annual review; and Performance of the Guided Portfolios as of 31 December 2019When investing, it is important to know your risk profile which may change over timedepending on your needs and investment objectives. Hence, we recommend that youmeet with your AIA Financial Services Consultant or Insurance Representative to reviewyour fund holdings periodically. This report may be helpful during the review process.It is important to consider your investment goals and your progress towards them in thecontext of an appropriate risk profile. The investment approach that is suitable for youmay involve changing your fund holdings over the years. Your AIA Financial ServicesConsultant or Insurance Representative can advise you on that.If you would like to learn more about our AIA funds, please visit aia.com.sg for our ILPonline fund tools where you will find useful information such as the fund performance,factsheets as well as interactive charts to help you better manage your investment.
AIA ANNUAL FUNDS REPORT 2019Important NoticeThis report is published for informationalpurposes only. Fund returns are in Singaporedollars on a bid-to-bid price basis with netdividends reinvested. The AIA Funds areinvestment-linked policy sub-funds offered byAIA Singapore Private Limited (AIA) and areonly available under AIA Investment-LinkedPolicies. AIA is the product provider.Investments are subject to investment risksincluding the possible loss of the principalamount invested. Past performance, as wellas the prediction, projection or forecast on theeconomy, securities markets or the economictrends of the markets are not necessarilyindicative of the future or likely performanceof the AIA Funds. The performance of theAIA Funds is not guaranteed and the valueof the units in the AIA Funds and the incomeaccruing to the units, if any, may fall or rise.Investments in the securities, instruments,currencies and other assets mentionedherein are not deposits or other obligationsof, or guaranteed or insured by AIA.This report does not constitute investmentadvice and was prepared without regard tothe specific objectives, financial situation orneeds of any particular person who may readit. It is not to be taken in substitution of theexercise of judgment by the reader, who shouldseek separate legal and financial advice andshould read the relevant documents beforeinvesting. If such person chooses not to doso, he should consider carefully whetheran investment in the security, instrument,currency or other asset is suitable for him. Anyreliance on the information or opinions hereinis therefore entirely at the reader’s own risk.AIA accepts no liability for any direct, special,indirect, consequential, incidental damagesor any other loss or damages of any kindarising from any such use of the informationherein (including any error, omission ormisstatement herein, negligent or otherwise)or further communication thereof, even if AIAor any other person has been advised of thepossibility thereof.Although the information was compiled fromsources believed to be reliable, AIA doesnot guarantee its accuracy, completeness,correctness or timeliness for any particularpurpose and the information and opinionscontained may change without notice. Theopinions may be formulated based on anumber of assumptions, which may turn outto be invalid, and in reliance on the viewsof research teams within the group situatedoutside of Singapore. All third party data arecopyrighted by and proprietary to the provider.AIA and its associates, their directors, officersand/or employees may have positions orother interests in, and may effect transactionsin the securities, instruments, currencies andother assets mentioned herein for themselvesor their clients.A product summary and product highlightsheets relating to the AIA Funds areavailable and may be obtained from your AIAFinancial Services Consultant or InsuranceRepresentative. You should read the productsummary and the product highlight sheetsbefore deciding whether to subscribe forunits in any AIA Funds.This report is not intended for distributionto, or use by, any person or entity in anyjurisdiction or country where such distributionor use would be contrary to law or regulationand may not be published, circulated orreproduced in whole or in part without theprior written consent of AIA.If you have any queries arising from, or inconnection with, the information containedin this report, please contact AIA SingaporePrivate Limited (Company Registration No.201106386R).5
6AIA ANNUAL FUNDS REPORT 2019Fund Performance SummaryTABLE OF FUND PERFORMANCEAs at 31 December AIA Acorns of Asia Fund6.395.435.665.11AIA Elite Adventurous Fund*5.604.89N/AN/AAIA Elite Adventurous Fund (USD)*8.027.87N/AN/AAIA Elite Balanced Fund*2.782.89N/AN/AAIA Elite Balanced Fund (USD)*5.775.82N/AN/AAIA Elite Conservative Fund*0.000.92N/AN/AN/AN/AN/AN/AAIA Emerging Markets Balanced Fund5.835.477.425.32AIA Emerging Markets Equity Fund9.268.7410.026.43AIA European Equity Fund8.485.836.206.23AIA Global Balanced Fund3.761.825.574.52(1.23)(1.71)2.381.65AIA Global Equity Fund5.675.947.288.25AIA Global Property Returns Fund1.35(1.41)9.305.28AIA Global Resources Fund4.236.65(1.08)2.65AIA Global Technology Fund7.1910.927.6916.05AIA Elite Conservative Fund (USD)*AIA Global Bond FundAIA Greater China Balanced 1.52AIA India Balanced Fund(0.28)1.701.380.99AIA India Equity Fund(0.73)2.40(3.24)(0.73)AIA India Opportunities FundAIA Greater China Equity FundAIA Growth Fund(0.93)2.400.12(0.73)AIA International Health Care Fund9.3710.559.5911.59AIA Japan Balanced Fund3.693.237.767.62AIA Japan Equity Fund5.634.9710.6610.43AIA Multi Select 301.351.463.754.38AIA Multi Select 503.323.315.105.18AIA Multi Select 705.235.166.445.93AIA Portfolio 301.330.584.173.53AIA Portfolio 502.681.995.104.94AIA Portfolio 704.163.406.486.35AIA Portfolio 1007.342.428.985.29AIA Regional Equity Fund6.878.696.266.09AIA Regional Fixed Income Fund0.830.643.693.47AIA S Money Market Fund0.360.350.820.77AIA US Equity Fund5.435.907.409.91* Only available for AIA Platinum Wealth Elite
AIA ANNUAL FUNDS REPORT 2019As at 31 December 20191-year3-year Fund Benchmark*%%5-year 10-year Since inception Fund Benchmark*%%Fund Benchmark*%%Fund Benchmark*%%Fund 948.8711.888.6311.5310.8412.811.214.06 Annualised returnsImportant Note: Please refer to the individual Fund’s page for Benchmark details, Disclaimer and Fundinception date.7
8AIA ANNUAL FUNDS REPORT 2019AIA Acorns of Asia FundFUND PERFORMANCEAs at 31 December ar 5-year 10-year Since inception 4.787.26 Annualised returns* Inception to 30 April 2016 - 60% MSCI AC Far East Free ex-Japan index (DTR Net) & 40% JPMorgan Sing Govt. Bond Index AllFrom 1 May 2016 onwards - 60% MSCI AC Asia ex-Japan index (DTR Net) & 40% JP Morgan SingGovt. Bond Index AllNote: Fund inception date - 31 August 2001. Fund returns in SGD, bid-to-bid, net dividends reinvestedDisclaimer with regard to the above Benchmark:The blended returns are calculated by AIA Investment Management Private Limited using end ofday index level values licensed from MSCI (“MSCI Data”). For the avoidance of doubt, MSCI is notthe benchmark “administrator” for, or a “contributor”, “submitter” or “supervised contributor” to, theblended returns, and the MSCI Data is not considered a “contribution” or “submission” in relationto the blended returns, as those terms may be defined in any rules, laws, regulations, legislation orinternational standards. MSCI Data is provided “AS IS” without warranty or liability and no copyingor distribution is permitted. MSCI does not make any representation regarding the advisability ofany investment or strategy and does not sponsor, promote, issue, sell or otherwise recommend orendorse any investment or strategy, including any financial products or strategies based on, trackingor otherwise utilizing any MSCI Data, models, analytics or other materials or information.
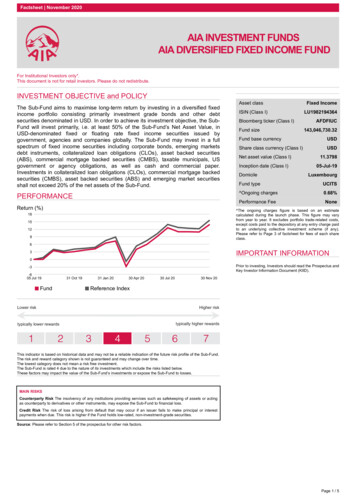
AIA ANNUAL FUNDS REPORT 2019AIA Acorns of Asia FundPORTFOLIO STATEMENTSAs at 31 December 2019Country Allocation SingaporeChinaHong KongIndiaKoreaTaiwanUnited KingdomPhillipinesAustraliaThailandSri rmanyPortfolio of InvestmentsOther Net AssetsTotalMarket ValueSGD% of NetAsset 61,09523,504,5471,350,265,64298.261.74100.009
10AIA ANNUAL FUNDS REPORT 2019AIA Acorns of Asia FundPORTFOLIO STATEMENTSAs at 31 December 2019Industry Allocation Market ValueSGD% of NetAsset folio of InvestmentsOther Net 261.74100.00Asset Class Market ValueSGD% of NetAsset er DiscretionaryReal EstateInformation TechnologySovereign Government ObligationsTelecommunication ServicesIndustrialHealth CareMaterialsConsumer StapleEnergyGovernment AgencyUtilitiesEquitiesFixed Income SecuritiesHybrid SecuritiesOther Net AssetsTotal
AIA ANNUAL FUNDS REPORT 2019AIA Acorns of Asia FundPORTFOLIO STATEMENTSAs at 31 December 2019Credit Rating of Debt Securities** AaaA1A2A3Baa1Baa2Baa3Ba1Not ratedMarket ValueSGD% of NetAsset 0.232.581.772.843.203.150.718.47** Moody’s ratings or their equivalent, S&P rating where security is not rated by Moody’s but rated by S&PTop 10 Holdings as at 31 December 2019 Taiwan Semiconductor Manufac TWD10Samsung Electronics Co Ltd KRW5000Tencent Holdings LtdAlibaba Group Holding-SP ADR BabaSingapore Gov't SIGB 2 3/4 03/01/46HDFC Bank LimitedSingapore Gov't SIGB 3 3/8 09/01/33ICICI Bank Ltd ICICIBCTechtronic Industries Co HKD0.1United Overseas Bank Ltd NPVTop 10 Holdings as at 31 December 2018 Taiwan Semiconductor Manufac TWD10Samsung Electronics Co Ltd KRW5000Tencent Holdings LtdSingapore Gov't SIGB 3 3/8 09/01/33Alibaba Group Holding-SP ADR BabaHDFC Bank Ltd INR2Techtronic Industries Co HKD0.1Swire Properties Ltd HKD1United Overseas Bank Ltd NPVUnited Overseas UOBSP 3 1/2 05/22/26Market ValueSGD% of NetAsset t ValueSGD% of NetAsset 0,9604.393.903.713.542.912.861.621.511.441.42 Information given is provided by AIA Investment Management Private Limited11
12AIA ANNUAL FUNDS REPORT 2019AIA Acorns of Asia FundOTHER INFORMATIONAs at 31 December 2019Exposure To DerivativesForward foreign exchange contractsMarket % of tment In Collective Investment SchemesN/ABorrowingsN/ATotal Redemptions and SubscriptionsTotal amount of redemptionsTotal amount of y TransactionsN/AExpense RatiosLocal Fund31 Dec 20191.54%31 Dec 20181.53%Note: Expense ratio does not include (where applicable) charges for insurance coverage, brokerageand other transaction costs, performance fee, foreign exchange gains/losses, front or back endloads arising from the purchase or sale of collective investment schemes and tax deducted atsource or arising out of income received.Turnover RatiosLocal Fund31 Dec 201945.50%31 Dec 201847.30%Any Material Information That Will Adversely Impact The Valuation Of The FundNILSoft Dollar CommissionsNIL
AIA ANNUAL FUNDS REPORT 2019AIA Elite FundsFUND PERFORMANCEAs at 31 December 2019AIA Elite Adventurous FundPeriod3-month6-month1-year3-year 5-year 10-year Since inception Fund 3.705.53 Annualised Returns*90% MSCI World Total Net Return Index & 10% Bloomberg Barclays Global Aggregate CorporateTotal Return Index.Note: Fund Inception date - 19 July 2019. Fund returns in SGD, bid to bid, net dividends reinvestedAIA Elite Adventurous Fund (USD)Period3-month6-month1-year3-year 5-year 10-year Since inception Fund 3.707.77 Annualised Returns*90% MSCI World Total Net Return Index & 10% Bloomberg Barclays Global Aggregate CorporateTotal Return Index.Note: Fund Inception date - 19 July 2019. Fund returns in USD, bid to bid, net dividends reinvested13
14AIA ANNUAL FUNDS REPORT 2019AIA Elite FundsFUND PERFORMANCEAs at 31 December 2019AIA Elite Balanced FundPeriod3-month6-month1-year3-year 5-year 10-year Since inception Fund (0.30)4.05 Annualised Returns*60% MSCI World Total Net Return Index & 40% Bloomberg Barclays Global Aggregate CorporateTotal Return IndexNote: Fund Inception date - 19 July 2019. Fund returns in SGD, bid to bid, net dividends reinvestedAIA Elite Balanced Fund (USD)Period3-month6-month1-year3-year 5-year 10-year Since inception Fund 2.706.00 Annualised Returns*60% MSCI World Total Net Return Index & 40% Bloomberg Barclays Global Aggregate CorporateTotal Return IndexNote: Fund Inception date - 19 July 2019. Fund returns in USD, bid to bid, net dividends reinvested
AIA ANNUAL FUNDS REPORT 2019AIA Elite FundsFUND PERFORMANCEAs at 31 December 2019AIA Elite Conservative FundPeriod3-month6-month1-year3-year 5-year 10-year Since inception Fund (0.40)2.83 Annualised Returns*30% MSCI World Total Net Return Index & 70% Bloomberg Barclays Global Aggregate CorporateTotal Return IndexNote: Fund Inception date - 19 July 2019. Fund returns in SGD, bid to bid, net dividends reinvestedAIA Elite Conservative Fund (USD)Period3-month6-month1-year3-year 5-year 10-year Since inception Fund .10)0.55 Annualised Returns*30% MSCI World Total Net Return Index & 70% Bloomberg Barclays Global Aggregate CorporateTotal Return IndexNote: Fund Inception date - 19 July 2019. Fund returns in USD, bid to bid, net dividends reinvestedDisclaimer with regard to the above Benchmark for AIA Elite Funds:The blended returns are calculated by AIA Investment Management Private Limited using end of dayindex level values licensed from MSCI (“MSCI Data”). For the avoidance of doubt, MSCI is not thebenchmark “administrator” for, or a “contributor”, “submitter” or “supervised contributor” to, the blendedreturns, and the MSCI Data is not considered a “contribution” or “submission” in relation to the blendedreturns, as those terms may be defined in any rules, laws, regulations, legislation or internationalstandards. MSCI Data is provided “AS IS” without warranty or liability and no copying or distributionis permitted. MSCI does not make any representation regarding the advisability of any investmentor strategy and does not sponsor, promote, issue, sell or otherwise recommend or endorse anyinvestment or strategy, including any financial products or strategies based on, tracking or otherwiseutilizing any MSCI Data, models, analytics or other materials or information.15
16AIA ANNUAL FUNDS REPORT 2019AIA Elite FundsPORTFOLIO STATEMENTSAs at 31 December 2019AIA ELITE ADVENTUROUS FUNDInvestment In Collective Investment SchemeMarket ValueSGD% of NetAsset ValueAIA Investment Funds - AIA Global Quality Growth FundAIA Investment Funds - AIA New Multinationals FundAIA Investment Funds - AIA Global Multi-Factor Equity FundAIA Investment Funds - AIA Diversified Fixed Income 8817.536.59Total30,063,44894.00Market ValueUSD% of NetAsset 811,843,51997.26Market ValueSGD% of NetAsset ValueAIA Investment Funds - AIA Diversified Fixed Income FundAIA Investment Funds - AIA Global Quality Growth FundAIA Investment Funds - AIA New Multinationals FundAIA Investment Funds - AIA Global Multi-Factor Equity 23.5911.86Total8,652,16293.99AIA ELITE ADVENTUROUS FUND (USD)Investment In Collective Investment SchemeAIA Investment Funds - AIA Global Quality Growth FundAIA Investment Funds - AIA New Multinationals FundAIA Investment Funds - AIA Global Multi-Factor Equity FundAIA Investment Funds - AIA Diversified Fixed Income FundTotalAIA ELITE BALANCED FUNDInvestment In Collective Investment Scheme
AIA ANNUAL FUNDS REPORT 2019AIA Elite FundsPORTFOLIO STATEMENTSAs at 31 December 2019AIA ELITE BALANCED FUND (USD)Investment In Collective Investment SchemeMarket ValueUSD% of NetAsset .551,543,48999.55Market ValueSGD% of NetAsset ValueAIA Investment Funds - AIA Diversified Fixed Income FundAIA Investment Funds - AIA Global Quality Growth FundAIA Investment Funds - AIA New Multinationals FundAIA Investment Funds - AIA Global Multi-Factor Equity tal524,08287.05Market ValueUSD% of NetAsset ValueAIA Investment Funds - AIA Diversified Fixed Income FundAIA Investment Funds - AIA New Multinationals FundAIA Investment Funds - AIA Global Quality Growth FundAIA Investment Funds - AIA Global Multi-Factor Equity tal487,95899.75AIA Investment Funds - AIA Diversified Fixed Income FundAIA Investment Funds - AIA Global Quality Growth FundAIA Investment Funds - AIA New Multinationals FundAIA Investment Funds - AIA Global Multi-Factor Equity FundTotalAIA ELITE CONSERVATIVE FUNDInvestment In Collective Investment SchemeAIA ELITE CONSERVATIVE FUND (USD)Investment In Collective Investment Scheme17
18AIA ANNUAL FUNDS REPORT 2019AIA Elite FundsPORTFOLIO STATEMENTSAs at 31 December 2019AIA ELITE ADVENTUROUS FUNDTop 10 Holdings as at 31 December 2019*AIA Investment Funds - AIA Global Quality Growth FundAIA Investment Funds - AIA New Multinationals FundAIA Investment Funds - AIA Global Multi-Factor Equity FundAIA Investment Funds - AIA Diversified Fixed Income FundMarket ValueSGD% of NetAsset .8817.536.59Top 10 Holdings as at 31 December 2018*Market Value% of NetSGD Asset ValueNot available as the AIA Elite Adventurous Fund commenced on 19 July 2019.* Information given is provided by AIA Investment Management Private LimitedAIA Elite Adventurous Fund invested more than 30% of its assets in AIA Investment Funds - AIAGlobal Quality Growth Fund and AIA Investment Funds - AIA New Multinationals Fund.The following are the top 10 holdings in the AIA Investment Funds - AIA Global Quality Growth Fundand AIA Investment Funds - AIA New Multinationals Fund.AIA INVESTMENT FUNDS - AIA GLOBAL QUALITY GROWTH FUNDTop 10 Holdings as at 31 December 2019*Amazon.com IncMarketAxess Holdings IncSoftBank Group CorpShopify IncNetflix IncFirst Republic Bank/CAFacebook IncTaiwan Semiconductor Manufacturing Co LtdAlibaba Group Holding LtdAlphabet IncMarket 4091,767,6561,759,5151,737,2421,671,3101,627,981% of NetAsset Value5.204.273.643.602.722.602.592.552.462.39
AIA ANNUAL FUNDS REPORT 2019AIA Elite FundsPORTFOLIO STATEMENTSAs at 31 December 2019Top 10 Holdings as at 31 December 2018*Market ValueUSD% of NetAsset ValueNot available as the AIA Investment Funds - AIA Global Quality Growth Fund commencedon 5 July 2019.*Information extracted from the underlying AIA Investment Funds - AIA Global Quality Growth FundAIA INVESTMENT FUNDS - AIA NEW MULTINATIONALS FUNDTop 10 Holdings as at 31 December 2019*Microsoft CorpMerck & Co IncNovartis AGDeere & CoHome Depot Inc/TheColgate-Palmolive CoTexas Instruments IncStarbucks CorpBHP Group PLCDBS Group Holdings LtdTop 10 Holdings as at 31 December 2018*Market 8632,558,3562,324,5002,298,3582,285,0352,278,464% of NetAsset t ValueUSD% of NetAsset ValueNot available as the AIA Investment Funds - AIA New Multinationals Fund commenced on5 July 2019.*Information extracted from the underlying AIA Investment Funds - AIA New Multinationals Fund19
20AIA ANNUAL FUNDS REPORT 2019AIA Elite FundsPORTFOLIO STATEMENTSAs at 31 December 2019AIA ELITE ADVENTUROUS FUND (USD)Top 10 Holdings as at 31 December 2019*AIA Investment Funds - AIA Global Quality G
Our flagship funds like AIA Acorns of Asia Fund and AIA Regional Equity Fund have achieved commendable performance of 14% and 19% respectively for the year. For fixed income funds, both AIA Regional Fixed Income Fund and AIA Global Bond Fund delivered outstanding performance of more than 6% for the year, driven by monetary stimulus from
