Transcription
Energies 2015, 8, 8650-8681; doi:10.3390/en8088650OPEN ACCESSenergiesISSN 1996-1073www.mdpi.com/journal/energiesArticleA Closed-Loop Control Strategy for Air Conditioning Loads toParticipate in Demand ResponseXiaoqing Hu 1,*, Beibei Wang 1,†, Shengchun Yang 2,†, Taylor Short 3,† and Lei Zhou 1,†123†Department of Electrical Engineering, Southeast University, Nanjing 210096, China;E-Mails: wangbeibei@seu.edu.cn (B.W.); zhouleiseu@gmail.com (L.Z.)China Electric Power Research Institute, Nanjing 210003, China;E-Mail: yangshengchun@epri.sgcc.com.cnDepartment of Electrical Engineering and Computer Science, University of Tennessee, Knoxville,TN 37996, USA; E-Mail: tshort4@vols.utk.eduThese authors contributed equally to this work.* Author to whom correspondence should be addressed; E-Mail: happysnow2004@126.com;Tel.: 86-135-1165-0864; Fax: 86-25-8379-3371.Academic Editor: Thorsten StaakeReceived: 15 July 2015 / Accepted: 6 August 2015 / Published: 14 August 2015Abstract: Thermostatically controlled loads (TCLs), such as air conditioners (ACs), areimportant demand response resources—they have a certain heat storage capacity. A changein the operating status of an air conditioner in a small range will not noticeably affect theusers’ comfort level. Load control of TCLs is considered to be equivalent to a power plant ofthe same capacity in effect, and it can significantly reduce the system pressure to peak loadshift. The thermodynamic model of air conditioning can be used to study the aggregatepower of a number of ACs that respond to the step signal of a temperature set point. Thispaper analyzes the influence of the parameters of each AC in the group to the indoortemperature and the total load, and derives a simplified control model based on the two orderlinear time invariant transfer function. Then, the stability of the model and designs itsProportional-Integral-Differential (PID) controller based on the particle swarm optimization(PSO) algorithm is also studied. The case study presented in this paper simulates bothscenarios of constant ambient temperature and changing ambient temperature to verify theproposed transfer function model and control strategy can closely track the reference peakload shifting curves. The study also demonstrates minimal changes in the indoor temperatureand the users’ comfort level.
Energies 2015, 88651Keywords: demand response; thermostatically controlled loads; air conditioning;closed-loop control; peak load shifting1. IntroductionDemand Response (DR) is defined as the changes in electric usage by customers from their normalusage patterns with changes in the price of electricity over time. It is considered a critical application insmart grids. With the Advanced Metering Infrastructure (AMI), the power usage of different appliancescan be adjusted either directly, e.g., through incentive-based programs (IBP), such as operationalparameters/states changing requested by grid operators, direct load control, and interruptible loads;or indirectly, e.g., through price-based programs (PBP) [1], such as real-time pricing, time of use pricing,and critical peak pricing [2,3]. By smoothing out the system power demand over time, DR is capable ofproviding peak shaving, load shifting and ancillary services to achieve system reliability and stability.The performance of DR programs is measured by peak load reduction and demand elasticity.Traditionally, the power system adopts the strategy of “electricity production determined by loads” toachieve power balance. Loads have been regarded as the passive physics terminal. In recent years,the smart grid concept has become popular in the electric system. The communication capability of thenew intelligent service network and the loads’ controllability have been greatly improved. Direct LoadControl (DLC), which usually reduces the loads by controlling the thermostatically controlled loads(TCLs) of air conditioners, fridges, water heaters of the residential users or the small-business users,is an important type of incentive-based demand response. These kinds of loads are called flexible loads.They have heat energy storage ability and can switch or change the control parameters in a short time,which will not impact users. Meanwhile, they have the potential to balance system power. Flexible loadscan have a real-time response to the grid’s demand, reduce the backup capacity properly, and improvethe level of the power system to run safely and economically [4]. They can be incorporated into thenormal operation of power system’s dispatch by the demand response [5].Electricity shortages usually occur during peak hours in the summer or winter, when the percentageof the air-conditioning loads reach 30% 40% of the total capacity—the demand peak rises with thenumber of air conditioners in use, while during off-peak hours, there is usually a power surplus. Thetypes of the air conditioners include centralized and non-centralized [6,7]. A centralized air conditionercontrols the temperature in different rooms by a mainframe connecting to several terminals through theventilation system, while non-centralized air conditioners (ACs), which account for a large proportion ofall ACs, are installed in individual rooms and control the temperature independently. TCL presents ahuge opportunity in the power grid. The effect of controlling the loads of TCLs is equivalent to buildinga power plant with the same capacity. However, the investment of the demand response is much lowercompared with the construction of a new power plant, and reasonable load control has minimal impacton users. The cost for building a peaking power plant is 1200 dollars per kilowatt [8], while thecompensation for users about load management is much lower and can be put into use in a short time.There are several ways to model TCLs, including modeling based on the actual physical process,regression modeling based on historical data, and modeling based on the Fokker-Planck diffusion
Energies 2015, 88652equations. Other authors focus on a probability characteristics model and the use of black-box modelidentification techniques [9–11]. These models are often too complicated for the control system.For example, the physical process model, which needs to be converted to the mathematical model ofcontrol, cannot be directly used in numerical simulations. The regression model requires a large amountof historical data. Similarly, the model based on Fokker-Planck equation is very complex and difficult toimplement [12]. A state sequence model, proposed by Lu and Chassin, considers the uncertaintymodeling of thermostatically controlled loads. The disadvantage of this model is that it can only slowlychange the load over time.In most cases, the control scheme of TCLs is based on the idea of optimization. A scheduling decisionmodel has an objective function to maximize the load aggregate interest and to minimize the actualoutput deviation of ACs. It includes a constraint condition that the indoor temperature has to be withinthe range of [ Tmin , Tmax ] in order to ensure the user’s comfort level [13]. After the air conditioning model isdetermined, the air conditioning scheduling scheme is calculated using the optimization algorithm. Thismethod belongs to the open-loop control, with intensive calculation, cannot achieve accurate control andreal-time control which is based on load output change. The research by Na et al., on the direct loadcontrol (DLC) and controlling AC loads by electricity price in order to achieve the purpose of loadreduction does not include control strategies. Manichaikul and Schweppe used the predictive method tocontrol centralized TCLs and provide the auxiliary service for the power grid, taking the minimum erroras the target [14]. Centralized TCL load management is carried out by using the comfort control methodproposed in Malhamé’s and Chong’s paper. The reference signal which is compared with the actualsignal, is the desired aggregated air-conditioning load. Then, the temperature set points were calculatedusing the intima controller [15]. In [16], the electric heat load DLC algorithm is based on the statesequence control algorithm, which aims to stabilize tie-line power fluctuations between distributionnetwork and micro-grid including clean energy.These methods adopt price signals or power surge signals to control the switch state of the users’equipment. Although they can take part in the ancillary service of the power system, their time scale isusually counted in hours or days, so they cannot follow the target load curve closely. Currently, mostload control strategies destroy the diversity of the load group, resulting in power demand oscillation, andproduce negative effects to the power system [17]. Demand side customers’ satisfaction can be takeninto consideration using the load management (LM). A fuzzy membership function is established tocharacterize the users’ satisfaction according to the user’s continuous control time [18], but it is difficultto express the users’ comfort level directly. In this paper, a closed-loop control strategy to solve theabove-mentioned problems in existing methods is proposed.The core contribution and innovation of this paper lies in exploring a simplified two order linear timeinvariant transfer function model by analyzing the duty cycle of the air conditioning group, proposing aclosed-loop control strategy to provide a new way for flexible loads to participate in demand response,and putting forward two suggestions to solve the problem that parameters of the proposed transferfunction model vary with the ambient temperature in the case study. Based on the proposed model,accurately load control could be achieved without negatively affecting user experience.The rest of this paper is organized as follows: Section 2 presents an equivalent thermal parametersmodel of air conditioning. Section 3 analyzes the influence of AC parameters on its output characteristicand explores a simplified transfer function model for ACs by analyzing the duty cycle of the population.
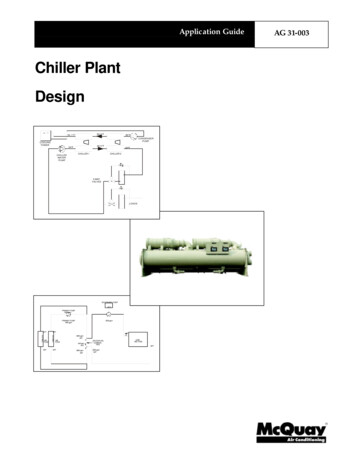
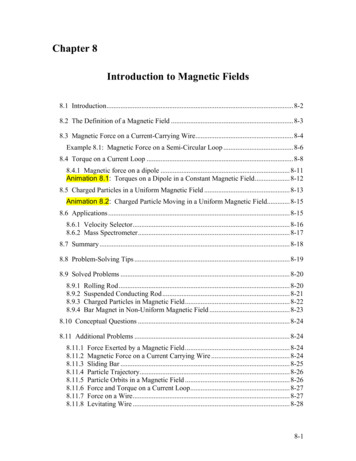
Energies 2015, 88653Section 4 presents a design of the model’s PID controller based on the PSO algorithm. Section 5demonstrates the simulation results of both scenarios of constant and changing ambient temperature toverify the proposed transfer function model and control strategy. Section 6 summarizes the discussionsand puts forth our conclusions.2. An Equivalent Thermal Parameters Model of Air ConditioningIn this section, the correlation between power, temperature and time is established, based on theequivalent thermal parameters (ETP) model. The study focuses on fixed-frequency air conditioning, anduses the Monte Carlo method to simulate the aggregated dynamic response of AC groups.Air conditioning has a periodic working pattern, as shown in Figure 1: When the air conditioning ison, the temperature inside the house keeps dropping until the temperature reaches the boundary .Then the air conditioner is off and the temperature inside the house keeps rising until the temperaturereaches the boundary , after which the air conditioning is switched on again. Figure 1. Periodical properties of the temperature inside the house and the power of airconditioners (ACs).The AC’s periodical properties can be described by the following equivalent thermal parametersmodel [19]:d i (t )1[ i (t ) a si (t ) Ri Pi ] , dtCi Rii 1,2, ,N(1)where i (t ) is the air temperature inside the i-th house at time t, a is the outdoor ambient temperature,Ci (kWh/ C) is the i-th AC’s equivalent thermal capacitance, Ri is the i-th AC’s equivalent thermalresistance ( C/Kw), Pi (kW) is the i-th AC’s thermal power, which divided by the coefficient ofperformance (COP) is the actual load of air conditionings, si (t ) is the switch state variable of the i-th ACat time t. si (t ) 1 means the i-th AC is on at time t, while si (t ) 0 means the i-th AC is off at time t. 0 si (t ) 1 s (t ) iif i (t ) if i (t ) otherwiseThe formula for calculating the aggregated demand of n ACs in the group is:(2)
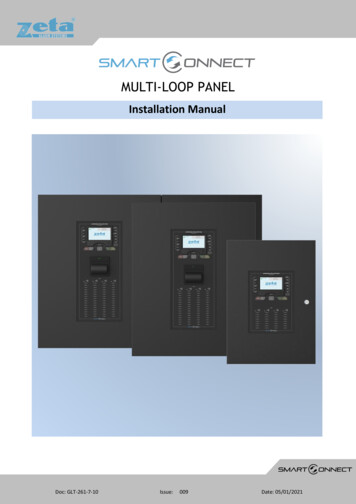
Energies 2015, 88654PinDtac (t ) s (t ) COPi 1iiPi i 1 COPin(3)Dtac (t ) is a per-unit value, taken as the baseline, whose numerator represents the sum of the runningAC loads in the group, and the denominator represents the total power of the group, assuming that allACs in the group are on.The traditional thermodynamic model of the air conditioning using Equations (1)–(3) has somelimitations. Each air conditioning room is a dynamic system with a nonlinear and independent iteration.When there is a large number of ACs, we have to face the problem of dimension disaster which triggersgreat difficulties. In addition, the model contains both continuous variable temperature θ, and discretevariable switching state s. In the following section, we present a simplified transfer function model,which can be used to easily solve the aggregated load of the population containing n ACs.3. Transfer Function Model for Aggregated Air Conditioning GroupIt is difficult to perform an accurate mathematical analysis of the traditional thermodynamic model,since each air conditioned room is a dynamic system with a nonlinear and independent iteration.This section explores a simplified transfer function model by analyzing the duty cycle of the airconditioning group. The excitation signal is step change of temperature set point.3.1. The Influence of Air Conditioning Parameters on the Output CharacteristicIn order to maintain the diversity of the air conditioning group, we assume that at the initial stage,all air-conditioned room temperatures uniformly distribute between the boundary temperature value[ , ], which determines whether the AC is on or off. In order to explore the equivalent heat capacity’srelationship with ambient temperature and duty cycle of air conditioning group, we assume that all ACshave the same thermal power P and the same equivalent thermal resistance R. This ensures that thedecline rate of the room temperature when the air conditioning is on is equal to the rate of thetemperature rise when the air conditioner is off. Therefore, the duty cycle is 0.5. We assume thatequivalent thermal capacitance C follows lognormal distribution. Then we have:Ri Pi 2( a ref )(4)As the control signal, the temperature set point of ACs is the same for all the members in the group: ref / 2 . The hysteresis width that consists of the boundary temperature values is the same for allair conditioners. In the simulation of this paper, the hysteresis width is: H 1 C.Then we analyze the air conditioning group based on the assumption of the above conditions. At t 0,a step change of 0.5 C of the temperature set point is occurred. Figure 2a,b indicates the temperaturedistribution before the step response. Figure 2c,d illustrates the temperature change after the stepresponse. Therefore, the temperature boundary , will move right into ( post , post ) , which is: post 0.5 , post 0.5(5)
Energies 2015, 88655 post post Figure 2. The temperature distribution of ACs before and after a step change of 0.5 C of thetemperature set point.Figure 2a,c shows that when the air conditioning is off, the room temperature rises, while Figure 2b,dshows that when the air conditioning is on, the room temperature drops. We define the change rate of thetemperature of the i-th air conditioning room as follows: a refd i (t ) vi dtCi R(6)xi (t ) x0i vi t(7) d i (0 )post1 (0) if 0, idtxi0 post (0) if d i (0 ) 0i dt(8)Besides, we define state variables:where:For an air conditioning group based on the thermodynamic model, at t 0, a step change of 0.5 C ofthe temperature set point is occurred. When xi (t ) [2k , 2k 1] , the air conditioning is on, and whenxi (t ) [2k 1, 2k 2] , the air conditioning is off. Each time when xi becomes an integer, a on-or-off statetransformation occurs. The relationship between xi and the state variable si (t ) of air conditioning inthe thermodynamic model (1)–(3) is: 0si (t ) 1if 2k -1 xi (t ) 2kif 2k xi (t ) 2k 1, k 1, 2, (9)When xi (t ) 1, at time 0 , temperature set point rises. From Figure 3, we can see that only 1/3 of theACs are on, and by Equation (8), the state of the air conditioning is distributed in the interval ofxi (t ) 0.5 . The probability that an air conditioning in the population switched on is:Pr[m(t ) 1 x(t ) 1] where Pr[·] is the probability operator.Pr[ x(t ) 1]3(10)
Energies 2015, 886560 Figure 3. The state distribution of ACs instantly after the temperature set point step change.For an air conditioning group based on the ETP model, at t 0, the temperature set point of all airconditioners rises by 0.5 C. Assuming that all ACs have the same power, if they are switched on at thesame time, we take their total power as the baseline. Therefore, the normalized power demand D(t) of the airconditioning group which consists of n ACs is equal to the probability of a random AC turning on [20]:D (t ) Pr [ x(t ) 1] Pr[ x(t ) 2k 1] Pr[ x(t ) 2k ]3k 1(11)D(t) also gives the proportion of the air conditioning that is on in the group at time t. The first term ofEquation (11) is the duty cycle of the air conditioning group at the moment 0 when the temperature setpoint rises, while the second term is the duty cycle of the air conditioning group after t 0. Assumingthat all ACs have the same R, P, and the parameter C obeys a lognormal distribution. Consequently,according to Equation (6), the temperature change rate v obeys the lognormal distribution, too. We uses.d . to represent the standard deviation, as well as E to the mean value: a ref s.d . s.d . 1 / C a refis.d . 1/ Ci s.d . Ci c v Ci R R v a ref cE 1 / Ci E Ci a ref E1/C i E RCRi (12) rel is defined by: rel v c v c(13)where c is the mean value of the equivalent heat capacity of n ACs, and c is the standard deviation.Based on Equation (11), whend i (t )obeys the lognormal distribution, it can be considered thatdtxi (t ) is also subject to the same distribution. According to the nature of the lognormal distribution we obtain:Pr x(t ) y log( y ) (t ) 1 1 erf 2 2 2 2 (t ) (14)where:12 t log( x (t )) log 1 2 (t ) log 1 x2 (t ) x2 (t ) x2 (t ) x2 (t ) (15)(16)
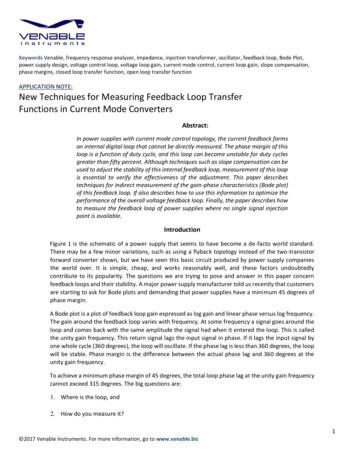
Energies 2015, 88657From Equation (11) we can also derive: x (t ) E[ x(t )] E[ x(0)] E[v]t x (0) v (t )(17)and: x2 (t ) ( s.d .[ x(t )])2 ( s.d .[ x(0)]) 2 ( s.d .[v])2 t 2 x2 (0) v2 t 2(18)The value of the first term of the above two formulas is very small and can be ignored. Therefore: x2 (t ) v22 rel x2 (t ) v2(19)By plugging Equations (17) and (19) into Equation (14), the following equation is obtained:1 2 log( y ) log( x (0) v t ) 2 log(1 rel ) 1 1Pr[ x(t ) y ] erf 22 22 log(1 rel) (20)where erf [·] is the Gauss error function.Let y 1 and for 2k and 2k 1, k 0, 1, ,. Then, by plugging Equation (19) into Equation (11),D(t) can be approximated as follows: D(t ) 1 1 erf 6 6 log(1) log( x (0) v (t )) 1 k 1 erf log(k ) log( x (0) v (t )) 2 ( 1) 2 rel2 relk2 (21)Figure 4 shows the average temperature and power for the population composed of 10,000 airconditioners according to different values of rel . At t 500 min, the temperature set point of all ACsrises 0.5 C. In Figure 4a–d, for rel 0.02, 0.05, 0.2 and 0.5 respectively, the top represents the averagetemperature inside the house before and after the step response, while the bottom represents the totalpower of all ACs before and after the step response. rel means the standard deviation of log-normaldistributions as a fraction of the mean value for R, C and P. According to Equation (3), the normalizedpower demand D(t) means the proportion of the air conditioning which is on in the group at time t.Assuming that all ACs have the same R, P, while C obeys lognormal distribution. This ensures that, therate of fall of the room temperature when the air conditioning is on, is equal to the rate of rising of theroom temperature when the air conditioner is off. The steady-state value of the duty cycle is 0.5.As shown in Figure 4, the average temperature of the air conditioning group is in the vicinity of theset point 20 C before a 0.5 C step. Then, the room temperature stabilizes at 20.5 C after a period ofoscillation. The temperature and power have the same settling time. More generally, the duty cycle maynot always remain at 0.5, as in the hotter days when there are more ACs turning on, the duty cycle islarger than 0.5, but in colder days, the situation is the opposite.When not all parameters such as R, P are the same, for example, as follows a lognormal distribution,variations of temperature and power of the ACs in the group will be more dramatic. Due to the diversity,the damping will be greater.The temperature and the power of ACs experienced an underdamped oscillation after the temperatureset point had risen 0.5 C at t 500 min. Figure 4 shows a decaying oscillation. For rel c / c ,the bigger rel is, the greater the system damping becomes. The average temperature and the powercurve have a shorter settling time and a smaller overshoot.
Energies 2015, ime (minutes)time (minutes)(a)(b)2121temp(C)temp(C)1000time (minutes)time time (minutes)500100015002000250020002500time 0time (minutes)200025000.1050010001500time (minutes)(c)(d)Figure 4. The average temperature and power for the population composed of 10,000 ACsbefore and after the step signal of temperature set point, respectively under conditions of rel 0.02, 0.05, 0.2 and 0.5. rel is the standard deviation of log-normal distributions as afraction of the mean value for R, C and P. (a) rel 0.02; (b) rel 0.05; (c) rel 0.2;(d) rel 0.5.By observing changes in the aggregated load before and after a step change of the temperature setpoint, we use a second-order dynamic model to approximate the air conditioning group. It will be easy tosolve the aggregated load of a population consisting of n ACs. Thus we can design a controller based onthe transfer function later. In the following simulation we can see that, when we release some restrictionson the assumptions in more general cases, the transfer function model and control strategy on the ACswill still be quite effective in real situations.3.2. A Transfer Function Model for the Second Order Linear Time Invariant SystemWhen the temperature set point rises by 0.5 C, the response of a population consisting of n ACs will be:D(t ) Dss ( ref ) L 1 G p ( s)0.5 / s (22)
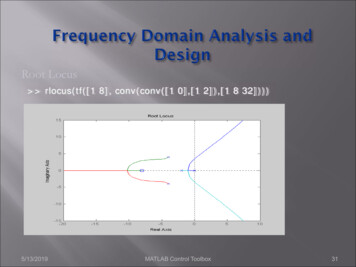
Energies 2015, 88659where Dss ( ref ) is the aggregated power demand of the AC group given a constant temperature setpoint. It is also the duty cycle of the steady state. The term including G p ( s) , which belongs to a transientprocess of change, indicates the aggregated demand response of a 0.5 C step in the form of asecond-order linear model: Hlog 1 a H / 2 Dss ( ) 1 H log 1 PR a H / 2 1(23)where the hysteresis width H is obtained by the upper and lower limit of temperature which determineswhether the AC is operating or switched off:H (24)The second order transfer function model of an AC group is:Gp (s) b2 s 2 b1 s b0s 2 2 n s n 2(25)Whose parameters are calculated from the equivalent thermal capacitance, thermal resistance,thermal power, hysteresis width and so on. The damping ratio and the undamped natural oscillation n of the characteristic polynomials in the denominator are: log(r ) log (r )22, n v1 2,(26)The coefficients in the numerator are:b0 n2 Dss ref 0.5 Dss ( ref ) 0.5b1 0.5 v 2b2 n , b2 Dss ( ref )(27)(28)where v represents the mean values of v defined in Equation (6): 1 0.5erf 0.9 2 2 rel r 1 erf 0.5 0.9 (29)where erf represents the Gaussian error function. The proof of the above equation is given in theAppendix A.3.3. Stability AnalysisThe aggregated demand response of a 0.5 C step based on a second-order linear time invariant (LTI)model is shown in Figure 5, which reveals the process of an underdamped oscillation when the systemcross the position of equilibrium.The simulated parameters are listed in Table 1, whose parameters are subsequently calculated byusing Equations (25)–(27), according to the air conditioning parameters given in Table 2.
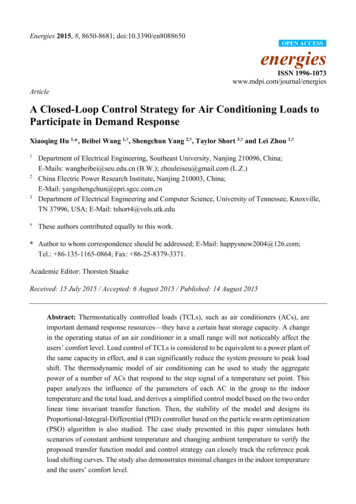
Energies 2015, 886600.30.20.1D0-0.1-0.2-0.3-0.4050010001500time (minutes)Figure 5. The aggregated demand response of a 0.5 C step based on the second-order lineartime invariant (LTI) model.Table 1. Parameters of two order linear time invariant transfer function.Parameters Dss(θ)rξωnb0 10 4b1b2Value0.429 0.431 0.259 0.0330.3780.012 0.429Table 2. Parameters of the air conditioners.ParametersValueR R 2 C/kWC C 3.6 kWh/ CP P 6 kW a 32 C20.5 C19.5 C20 C0.20.40.721.21 C2.5 rel C2 R2 P2HCOP (coefficient of performance)DescriptionEquivalent thermal resistance, log-normallydistributed with mean R and varianceEquivalent heat capacity log-normallydistributed with mean C and variance Equivalent thermal power, log-normallydistributed with mean P and variance Ambient temperatureHigher end of hysteresis bandLower end of hysteresis bandInitial temperature set point for n ACsdefined as rel2 C2 / C2Variance of n ACs’ heat capacityVariance of n ACs’ thermal resistanceVariance of n ACs’ thermal powerHysteresis width of indoor temperatureLoad efficiency2C2PWhen rel 0.2, we can calculate that 0.259 and n 0.033 . The decay time of the step responseof the control plant to 1% is: ts 4.6 / ( n ) 520 min. It can be seen that the settling time calculated fromthe second order LTI model in Figure 5 is consistent with the thermodynamic model in Figure 4.Figure 6 shows the dynamic performance of the open-loop transfer function of the air conditioning groupcomposed of n ACs. We can see from the graph that without the controller, the peak of the two ordersystem is 0.422, the overshoot is 1180%, the rise time is 47.1 s, the adjustment time is 235 s, the systemstability is 0.0329, and there exists a static error of 2% for the normalized power demand D(t). Therefore,it is sensible to design a corresponding controller, considering increasing the open loop amplification,and using a proportional control to reduce the static error.
Energies 2015, 88661Step Response0.4System: G0Peak amplitude: 0.422Overshoot (%): 1.18e 03At time (seconds): 23Amplitude0.30.2System: G0Rise time (seconds): 47.10.10System: G0Final value: 0.0329System: G0Settling time (seconds): 235-0.1-0.20100200300400500Time (seconds)Figure 6. The dynamic performance of the transfer function.By analyzing the stability of the transfer function G p , we get the Bode diagram. As shown in Figure 7,the system amplitude stability margin G p and phase angle crossover frequency Wcg are defaults,and the phase margin angle Pm 107.9061, gain crossover frequency cp 0.0227. Therefore,the closed-loop system with stability parameters marked in the figure is stable.Bode DiagramMagnitude (dB)100-10-20Phase (deg)-3090System: GpPhase Margin (deg): -108Delay Margin (sec): 194At frequency (rad/s): 0.0227Closed loop stable? Yes450-45-510-410-310-210System: GpPhase Margin (deg): 156Delay Margin (sec): 50.7At frequency (rad/s): 0.0536Closed loop stable? Yes-110010Frequency (rad/s)Figure 7. Bode diagram of the system transfer function G p .3.4. Simulation AnalysisThe initial temperature set point of the air conditioning group is assumed to be 20 C. At t 500 min,the temperature set point of all ACs is raised by 0.5 C. The upper and lower limit of the temperature,which determines the operating state of ACs, rises to 20.5 and 19.5 C. The temperature hysteresis widthis still 1 C. Figure 8 shows a comparison of the aggregated demand between the transfer function modeland the equivalent thermal parameters (ETP) model in response to a 0.5 C step rise. In the ETP model,the number of ACs in the population is 50, 1000 and 10,000 respectively. Figure 8a shows the variation
Energies 2015, 88662on the average temperature inside the room of the AC group, and Figure 8b shows the variation on theaggregated demand of the AC group. Parameters of the equivalent thermal parameters model can befound in Table 2.21.20.7Simulated 50ACSSimulated 1000ACSSimulated 10000ACS21Simulated 50ACSSimulated 1000ACSSimulated 10000ACSTF 19.60.119.405001000time (minutes)(a)15000050010001500time (minutes)(b)Figure 8. (a) The variation on the average temperature inside the room and (b) the variationon the aggregated demand of the AC group when the ACs’ temperature set point has a steprise of 0.5 C. The two order linear time invariant transfer function model is compared withthe ETP model which contains 50, 1000 and 10,000 ACs.When there are only 50 air-conditioning units, although the AC parameters C, R and P are stilllog-normally distributed in the simulation, the diversity of the population cannot be achieved because ofthe strong randomness. The simulation curve is very volatile and has many glitches. In contrast, whenthe number of aggregated ACs in the population is 1000 and 10,000, the population has a strongdiversity. The ACs are uniformly distributed in all running states, and the step response curve isvery smooth.We can see that with
of the air-conditioning loads reach 30% 40% of the total capacity—the demand peak rises with the number of air conditioners in use, while during off-peak hours, there is usually a power surplus. The types of the air conditioners include centralized and non-centralized [6,7]. A centralized air conditioner