Transcription
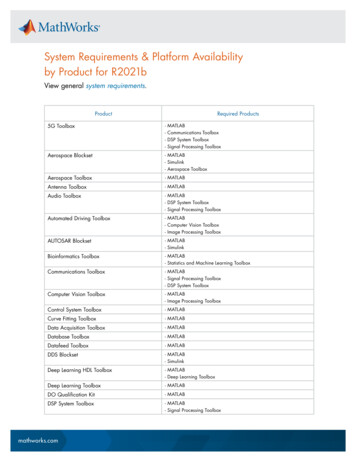
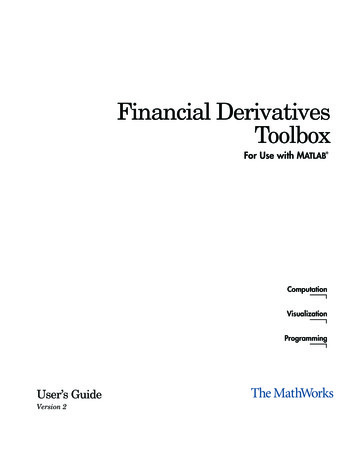
Root Locus rlocus(tf([1 8], conv(conv([1 0],[1 2]),[1 8 32])))5/13/2019MATLAB Control Toolbox31
Frequency Response: Bode and Nyquist Plots Typically, the analysis and design of a controlsystem requires an examination of its frequencyresponse over a range of frequencies of interest.The MATLAB Control System Toolbox providesfunctions to generate two of the most commonfrequency response plots: Bode Plot (bodecommand) and Nyquist Plot (nyquist command).5/13/2019MATLAB Control Toolbox32
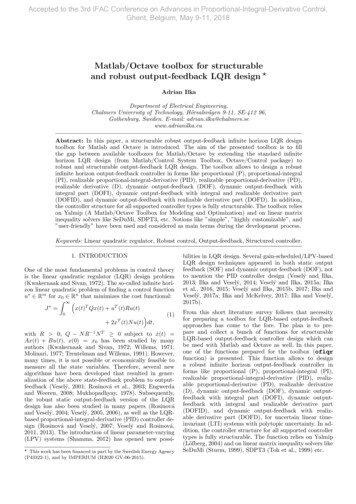
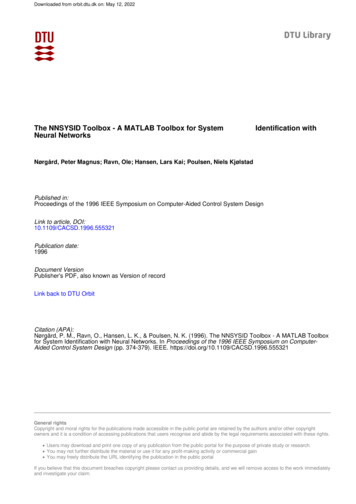
Control System ToolboxFrequency Response: Bode PlotProblem Given the LTI system1G( s ) s( s 1)Draw the Bode diagram for 100 values offrequency in the interval 10 1 10. 5/13/2019MATLAB Control Toolbox33
Frequency Response: Bode Plot bode(tf(1, [1 1 0]), TLAB Control Toolbox34
Frequency Response: Nyquist Plot The loopTheloop gaingain TransferTransfer functionfunction G(s)The gain margin isTheis defineddefined asas thethe multiplicativemultiplicativeamount thatamountthat thethe magnitudemagnitude ofof G(s) cancan bebe increasedincreasedbefore thebeforethe closedclosed looploop systemsystem goesgoes unstableunstablePhase margin isis defineddefined asas thethe amountamount ofof additionaladditionalphase lagphaselag thatthat cancan bebe associatedassociated withwith G(s) before theclosed-loop system goes unstableclosedclosed5/13/2019MATLAB Control Toolbox35
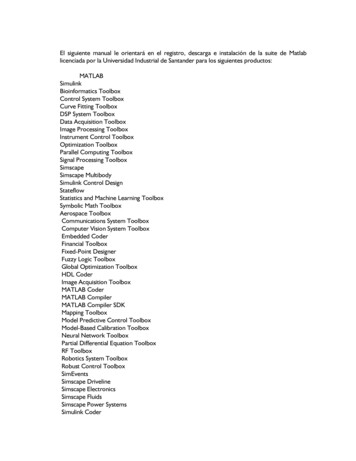
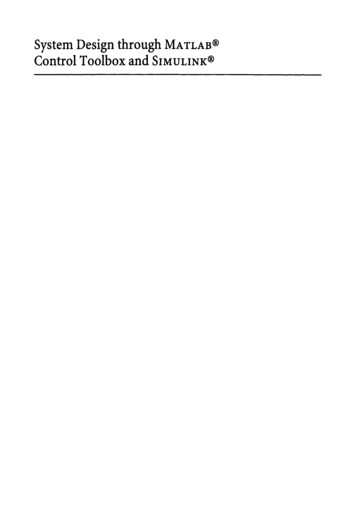
Control System ToolboxFrequency Response: Nyquist PlotProblemGiven the LTI systemDraw theDrawthe bodebode andand nyquistnyquist plotsplots forfor 100100 valuesvalues ofof frequenciesfrequenciesin theinthe intervalinterval 10In addition,addition, findfind thethe gaingain andand phasephase10 44 101033 . Inmargins.G( s ) 5/13/20191280s 640s 4 24.2 s 3 1604.81s 2 320.24s 16MATLAB Control Toolbox36
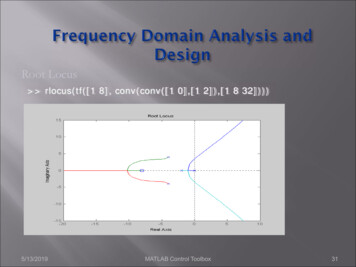
Frequency Response: Nyquist Plotw logspace( 4,3,100);w logspace(-4,3,100);w logspace(sys tf([1280 640], [1 24.2 1604.81 320.24 16]);bode(sys,w)[Gm,Pm,Wcg,Wcp] margin(sys)%Nyquist plotfigurenyquist(sys,w)5/13/2019MATLAB Control Toolbox37
Frequency Response: Nyquist PlotThe values of gain and phase margin and corresponding frequencies areGm 5/13/201929.8637 Pm 72.8960 Wcg 39.9099 Wcp 0.9036MATLAB Control Toolbox38
Frequency Response Plotsbode - Bode diagrams of the frequency response.bodemag - Bode magnitude diagram only.sigma - Singular value frequency plot.Nyquist - Nyquist plot.nichols - Nichols plot.margin - Gain and phase margins.allmargin - All crossover frequencies and related gain/phasemargins.freqresp - Frequency response over a frequency grid.evalfr - Evaluate frequency response at given frequency.interp - Interpolates frequency response data.5/13/2019MATLAB Control Toolbox39
Design: Pole Placement place - MIMO pole placement.acker - SISO pole placement.estim - Form estimator given estimator gain.reg - Form regulator given state-feedback andestimator gains.5/13/2019MATLAB Control Toolbox40
Design : LQR/LQG design lqr, dlqr - Linear-quadratic (LQ) state-feedbackregulator.lqry - LQ regulator with output weighting.lqrd - Discrete LQ regulator for continuous plant.kalman - Kalman estimator.kalmd - Discrete Kalman estimator for continuousplant.lqgreg - Form LQG regulator given LQ gain andKalman estimator.augstate - Augment output by appending states.5/13/2019MATLAB Control Toolbox41
Analysis Tool: ltiviewFile- Import to import system from Matlab workspace5/13/2019MATLAB Control Toolbox42
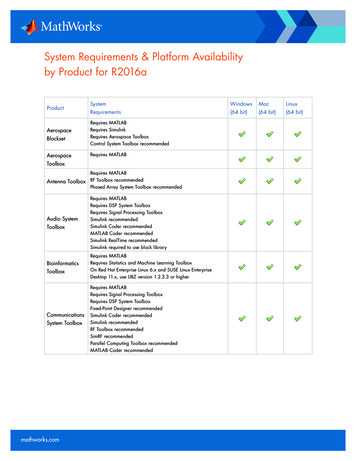
Control System ToolboxDesign Tool: sisotoolDesign with root locus, Bode, and Nichols plots ofthe open-loop system.Cannot handle continuous models with time delay.5/13/2019MATLAB Control Toolbox43
M-File Example%Define the transfer function of a plantG tf([4 3],[1 6 5])%find the bandwidth of the new systemwb bandwidth(T)%Get data from the transfer function[n,d] tfdata(G,'v')%plot the step responsestep(T)[p,z,k] zpkdata(G,'v')%plot the rootlocusrlocus(T)[a,b,c,d] ssdata(G)%Check the controllability and observability of the systemro rank(obsv(a,c))rc rank(ctrb(a,b))%obtain the bode plotsbode(T)margin(T)%find the eigenvalues of the systemdamp(a)%use the LTI y the transfer function with another transferfunctionT series(G,zpk([-1],[-10 -2j 2j],5))%start the SISO toolsisotool(T)%plot the poles and zeros of the new systemiopzmap(T)5/13/2019MATLAB Control Toolbox44
5/13/2019 MATLAB Control Toolbox 35 The loop gain Transfer function The loop gain Transfer function G(s) The The gain margin is defined as the multiplicative is defined as the multiplicative amount that the magnitude of G(s) can be increased can be increased before the closed loop system goes unstable Phase margin is defined as the amount of additional is defined as the amount of additional