Transcription
TheFifth DimensionA comprehensive analysis of the multifamily real estatemarket in Metropolitan VancouverThird Quarter - 2016November 2016DATA PROVIDED BY:COMPLIMENTS OF
WELCOME TO THE FIFTH DIMENSIONEach and every edition of the Fifth Dimension is brought to you compliments of Fifth Avenue Real Estate Marketing Limited, a full service,residential real estate sales and project marketing organization with over 36 years of experience.To ensure the supporting data is objectively collected and presented, we collaborate with highly regarded Urban Analytics (UA) a leadingprovider of advisory services on the new multifamily home market. UA has been tracking the new multifamily home market in MetropolitanVancouver since 1994 and has been a vital contributor to this report since its inception in the First Quarter of 2010.What do you think of the term “stress testing”? As a friend of mine who had an issue with his heart admitted to me, it isn’t a fun term. Atthe outset of this quarter we did not foresee the new mortgage qualification rules. While the changes may actually be for the greater goodthey have certainly added to the stress levels of first time buyers and developers. It seems odd to me that on the one hand thegovernment is working to curtail housing inflation to make homes more affordable while on the other hand making it even harder for firsttime buyers in the Metro area to own a home. It seems a tad like trying to suck and blow at the same time. This predicament reminds meof what one of my colleagues in Europe used to say to me when we worked together, “We burned our mouths on the soup and now weare blowing on the yogurt”.Since the October introduction of the new policy, a myriad of opinions on the probable impact have been voiced. For instance, CameronMuir, Chief Economist for the British Columbia Real Estate Association, had this to say, “The new rules will cause the sharpest drop in thepurchasing power of low equity home buyers in years. At a time when housing affordability is a critical issue, deliberately choppingmillennials’ purchasing power by as much as 20 percent will only exacerbate a well-known problem”. Rental anyone?Muir goes on to project that the policy will have the following impacts: a reduction in housing demand from first time buyers, a possiblereduction in prices, a potential lag in development with related negative effects on employment and economic growth and intensifyingdemand contributing to another cycle of rapidly increasing prices as financially retrenched millennials buy up an under supplied housingstock. Did you read the last part? Supply. Why is it so hard for many to believe that more supply and the required accelerated municipalapprovals is part of the affordability solution? I am also curious why the “affordability” conversation almost never deals with the incomeside of the equation. What are we doing to help millennials generate better paying employment? What are we doing to encourage wealthcreation period?Of course, not to be outdone, the foreign buyer tax remains a hot topic of conversation. As much as the government refers to the new taxas the “foreign buyer tax” I tend to side with industry experts such as Michael Ferreira, a Principal at a leading real estate research firm,Urban Analytics. At a recent Urban Development Institute presentation Michael commented, “Call it what it is. This is a Chinese buyer tax.Despite it, the Chinese are still buying”. It seems Dan Barnabic, author of “The Condo Bible for Canadians”, agrees. He states, “In thelong run, a 15 percent tax on foreigners will not serve as a deterrent”. He suggests a more radical idea. He suggests a 50 percent orgreater tax to “dampen demand and bring the housing prices down to levels Canadians can afford”. Again, I wonder why the focus is onwhat Canadians can afford vs. addressing what we can do to encourage the wealth generation that these foreigners have seemed toattain elsewhere. And by the way, how come there is so little attention paid to who is benefiting from the foreign buying? For the mostpart, as Chris Sorensen says in his October 17th Maclean’s Magazine article Hands off My Bubble, “ it’s easy to forget the biggestbeneficiaries of the largesse have been Canadians themselves”. In this piece, he speaks to the hot housing market and how it is both thebiggest risk to Canada’s economy and the biggest driver of growth. He reports that economists who lauded government efforts to coolhousing are now expressing reservations about taking further action. Empty home tax, anyone?Where does all this leave us? With over 3,000 quarterly sales generated in these uncertain times, demand for new homes remainsrelatively resilient. Yet, today’s consumers is experiencing uncertainty and this has and will continue to impact the urgency with whichconsumers act in the near term. Heading into year end and into early 2017, buyers will still be acting but they are expected to take moretime to make decisions.Feel free to share this report and your perspective on what is presented here as widely as you see fit. Our aim is to stimulate dialogue andpromote positive action in our industry.W. Scott BrownPRESIDENT & CEOFIFTH AVENUE REAL ESTATE MARKETING LTD.scott@fifthave.caThe Fifth Dimension Q3- 20162
INSIDE THE FIFTH DIMENSIONOverall Market Commentary 4Market SummariesVancouver Downtown 5Vancouver West 6Vancouver East 7Richmond/South Delta 8Burnaby/New Westminster 9North Shore: North & West Vancouver 10Tri-Cities: Coquitlam, Port Coquitlam, Port Moody 11Ridge Meadows: Maple Ridge & Pitt Meadows 12Surrey Central/North Delta 13South Surrey/White Rock 14Cloverdale/Langley 15Abbotsford 16Looking Back and Ahead 17Research Methodology 18The Fifth Dimension Q3- 20163
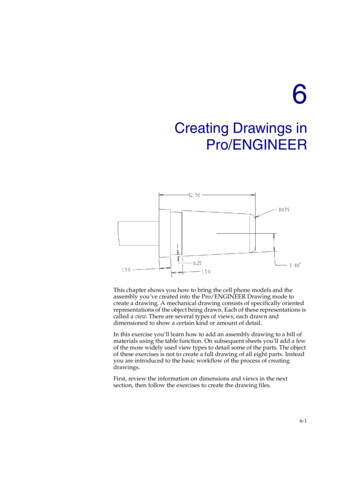
OVERALL MARKET COMMENTARYIn this third edition of the Fifth Dimension for 2016, our data collection and analysis partner Urban Analytics (UA) shares its commentary on thedynamic recent quarter, market performance year to date and what to expect in the Fourth Quarter with respect to Metro Vancouver’s multifamilyresidential real estate market.Q3 - New Home MarketMetro Vancouver’s new multifamily housing market finally showedsigns of fatigue following the purchasing frenzy that occurred fromlate 2015 through the first half of 2016. The total of 3,004 newmultifamily home sales reported in the Third Quarter were down 55percent from the last quarters record setting total and down 28percent from the same quarter last year. The sharp decline in salesactivity can be attributed to general market fatigue, lack ofaffordability and general concern in the marketplace that followedthe implementation of a foreign buyer tax. Slower sales resulted ina spike in overall released and unsold inventory levels. There were2,520 released and unsold new multifamily units in Metro Vancouverrecorded at the end of the Third Quarter, up 22 percent comparedto last quarter but still down 54 percent compared to the samequarter last year. On the supply side of things, there were only 62completed and unsold new multifamily homes available to purchaseat the end of the Third Quarter, which once again set a new six yearlow.There were 1,763 High Rise sales reported in the Third Quarter,which was significantly lower than the previous quarter. High Risecondominium sales were most prominent in Burnaby, Richmondand Vancouver West. Notable sales activity occurred at Burnabyprojects – Cressey’s Kings Crossing III (Edmonds), ConcordPacific’s Concord Brentwood (Brentwood) and Polygon’s FultonHouse (Brentwood). These projects collectively sold a reported800 units in the Third Quarter. In Richmond - Intracorp’s River ParkPlace II and Townline’s Calla at the Gardens projects sold acombined total of 182 units in the Third Quarter. The onlycondominium development launched in Vancouver Downtown inthe Third Quarter was Bosa Properties’ Cardero, which sold areported 111 of 119 units.The 654 Low Rise condominium sales recorded in the Third Quarterwere down 65 percent from last quarter’s record high of 1,894 salesand were also down 41 percent from the same quarter last year.There were 520 released and unsold Low Rise condominium unitsat the end of the Third Quarter, which is up slightly from last quarterbut is still down 69 percent compared to the same quarter last year.Low Rise projects with the most significant sales in the ThirdQuarter include: Amacon’s The Dawson (Brentwood), HJ Properties’Waterstone (Cloverdale), Mosaic’s Guildhouse (Guildford), andPolygon’s Parker House East (Coquitlam).The Townhome sector, much like condominiums, was negativelyimpacted by the recent implementation of the foreign buyer tax.The 587 new townhome sales recorded in the Third Quarter weredown 58 percent from last quarter and down 28 percent comparedto the same quarter last year. Also note that there were fewerprojects that registered a significant number of sales in the ThirdQuarter. Notable sales activity did however occur at Polygon’sFairwinds at Hampton’s Cove (Ladner) and Dawson Sawyer’s OldSchool (South Surrey).Q3 - Resale MarketThere were 2,702 newer multifamily homes resold in the ThirdQuarter of 2016, which is down 33 percent compared to lastquarter but only down six percent compared to the total numberThe Fifth Dimension Q3- 2016of resales recorded in the same quarter last year. Interestingly,Low Rise resales were up 48 percent but High Rise resales weredown 25 percent when compared to the same quarter last year.Active listings of relevant multifamily resale product are down 26percent compared to the same quarter last year.Q3 - Observations and OpinionsThe recent pull back in sales activity across Metro Vancouver inthe Third Quarter has resulted in the necessity of moreconservative pricing expectations for new project launches. Overthe past year, strong demand and extremely low supply levelsjustified rapid price increases for new homes across all productforms. Leading up to the Third Quarter, each new project launchwould be continually setting a new record price for its respectiveproduct type and location. Now that there is more caution in themarketplace and with the new mortgage stress testing, currentbuyers are taking a bit more time and are making more cautiouspurchasing decisions (i.e. purchasing the most reasonably pricedofferings in the marketplace and not over-stretching as much forhigher priced new home offerings).Notable Fourth Quarter project launches include: In VancouverDowntown – Onni’s 1335 Howe; in Vancouver West – Mosaic’sEdward, and Concord Pacific’s Avenue One; in Burnaby – Anthem/Beedie’s Station Square Towers 4 & 5, Millennium Development’sTriomphe, Amacon’s Imperial, Polygon’s Fulton House andLedingham McAllister’s Seasons; in Richmond – Intracorp’s RiverPark Place III; in New Westminster – Wesgroup’s The Columbia atBrewery District; in Coquitlam – BlueSky Properties’ Marquee atLougheed Heights and Modivo’s Simon; in North Vancouver –Polygon’s Juniper at Lynn Valley and Promenade at the Quay, andin Surrey/White Rock – Delsom Development’s Sunstone VillageResidences, Infinity Properties’ The Belmont at Heritage and RDGManagement’s The Wex.The following tables illustrate the year to year comparison by product type and SecondQuarter performance in the new home and resale markets.New Home Market YTD ComparisonYTD 2015 SalesYTD 2016 Sales% ChangeHigh Rise6,8888,74627%Low ,17528%Third Quarter Performance in the New Home MarketHigh RiseLow RiseTownhomeTotalsTotal Q3 2016 Sales1,7636545873,004Total Inventory1,3715206292,520Standing Inventory734065178Total # of Projects734065178High RiseLow ird Quarter Resale ActivityTotal SalesTotal Active Listings4
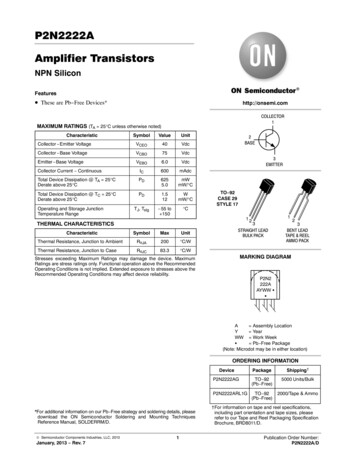
MARKET PROFILE: VANCOUVER DOWNTOWNLack of available inventory continues to afford Vancouver Downtown a ‘Green Light’ rating. 111 of the 112 units sold in the quarter occurred atBosa Properties’ newly launched Coal Harbour tower Cardero. Lower overall absorptions relative to the previous quarter continue to be attributedto the lack of new product being brought to market. 40 of the 60 remaining unsold units are located at Brenhill’s 8X on the Park. The majority ofthese remaining units are larger than 1,000 square foot plans located on the top half of the building.New Development Highlights (Q3) The launch of Bosa Properties’ Carderocontributed to the increase in the average persquare foot values of actively selling projects.DenmanStCOAL HARBOUR This project is estimated to average 1,760 persquare foot and sold a reported 111 of 119 unitsin the Third Quarter. The higher average persquare foot value can be attributed to the projectsCoal Harbour location which typically commandsa higher price point than other downtownneighbourhoods.WestGeorgiaStHastinWEST ENDgsStGASTOWN/CROSSTOWNHoweStBurrardDOWNTOWN CENTRALHigh RiseSeymourSt This project launched subsequent to theannouncement of the new 15 percent foreignbuyer tax, but sales were seemingly unaffected.Main StStCHINATOWNLow RiseFALSE CREEK NORTHTownhomeYALETOWN/DOWNTOWN SOUTHses ctedeleaRe Projc BvldPacifi Boffo Developments’ The Smithe and Onni’s 1335Howe are anticipated to come to market in thefinal quarter of 2016.*Locations are approximate.New Development Sales StatisticsProductActive ProjectsHigh Rise5112Low Rise----Townhome----Change over the last quarter: Increase,MLS Resale Highlights (Q3) The number of resales in the Third Quarter of 2016decreased by 58 percent relative to the samequarter in 2016. The decrease in sales can be attributed to the lackof available inventory. Listings were also down 38percent. Average per square foot values for one bedroomunits have increased by 192, while two bedroomshave increased marginally by 27.Active Sales Range (PSF)60 1,100 - 1,600No ChangeACTIVE LISTINGSSOLD LISTINGSProductListingsMo.Supply#%PSFDOMActive Sales Range(75% of sales)High Rise971.3144100% 94918 455,000 - 650,000Low Rise-------Townhome-------MLS Resale by Unit TypeAVG. PRICEProductPSFAVG. PRICE1 BedroomPSF2 BedroomHigh Rise 562,159 958 842,962 825Low Rise----ProductTownhomeThe Fifth Dimension Q3- 2016Decrease,Unsold InventoryMLS Resale Statistics (product 10 years of age or less) Months of supply this quarter were equal to that ofthe same period last year. Average price per square foot values increasedsubstantially by 170 in comparison to the ThirdQuarter of 2015.Sales2 Bedroom-3 Bedroom---5
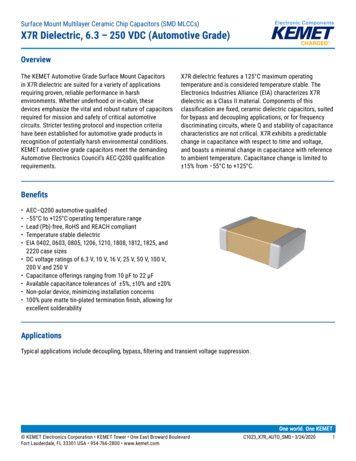
MARKET PROFILE: VANCOUVER WESTThe Vancouver West market maintains its ‘Green Light’ rating due to sustained high levels of sales activity in the High Rise sector. Inventory forTownhome product in the market increased by 69 units; 34 sales were achieved during the same period for this product type. Overall absorptionsdecreased by 40 percent compared to the previous quarter. This decrease in sales can be attributed to the 15 percent decline in releasedinventory. There continues to be an extreme lack of Low Rise inventory in this market; only 26 new units remain available to purchase at the endof the Third Quarter. Strong demand, lack of inventory and higher single family prices have continued to result in significant increases in pricesfor all product types.New Development Highlights (Q3) High Rise projects that launched in the ThirdQuarter of 2016 included MingLian Holdings’Camellia and Cressey’s McKinnon; the two projectscollectively sold 74 of 96 released units.Cornwall Ave4th AvestWebro10th AvellMa16th Ave16th AveKing Edward AveMarinKing Edward AveeDKERRISDALEGranville StMackenzie StArbustus StrDUNBARMain StCambie StSWCAMBIE CORRIDORGRANVILLE CORRIDOR41st Ave41st AveHigh Rise49th AveLow RiseMARPOLESEFCCambie StTownhome57th AveSWsestedleajecReProMareDrinMain St2nd AveSOUTH CAMBIECambie St Sales are expected to commence early nextquarter at Mosaic Homes next Cambie Corridorproject Edward.FAIRVIEWUBC*Locations are approximate. Bogner’s Kerrisdale development Kirkland andWestland’s Dunbar project The Grey will be broughtto market in the Fourth Quarter of 2016.12th AveKITSILANODunbar St Pinnacle International is anticipated to launch its’next South East False Creek project Pinnacle onthe Park in the Fourth Quarter of 2016.SEFCBroadwayokPOINT GREY Listraor’s Aston, Intracorp’s Granville and 57th andAlabaster’s Oak Park all launched in the ThirdQuarter of 2016 increasing the Townhome supplyby 69 units; a combined 28 sales have beenachieved since launch. Concord Pacific sold the remaining 11 units at itsW1 project.2nd Ave4th AveNew Development Sales StatisticsProductActive ProjectsSalesUnsold InventoryActive Sales Range (PSF)High Rise18258244 900 - 1,200Low Rise21226 775 - 875Townhome63450 900 - 1,100Change over the last quarter: Increase,Decrease,No ChangeMLS Resale Highlights (Q3) Average values for High Rise product were 192per square foot higher in the Third Quarter of 2016than in the same quarter of 2015. Low Rise per square foot values increased by 99,while the Townhome sector increased substantiallyby 192. Total listings at the end of Third Quarter of 2016were 44 percent lower relative to end of the ThirdQuarter of 2015. Average days on market for Low Rise homesdecreased from 122 in the Third Quarter of 2015compared to 40 in the Third Quarter of 2016, adecrease of 82 days. Average per square foot values for one bedroomhomes have increased by 221 and 153respectively for High Rise and Low Rise productyear-over-year.The Fifth Dimension Q3- 2016MLS Resale Statistics (product 10 years of age or less)ACTIVE LISTINGSProductListingsSOLD LISTINGSMo.Supply#%PSFDOMActive Sales Range(75% of sales) 497,200 - 938,000High Rise901.812870% 95631Low Rise211.14625% 82140 515,000 - 890,000Townhome102.6105% 91450 746,000 - 1,185,000MLS Resale by Unit TypeAVG. PRICEProductPSFAVG. PRICE1 BedroomPSF2 BedroomHigh Rise 565,891 955 862,576 956Low Rise 530,615 844 750,744 805ProductTownhome2 Bedroom 1,009,1673 Bedroom 847 1,009,000 8756
MARKET PROFILE: VANCOUVER EASTThe Vancouver East market retains its ‘Green Light’ rating as inventory levels of all product types continued to decrease throughout the quarter.Only one new project was brought to market in the Third Quarter of 2016: Mondevo’s 20-unit Arne Townhome project in Mount Pleasant sold 17of its 20 units within the first few weeks of beginning its sales campaign. 68 percent of the 25 units sold in the Third Quarter were comprised ofTownhomes from this project. Compared to the 579 sales recorded in the previous quarter, overall sales decreased by 99 percent.Boundary StMcGill StNew Development Highlights (Q3) Mondevo launched its Arne Townhome project atan average per square foot value of 1,002.Hastings StHastings StHASTINGS CORRIDORPrior StVenables StRENFREW 8 of the 13 remaining wood frame homescomprise of units located at JRXL Development’sVIC49 project and are homes that are not affordedany parking stalls.1st Ave1st AveRupert StRenfrew StNanaimo StVictoria DrCommercial DrClark DrMain StMOUNT PLEASANTBroadwayBroadway12th AveVICTORIA CORRIDORGrandview HwyKings Projects anticipated to launch in the FourthQuarter include Wesgroup’s Avalon Park at theRiver District and Epix’ 16 BrownstonesTownhome project.wayKing Edward AveFRASER CORRIDORVictoria DrKnight StFraser St33rd AveHigh RiseKingswayLow RiseCOLLINGWOODTownhome41st AveBoundary St49th Aveses ctedeleaRe Proj*Locations are approximate.Kerr StElliot StMain StSOUTH VANCOUVERFRASERVIEWVictoria DrKnight StFraser StSW Marine DrNew Development Sales StatisticsProductActive ProjectsUnsold InventoryActive Sales Range (PSF)High Rise5Sales08 650 - 900*Low Rise2813 550 - 750*Townhome2173 750 - 950*Change over the last quarter: Increase,Decrease,No Change*Note: The greater variation in active Sales Price Range is the result of the achievable sale value differential betweencomparable product in the different East Vancouver neighbourhoods.MLS Resale Highlights (Q3) The number of resales were lower in all producttypes when compared to the same quarter in2015. Total listings, were up by 75 percent relative tothe Third Quarter of 2016. Average per square foot values increasedsubstantially across all product types: HighRise increased by 160, while Low Rise andTownhome increased by 151 and 216respectively. Average days on market essentially decreasedby half across all product types relative to thesame period last year.MLS Resale Statistics (product 10 years of age or less)ACTIVE LISTINGSProductListingsMo.Supply#%PSFDOMActive Sales Range(75% of sales)High Rise842.67354% 80020 371,000 - 728,000Low Rise272.14432% 70121 360,000 - 709,000Townhome131.91914% 80918 650,000 - 1,060,000MLS Resale by Unit TypeAVG. PRICEProductPSF1 BedroomAVG. PRICEPSF2 BedroomHigh Rise 487,870 800 673,213 794Low Rise 428,589 675 626,795 728ProductTownhomeThe Fifth Dimension Q3- 2016SOLD LISTINGS2 Bedroom 822,1503 Bedroom 760 1,006,750 8007
MARKET PROFILE: RICHMOND/SOUTH DELTAThe Richmond market retains its ‘Green Light’ despite a decrease in sales across all product types. Decreasing inventory of High Rise and LowRise condos contributed to decreased absorption. Furthermore, Townhome inventory increased due to the release of three new developments.Overall, five projects were launched: three Townhome and two High Rise condominiums. Townhomes included Fairwinds at Hampton Cove byPolygon, MapleVille by Benest Development, and Stone Ridge by Sian Development, adding a total of 97 units for sale. High Rise launchescomprised of Intracorp’s River Park Place II and Townline’s Calla at the Gardens, adding an additional 182 units to inventory. Of those, River ParkPlace II sold 103 of 129 released units within the quarter. Relative to the previous quarter, overall sales declined by 72 percent in this market.New Development Highlights (Q3)BRIDGEPORTBridgeport Rd Intracorp launched its second phase, River ParkPlace II, at an average per square foot value of 675 which reported to be 80 percent sold by theend of the quarter.Westminster HwyQUILCHENAGranville AveNO.3 RDGARDEN CITYBlundell RdLADNER & TSAWWASSENFrancis RdNo. 5 RdNo. 4 RdNo. 3 RdGilbert RdNo. 2 RdNo. 1 Rd Polygon’s Fairwinds at Hampton Cove achievedthe highest absorption of Townhomes in the ThirdQuarter of 201Alderbridge WayOLYMPIC OVALGarden City Rd Projects anticipated to launch in the Fourth Quarterinclude Intracorps’ final phase, River Park Place IIIand Aquilini’s Pelican Cove Townhomes atTsawassen Shores.EAST CAMBIEWEST CAMBIEHigh RiseSTEVESTONLow RiseSteveston HwyTownhomeses ctedeleaRe ProjSOUTH RICHMOND*Locations are approximate.New Development Sales StatisticsProductActive ProjectsSalesUnsold InventoryActive Sales Range (PSF)High Rise10221201 600 - 930*Low Rise7116110 497 - 610Townhome912375 569 - 715Change over the last quarter: Increase,Decrease,No Change*Note: The greater variation in active Sales Price Range is the result of the achievable sale value differential created as aresult of Aspac’s River Green Phase II, priced 250 per square foot higher than the second highest priced comparable.MLS Resale Highlights (Q3) Total overall resales decreased 35 percent from thesame quarter in 2015, while active listingsdecreased by 51 percent. The Townhome sector decreased drastically with63 percent less homes being sold in the ThirdQuarter of 2016 relative to the Third Quarter of2015. Months of supply across all product typesexperienced substantial drops when compared tothe same period in 2015. High Rise supply levels decreased from 10.1months in the Third Quarter of 2015 to 1.8 monthsin the Third Quarter of 2016. Average values for Townhome product were 108higher than the Third Quarter of 2015.The Fifth Dimension Q3- 2016MLS Resale Statistics (product 10 years of age or less)ACTIVE LISTINGSSOLD LISTINGSProductListingsMo.Supply#%PSFDOMActive Sales Range(75% of sales)High Rise1451.917258% 63452 365,000 - 720,000Low Rise451.37124% 55525 348,000 - 580,000Townhome773.15418% 56530 660,000 - 930,000MLS Resale by Unit TypeAVG. PRICEProductPSF1 BedroomAVG. PRICEPSF2 BedroomHigh Rise 413,038 638 601,745 631Low Rise 344,837 566 500,828 552ProductTownhome2 Bedroom 638,8333 Bedroom 574 784,768 5728
MARKET PROFILE: BURNABY/NEW WESTMINSTERThe Burnaby/New Westminster Market maintains its “Green Light” rating as all product types continued to achieve strong absorptions in the ThirdQuarter. The High Rise Condominium sector was most impressive with 888 sales being reported, and three towers being reported sold out.Although overall sales in the Third Quarter were down 63 percent relative to the Second Quarter, demand remains strong for all product types.The decrease in sales can be attributed to the fact that the past three quarters have been historically high, with the launch of several significantHigh Rise projects in the Brentwood neighbourhood. Overall released inventory at the end of the Third Quarter was up 38 percent compared tothe Second Quarter of 2016. The increase in available inventory is attributed to the release of the remaining units at Concord Brentwood and thelate quarter launch of Fulton House.New Development Highlights (Q3)NORTH BURNABYHastings StSFUBoundary Rd Cressey sold its remaining units at Kings CrossingTower 1 and 2 during the quarter. The third andfinal tower was launched in the quarter and 206 of234 units were reported sold.BRENTWOODLougheed HwyQUEENSBOROUGHLOUGHEED The third tower set a new benchmark in theEdmonds area at 698 per square foot.StydBoeAvDeer Lake PkwyBURNABY EASTth16SAPPERTONneBruadgswayHigh RiseayaWMETROTOWNQUEENS PARKnCaKintteAveEDMONDSeAvImperial Sth8teAvLow RisedeBriMcUPTOWNStdBlv8thTownhometh12Royal Oak AveStMarine DrsestedleajecReProDOWNTOWN QUAYTHE HEIGHTSlyaRoeAvStntFro*Locations are approximate.SOUTH SLOPE New Metro Holdings began selling The River inQueensborough.enEwwyRoyal Oak Ave Intergulf sold the remaining 18 units at its SFUconcrete project The Peak.dHCENTRAL BURNABYBoundary Rd Amacon brought The Dawson to market and hassold a reported 56 units at an average of 635 persquare foot.gheeWillingdon Ave Polygon launched its Fulton House High Rise andsold 175 units at an estimated average of 749 persquare foot.LouCanada WayMarine WayNew Development Sales StatisticsProductActive ProjectsSalesUnsold InventoryActive Sales Range (PSF)High Rise15888405 600 - 750Low Rise714073 500 - 630Townhome64467 515 - 610Change over the last quarter: Increase,Decrease,No Change*Total Sold is the percentage of product sold under ten years of age relative to the total sold for each product category.MLS Resale Highlights (Q3) Total overall resales in the Third Quarter of 2016were 26 percent lower relative to the same periodin 2015 The Low Rise sector achieved the only increase insales over year with 23 more sales being reportedrelative to the Third Quarter of 2015. All average product values increased over the yearas follows: High Rise increased by 96, while LowRise increased by 100 and Townhomes by 226. The two bedroom Townhome product experienceda substantial increase in average per squarevalues, increasing 298 over the year.MLS Resale Statistics (product 10 years of age or less)ACTIVE LISTINGSProductListingsHigh Rise1831.823357% 64122 360,000 - 725,000Low Rise430.913433% 54822 320,000 - 560,000Townhome421.94110% 64226 496,000 - 903,000#%PSFDOMActive Sales Range(75% of sales)MLS Resale by Unit TypeAVG. PRICEProductPSF1 BedroomAVG. PRICEPSF2 BedroomHigh Rise 401,008 664 570,980 625Low Rise 354,143 541 484,112 547ProductTownhomeThe Fifth Dimension Q3- 2016SOLD LISTINGSMo.Supply2 Bedroom 611,6893 Bedroom 720 794,774 5879
MARKET PROFILE: NORTH SHOREThe North Shore market retains its ‘Green Light’ rating in spite of lower sales reported across all product types. Decreasing inventory and thenumber of actively selling projects contributed to the decline in absorptions. 120 of the 177 sales reported in the quarter occurred at Pinnacle’snewest Lonsdale project Cascade at the Pier. Anecdotally it is worth noting that several concrete High Rise condominium projects increasedprices in the quarter as low inventory continues to warrant a seller’s market. There are only three wood frame Low Rise condominium unitsavailable to purchase in the entire North Shore at the end of the Third Quarter; all homes are located in Vivagrand’s X61 project.LOWER LONSDALE13th StLonsdaleAveNew Development Highlights (Q3)3rd St Pinnacle launched Cascade at the Pier in theThird Quarter of 2016 at an estimated average persquare foot value of 1,215.Mountroyal BvldWEST VANCOUVERCapilanoRdLYNN VALLEYUPPER LONSDALETaylor Way15th St21st St The majority of purchasers were North Shoredownsizers attracted to the location and largeunits.Keith RdeynLyDrCENTRAL LONSDALELonsdale AveMarine DrMARINE DRGrand Bvld Decato by HRA Developments was introduced tothe market in the Third Quarter of 2016, adding anadditional 18 units of much needed Townhomeinventory to the market.RdMountain HwyallnV23rd StMarinekwrPLYNNMOREKeith RdSntLOWER LONSDALEMouyoumeyMAPLEWOOD3rd St Polygon is anticipated to launch its Juniper LowRise development in Lynn Valley and itsPromenade at The Quay High Rise developmentin Lower Lonsdale next quarter. Fairborne will launch its next Lonsdale woodframe project Kindred in the Fourth Quarter of2016. Cressey’s Bellevue and Grosvenor’s secondphase of Ambleside are also slated to commencesales before the end of the year.DEEP COVEHigh RiseLow RiseTownhomeses ctedeleaRe Proj*Locations are approximate.New Development Sales StatisticsProductActive ProjectsSalesUnsold InventoryActive Sales Range (PSF)High Rise11177255 630 - 1,500*Low Rise243 550 - 700Townhome3228 280 - 360Change over the last quarter: Increase,Decrease,No Change*Note: The greater variation in active Sales Price Range for High Rise is the result of the achievable sale value differentialbetween product in North Vancouver vs. West Vancouver.MLS Resale Highlights
Residences, Infinity Properties' The Belmont at Heritage and RDG Management's The Wex. OVERALL MARKET COMMENTARY New Home Market YTD Comparison YTD 2015 Sales YTD 2016 Sales % Change High Rise 6,888 8,746 27% Low Rise 3,143 4,684 49% Townhome 2,562 2,745 7% Total 12,593 16,175 28% Third Quarter Resale Activity High Rise Low Rise Townhome Totals