Transcription
View metadata, citation and similar papers at core.ac.ukbrought to you byCOREprovided by Digital Repository @ Iowa State UniversityCreative ComponentsIowa State University Capstones, Theses andDissertationsSummer 2019Customizing Salesforce services at Renewable Energy GroupMina Taheriminat@iastate.eduFollow this and additional works at: https://lib.dr.iastate.edu/creativecomponentsPart of the Management Information Systems CommonsRecommended CitationTaheri, Mina, "Customizing Salesforce services at Renewable Energy Group" (2019). CreativeComponents. 350This Creative Component is brought to you for free and open access by the Iowa State University Capstones,Theses and Dissertations at Iowa State University Digital Repository. It has been accepted for inclusion in CreativeComponents by an authorized administrator of Iowa State University Digital Repository. For more information,please contact digirep@iastate.edu.
Creative ComponentCustomizing Salesforce Services at Renewable EnergyGroupAdvisors: Dr. Townsend and Dr. LaczniakMina TaheriSpring 20191
ContentsIntroduction of Renewable Energy Group. 4The line of Products. 6REG-900 Biodiesel. 6REG-9000 Distilled Biodiesel . 6REG Renewable Hydrocarbon Diesel (RHD) . 6Biodiesel Blended Fuel: . 6Bioheat Blended Fuel . 7REG Glycerin . 7Salesforce. 8Salesforce Strengths . 8The project at REG: . 10Preparation:. 12Chemicals Implementation . 13Analyzing Data . 19Summary. 30References . 312
Table of FiguresFigure 1 Biofuel . 4Figure 2 REG History . 5Figure 3Salesforce . 9Figure 4 Timeline. 10Figure 5Trailhead Courses. 12Figure 6Trailhead . 12Figure 7Added Chemicals Record Type. 13Figure 8 Chemicals Record Type-Setup. 14Figure 9 New Purchase Form . 14Figure 10 Chemicals layout . 15Figure 11 Total Delivered Price- A Field Example . 16Figure 12 Validation Rule . 17Figure 13 Email Alert . 17Figure 14 Workflow Rule. 18Figure 15 A Snapshot of My Reports on Salesforce . 20Figure 16 Chart-Average by Products . 21Figure 17vChart-Average by Products2 . 21Figure 18 Filter Option on Reports . 22Figure 19 Chart- Total Number of Contracts with Each Customer . 23Figure 20 Matrix Report . 24Figure 21 Sum and Average in One Chart . 24Figure 22 Chart Setting on Reports . 25Figure 23 Chart- Line and Bar Charts Together. 25Figure 24 Chart- Average by Products-30 Last Days Filter . 26Figure 25 Chart- Bar Type . 26Figure 26Chart- Bucketing Example . 27Figure 27Bucketing Option . 28Figure 28 Summary Formula Feature . 29Figure 29 Example of Added Column by Summary Formula . 293
Introduction of Renewable Energy GroupFollowing is how Renewable Energy Group introduces itself on its website: “RenewableEnergy Group, Inc. (Nasdaq: REGI) is a leading provider of cleaner, lower carbonintensity products and services. We are an international producer of biomass-baseddiesel, a developer of renewable chemicals and North America’s largest producer ofadvanced biofuel. REG utilizes an integrated procurement, distribution, and logisticsnetwork to convert natural fats, oils, greases, and sugars into lower carbon intensityproducts. With 14 active biorefineries, a feedstock processing facility, research anddevelopment capabilities and a diverse and growing intellectual property portfolio, REGis committed to being a long-term leader in bio-based fuel and chemicals.”*Figure 1 Biofuel* https://regi.com/4
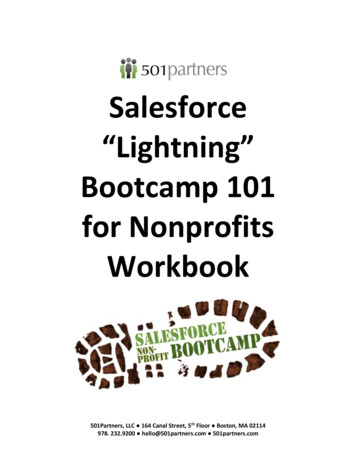
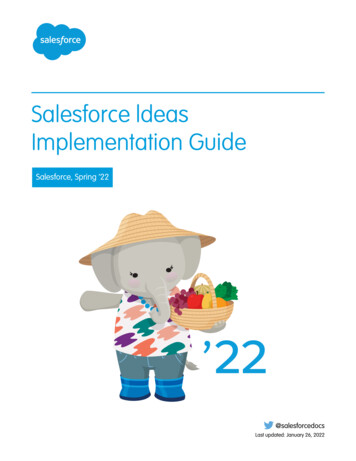
REG started its business around two decades ago under the umbrella of West CentralCooperative in Ralston. REG sells the products through an international distribution andlogistics system. REG is active in the biodiesel, energy, and agriculture sectors. REGstarted from a single biodiesel production facility in 1996 into a biomass-based andrenewable chemicals company.Figure 2 REG HistoryREG articulates its mission on its website as: “Worldwide energy consumptioncontinues to increase rapidly. At the same time, efforts to decarbonize our environmentare growing and sustainability is now a priority for many corporations, governmentagencies, and consumers around the globe.”5
The line of ProductsREG-900 BiodieselThere is a wide range of benefits that come with REG-900 Biodiesel including economicadvantages, energy security and diversity, cooler and quieter engines, and reduced lifecycle greenhouse gas emission.REG-9000 Distilled BiodieselDistilled Biodiesel is the purest type of biodiesel with advanced cold-flow propertieswhich makes it a superior choice for reliable performance even in cooler temperatures.Therefore, Distilled Biodiesel eliminates the need to switch to lower cloud point biodieseleven in cold weather, could be easily blended with petroleum, and reduce the potentialfor filter plugging.REG Renewable Hydrocarbon Diesel (RHD)Hydrocarbon Diesel is an advanced biofuel that reduces greenhouse gas emissions andcan be added to the existing pipeline system. This is a 100 percent hydrocarbon andlike petroleum diesel is compatible with any diesel engine without modifications. Thisproduct allows for easier starting and smoother engines so that operation will be morereliable. Also, this fuel is qualified for several states and federal biofuel tax incentives.Biodiesel Blended Fuel:REG blends fuels from B2 to B20 and offers it from terminals around the country.6
Bioheat Blended FuelBioheat is a reliable, superior-quality fuel that offers a clean, efficient alternative totraditional heating oil. It burns more completely and efficiently, enhances and extendsheating equipment life so that reduces maintenance requirements.REG GlycerinREG produces an advanced purification process to ensure impurities removal andcareful product testing. Automated process controls glycerin quality and several salesoptions are available for customers.Additional REG products are Bimesters, Renewable naphtha, Renewable LPG, MethylEsters, and Oleo lipids.7
SalesforceSalesforce is the number one customer relationship management platform. Salesforcehelps companies to manage the information better and also interact with customersmore effectively. Salesforce makes the data available from a desktop or other devices.Therefore, Salesforce is an industry standard for CRM solutions while many believe it’sthe best CRM software overall. Salesforce has nearly 20 percent of market share inindustry and in general is speedy, powerful, and highly customizable.Salesforce was built to meet the needs of enterprises and large businesses at first butthen expanded its scope with streamlined options that were easier and more affordableto run. Scalability of Salesforce makes it an excellent choice for companies that quicklyare expanding. Salesforce offers industry-specific add-ons with a separate section forsmall business specific add-ons. These small business add-ons are free in most cases.Salesforce offers excellent admin controls, various permission setup, and differentdisplays and workflows.Salesforce StrengthsSalesforce offers many optional features like a comprehensive business ecosystem,easy impact process, popular integrations, and trailblazer community. Businesses cangrow along with Salesforce and adopt new features when it is needed. Importing data isone of the other things that is very easy in salesforce. Popular integration of salesforcecomes from its widespread use which translates to lots of easy integration.8
In addition to above advantages, Salesforce trailblazer community is a valuable assetincluding step by step guideline on almost everything. Finally, one of the greateststrengths of salesforce is its user-friendly features. Salesforce provides managementfeatures in an easy way to everyone so that any user without programming backgroundcould manage the system and prepare analytical reports and charts. This user-friendlycapability alongside with trailblazer community makes it possible for everyone to useSalesforce. Number of experts who are using Salesforce makes a massive communityof experts and evangelists available to help customer organizations.Figure 3Salesforce9
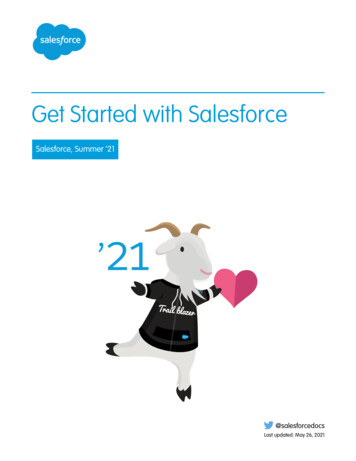
The project at REG:The project had different phases including:1) importing the chemicals data into the salesforce,2) implementing the chemicals process into the salesforce,3) analyzing data and making dashboards/reports/charts for managers and tradersI was not familiar with salesforce beforehand, so the preparation phase was self-trainingon the salesforce and participating in some courses on Trailhead. These courses gaveme a general understanding of Salesforce capabilities.Figure 4 Timeline10
Self-training Understanding the Chemicals' processPreparation Importing data to salesforce Creating a new record type for Chemicals Adjusting the page layout and fields Revising Price Formula to include Chemicals' productus Setting new workflow for sending email alertsImplemetationData Analysis Playing with reports and dashboard to learn about theircapabilities Playing with REG data on salesforce to learn about REGspecific fields Data analysis and pulling out related reports for managers Making dashboards for managers11
Preparation:I started self-training with sign up on the Trailhead. As I mentioned before in introductionto Salesforce, Trailhead is a platform for Salesforce customers to learn about softwareand ask their questions. Numbers of experts around the world share their experiencesthere or take online courses. The following table shows the online courses I took onTrailhead.1Learn CRM Fundamentals for Lightning Experience2Learn Admin Essentials in Lightning Experience3Get Started with Lightning Experience4Admin Beginner5Build Platform Apps in Lightning Experience6Automate Your Business Processes With Lightning Flow7Admin Advanced8Manage your Salesforce Data and External Data9Admin IntermediateFigure 5Trailhead CoursesFigure 6Trailhead12
Chemicals ImplementationOne of the major goals of the project was getting Chemicals’ processes into salesforce.REG wanted to use Salesforce for managing the purchase of Chemicals. At the time,REG used Excel to manage Chemicals’ purchases.First, I tried to understand the process of purchasing chemicals, then looked at the otherbusiness processes in Salesforce (Feedstock and Coproduct in particular) and thencreated a new “record type”. The following picture shows Chemicals’ Record Type thatis now available when a user wants to create a new record type.Figure 7Added Chemicals Record Type13
Figure 8 Chemicals Record Type-SetupFigure 9 New Purchase Form14
After creating a new record type for Chemicals, then I modified and changed a newlayout to assign to my new record type.Figure 10 Chemicals layoutAs part of creating a new layout, I tried to find out what and how many fields should beadded as well as what fields should be modified. For example, the “product” fieldmodified to include Chemicals’ products. Also, “price” field updated with a new formula.Calculating new total price was a complicated process because was dependent onmanager’s inputs.15
The following picture shows the “Total Delivered Price” field, but I deleted the formulabecause of confidentiality.Figure 11 Total Delivered Price- A Field ExampleIn general, in Salesforce we can control user’s inputs or relationship between fieldsusing the validation rules. I used a couple of ‘validation rules’ on salesforce to force userto input necessary info. As an example, I didn’t want to let a user keeps some specificfields empty since those fields were part of Price calculations. In this case, validationrules helped me to don’t let user save a new purchase without filling necessary fields.Following example shows a validation rule which doesn’t let the user keep a specificfield empty when the product is KM32.16
Figure 12 Validation RuleNext step was setting email alert for a new purchase in a way that when a user submitsa new purchase, an automatic email sends to specific recipients.Figure 13 Email Alert17
I designed an email template and assigned it to the email alert since we wanted aspecific email template to be sent out. Then, a workflow rule was assigned to that emailtemplate. This workflow rule checked a few conditions before sending the email.Conditions include if the purchased status is ‘closed/won’ and if the type of purchase is‘chemicals’. Also, this rule checked the “do not send email” condition to be false beforesending an email.Figure 14 Workflow Rule18
Analyzing DataA big part of the project was analyzing the data and preparing related reports anddashboards for senior managers. I worked on preparing the dashboards and reports fortwo parts of the procurement department: Coproducts and Chemicals.Salesforce provides various report types like tabular, summary, and matrix. Also,Salesforce provides various features to customize a report like ‘summary formula’,‘filters’, ‘review pan’, and ‘grouping data’.The following picture shows a couple of reports that were made for the project. Each ofthese reports could be shown as a chart on a dashboard. Each chart could be in variousformats like bar, line, and etc.19
Figure 15 A Snapshot of My Reports on SalesforceSince these charts and reports were made on sales data, I deleted numbers, titles, andcategories in respect to confidentiality of REG data. In the following, I bring just a fewcharts as an example to show how I prepared charts and reports on sales and purchasedata.In the following picture, you can see the average amount of a specific field on variousproducts. Salesforce gives the option of filtering date based on a relative date like20
”LAST 30 DAYS”. We also can filter the date based on specific predefined ranges like“Current fiscal year”. Using custom dates are also available.I created the following charts to show the average amount of specific fields by productsstarted from Jan 2018.Figure 16 Chart-Average by ProductsFigure 17vChart-Average by Products221
The following picture shows the filter option on a report. We can add several filters and thenadd a conditional rule for filters. For example, we can set a rule like ’Filter1 AND (Filter2 ORFilter3)’.Figure 18 Filter Option on Reports22
Following chart shows another type of chart that I used to show top customers. AccountName represents the customer and this chart shows total number of contracts with eachcustomer.Figure 19 Chart- Total Number of Contracts with Each CustomerSalesforce provides different types of reports, so I played with data and categorized it invarious ways to see which one gives me a better insight. Reports could be tabular,matrix or summary. I used different reports for different charts. For example, the nextreport is a matrix report which shows data in a matrix of customers and products. Eachcell represents total quantities that were purchased from each customer.23
Figure 20 Matrix ReportThe following chart was challenging since I wanted the sum and average of two differentfields to be shown on just one chart. Salesforce is limited in terms of showing twodifferent values just in one chart. I tried several different ways to be able to get thischart.Figure 21 Sum and Average in One Chart24
It took me a while to find out how to show a second value on a chart and plot it on asecond Axis. Sum and average of two different values are plotted on the Y axis to getthe above chart.Figure 22 Chart Setting on ReportsFollowing chart again is another example of showing two different values at the sametime on one chart while values are in different types (Line and Bar).Figure 23 Chart- Line and Bar Charts Together25
The next chart shows the average of a specific field for different products while havinga 30 last days filter on data.Figure 24 Chart- Average by Products-30 Last Days FilterThe next one is another example as a bar chart type.Figure 25 Chart- Bar Type26
One of the other interesting features of Salesforce report is Bucketing! As you can seein the following picture, I bucketed two different products BRO and Ole and then got thereport on them as one category. This feature lets to merge different items and then getthe report on new categories.Figure 26Chart- Bucketing Example27
Following picture shows how we can bucket different values in a report.Figure 27Bucketing OptionIn many reports, I used ‘add summary formula’ feature to apply my formula on the dataand get a new value in my reports. For example, I added the weighted average formulain reports to get the average. The following picture shows how ‘add summary formula’feature works.28
Figure 28 Summary Formula FeatureIn fact, this ‘summary formula’ adds a new column to the report holding our intendedvalue. Then, we can use this new column in our reports and charts.Figure 29 Example of Added Column by Summary Formula29
SummaryThis project was a great opportunity to learn about REG business as well as SalesforceSoftware. As I mentioned before, Salesforce provides a wide range of features andcapabilities to businesses so that many recognize it as the most powerful CRM.In Addition, the data analysis of the project was a unique opportunity to play with realdata, get reports/charts, and customize the data visualization based on daily needs ofmanagers. Before starting to get reports and dashboard, I met with managers to find outwhat is their day to day needs and then started to think about needed reports andcharts. The process of translating business needs to reports and dashboards was agreat and unique opportunity.30
ReferencesIn this report, introduction to the REG and Salesforce has been based on their websites.https://regi.com/https://Salesforce.com31
to Salesforce, Trailhead is a platform for Salesforce customers to learn about software and ask their questions. Numbers of experts around the world share their experiences there or take online courses. The following table shows the online courses I took on Trailhead. 1 Learn CRM Fundamentals for Lightning Experience