Transcription
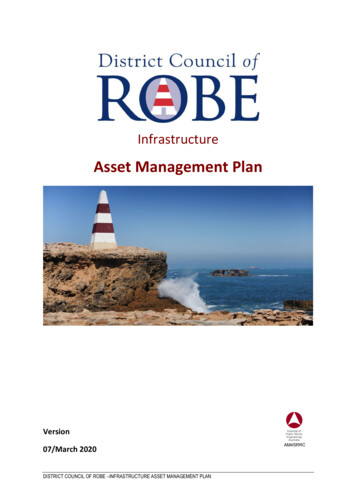
May 2022Power BI DesktopWhakatane District CouncilSummary 21,31215,0633%302,12350,821Monthly Energy Cost SavingsElec. Savings (kWh/mo)Elec. Savings (%)R12M Electricity Savings (kWh/yr)CO2e Savings (kg/mo) 150,047225,11886%1,460,981356,092Gas. Savings (%)R12M Gas Savings (kWh/yr)R12M CO2e Savings (kg/yr)R12M Energy Cost SavingsGas. Savings (kWh/mo)Total Energy (kWh/Month)Total Energy Used for the Month (kWh)12,958 (3%)11,790(2%)5,687(1%)492,495Site Name16,081 (3%)Aquatic Centre22,211 (5%)158,435 (32%)Water Treatment PlantBraemar Rd PumpsPaul Rd Pumps37,934 (8%)Whakatane Oxidation PondsTe Koputu LibraryOhope Oxidation PondsBridger Glade Pumps39,365 (8%)Museum Research CentreWar Memorial HallCivic CentreMcAlister and Rose Garden Pumps48,350 (10%)Johnson Rd Pumps125,188 (25%)
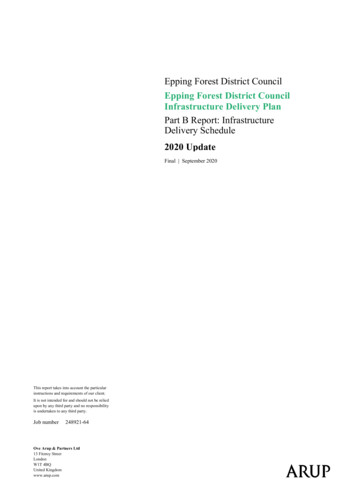
May 2022Power BI DesktopWhakatane District CouncilSummaryEnergy Cost ( /Month)Energy Cost for the Month ( ) 119,598 1,456 1,183(1%) 3,011 (2%) (1%)Site NameAquatic Centre 3,224 (3%)Water Treatment Plant 3,347 (3%) 34,267 (28%)Braemar Rd Pumps 4,381 (4%)Paul Rd PumpsWhakatane Oxidation Ponds 9,277 (8%)Te Koputu LibraryMuseum Research CentreOhope Oxidation Ponds 11,544 (10%)Bridger Glade PumpsCivic CentreJohnson Rd Pumps 12,489 (10%)McAlister and Rose Garden Pumps 31,366 (26%)War Memorial HallCarbon Emissions (kgCO2e/Month)Carbon Emissions for the Month (kgCO2e)66,492Site Name7321,668(1%)1,758 (3%) (3%)2,070 (3%)Aquatic CentreWater Treatment Plant3,759 (6%)22,223 (33%)Braemar Rd PumpsPaul Rd PumpsWhakatane Oxidation Ponds4,882 (7%)Te Koputu LibraryOhope Oxidation PondsMuseum Research Centre5,066 (8%)Bridger Glade PumpsWar Memorial HallCivic Centre6,223 (9%)McAlister and Rose Garden Pumps16,112 (24%)Johnson Rd Pumps
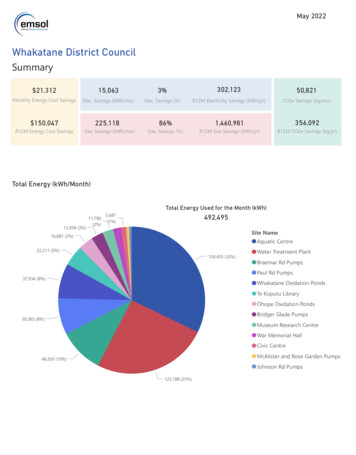
May 2022Power BI DesktopWhakatane District CouncilSummaryCumulative Energy Savings (kWh)4,000,0003,000,000Energy Saved (kWh)Aquatic CentreBraemar Rd PumpsBridger Glade Pumps2,000,000Civic CentreJohnson Rd PumpsMcAlister and Rose Garden PumpsMuseum Research Centre1,000,000Ohope Oxidation PondsPaul Rd PumpsTe Koputu LibraryWar Memorial Hall0Water Treatment yAugustJuneMayAprilWhakatane Oxidation Ponds2022Note: New Zealand was in Covid-19 alert levels 3 and 4 from 23 March until 12 May, 2020. Energy use may have been impacted during this time
May 2022Power BI DesktopWhakatane District CouncilSummaryCumulative Energy Cost Savings ( ) 400,000Site NameAquatic CentreEnergy Cost Saved ( )Braemar Rd PumpsBridger Glade PumpsCivic Centre 200,000Johnson Rd PumpsMcAlister and Rose Garden PumpsMuseum Research CentreOhope Oxidation Ponds 0Paul Rd PumpsTe Koputu ugustJulyJuneMayAprilWar Memorial HallWater Treatment PlantWhakatane Oxidation Ponds2022Cumulative Carbon Savings (kgCO2e)Site NameAquatic CentreBraemar Rd PumpsCarbon Saved (kgCO2e)Bridger Glade PumpsCivic Centre500,000Johnson Rd PumpsMcAlister and Rose Garden PumpsMuseum Research CentreOhope Oxidation PondsPaul Rd PumpsTe Koputu Library0War Memorial HallWater Treatment ustJulyJuneMayAprilWhakatane Oxidation Ponds2022Note: New Zealand was in Covid-19 alert levels 3 and 4 from 23 March until 12 May, 2020. Energy use may have been impacted during this time
May 2022Power BI DesktopWhakatane District CouncilCivic Centre 5,97929,48184%131,4143,752Monthly Energy Cost SavingsElec. Savings (kWh/mo)Elec. Savings (%)R12M Electricity Savings (kWh/yr)CO2e Savings (kg/mo) 20,97216,504R12M Energy Cost SavingsR12M CO2e Savings (kg/yr)Comments:Electric vehicle charging stations have been in use from March 2021, non-routine adjustments are on-going toaccount for the increased electricity use.Electricity savings continue to be more than usual for 2022, the Civic Centre renovation has displaced many officeworkers, which has decreased electricity demand. The Civic Centre has not yet been billed for May 2022. Monthlyusage is estimated based on recent months and will be updated when an invoice for May 2022 is released for theCivic Centre.Marginal cost of electricity for the Civic Centre has approximately doubled due to new contract rates, compared tothe same time last year.40,00020192020Actual Electricity (kWh)20212022Expected Electricity(kWh)Note: New Zealand was in Covid-19 alert levels 3 and 4 from 23 March until 12 May, 2020. Energy use may have been impacted during this berSeptemberAugust0July20,000JuneActual Electricity (kWh)Civic Centre Electricity Use Compared to Baseline (kWh)
May 2022Power BI DesktopWhakatane District CouncilCivic CentreCivic Centre Carbon Emissions Compared to Baseline (kg CO2e)4,000201920202021Actual CO2 st0October2,000SeptemberCO2e (kg)6,0002022Expected CO2 (kg)100,000 10K20192020R12M Electricity Savings (kWh/year)2021R12M CO2 Savings vember50,000 0K2022R12M Cost Savings ( /year)Note: New Zealand was in Covid-19 alert levels 3 and 4 from 23 March until 12 May, 2020. Energy use may have been impacted during this timeR12M Cost Savings ( /year) 20KOctoberElectricity (kWh) / Carbon (kg CO2e)Civic Centre Rolling 12 Month Savings
May 2022Power BI DesktopWhakatane District CouncilCivic CentreCivic Centre Energy Use Index by Month Compared to Rolling 12-Month Values15010020192020EUI Monthly (kWh/year/m 2)20212022EUI R12M (kWh/year/m 2)Note: New Zealand was in Covid-19 alert levels 3 and 4 from 23 March until 12 May, 2020. Energy use may have been impacted during this berSeptemberAugust0July50JuneEnergy Use Index200
May 2022Power BI DesktopWhakatane District CouncilAquatic Centre 14,514-14,905-12%-19,73245,458Monthly Energy Cost SavingsElec. Savings (kWh/mo)Elec. Savings (%)R12M Electricity Savings (kWh/yr)CO2e Savings (kg/mo) 98,976218,36491%1,440,979310,276Gas. Savings (%)R12M Gas Savings (kWh/yr)R12M CO2e Savings (kg/yr)R12M Energy Cost SavingsGas. Savings (kWh/mo)Comments:The outdoor pool is now open year-round and uses a baseline that reflects this change. Electricity use abovebaseline reflects that the pool is now preferentially using electric heat pumps to heat the pool instead of naturalgas, which reduces natural gas use but increases electricity consumption. Electricity use has increased fromFebruary 2022, lower ambient temperatures increase the amount of heating required.Natural gas savings are still excellent, achieving 91% for the month of May 2022. Marginal cost of electricity forthe Aquatic Centre has nearly doubled compared to this time last year, due to new contract rates.Aquatic Centre Electricity Use Compared to Baseline (kWh)150,000100,00020192020Actual Electricity (kWh)20212022Expected Electricity(kWh)Note: New Zealand was in Covid-19 alert levels 3 and 4 from 23 March until 12 May, 2020. Energy use may have been impacted during this 000OctoberActual Electricity (kWh)200,000
02019Actual CO2 (kg)202020212022Expected CO2 (kg)Note: New Zealand was in Covid-19 alert levels 3 and 4 from 23 March until 12 May, 2020. Energy use may have been impacted during this ebruaryJanuaryDecemberActual Natural Gas ctoberSeptemberAugustJulyJune0AugustCO2e (kg)Natural Gas (kWh)Power BI DesktopMay 2022Whakatane District CouncilAquatic CentreAquatic Centre Natural Gas Compared to Baseline (kWh)400,000200,0002022Expected Natural Gas (kWh)Aquatic Centre Carbon Emissions Compared to Baseline (kg CO2e)100,00050,000
May 2022Power BI DesktopWhakatane District CouncilAquatic Centre20192020R12M Electricity Savings (kWh/year)2021R12M CO2 Savings ovemb OctoberAugustSeptem JulyJuneMayAprilMarchFebruaryJanuaryDecemberNovemb OctoberSeptem AugustR12M Cost Savings ( /year) 20,000July-500,000May 40,000June0April 60,000March500,000February 80,000January1,000,000December 100,000Novemb 1,500,000OctoberElectricity (kWh) / Carbon (kg CO2e)Aquatic Centre Rolling 12 Month Savings2022R12M Gas Savings (kWh/year)R12M Cost Savings ( /year)Aquatic Centre Energy Use Index by Month Compared to Rolling 12-Month Values4,00020192020EUI Monthly (kWh/year/m 2)20212022EUI R12M (kWh/year/m 2)Note: New Zealand was in Covid-19 alert levels 3 and 4 from 23 March until 12 May, 2020. Energy use may have been impacted during this berSeptemberAugust0July2,000JuneEnergy Use Index6,000
May 2022Power BI DesktopWhakatane District CouncilTe Koputu Library 9623,69824%29,838786Monthly Energy Cost SavingsElec. Savings (kWh/mo)Elec. Savings (%)R12M Electricity Savings (kWh/yr)CO2e Savings (kg/mo) 2,4281,41112%-24,861-1,497Gas. Savings (%)R12M Gas Savings (kWh/yr)R12M CO2e Savings (kg/yr)R12M Energy Cost SavingsGas. Savings (kWh/mo)Comments:Gas use in April and May 2022 has decreased compared to March 2022, even though April and May 2022 werecooler months on average.Dehumidification loads are significant as electricity is required for cooling and gas is required for re-heat. Controlof relative humidity has improved, however further investigation is needed to understand if this is optimised or ifthe cooling and heating coils are fighting each other excessively.Marginal cost of electricity for the Library has roughly doubled compared to this time last year, due to newcontract rates.Te Koputu Library Electricity Use Compared to Baseline (kWh)15,00010,00020192020Actual Electricity (kWh)20212022Expected Electricity(kWh)Note: New Zealand was in Covid-19 alert levels 3 and 4 from 23 March until 12 May, 2020. Energy use may have been impacted during this berSeptemberAugust0July5,000JuneActual Electricity (kWh)20,000
May 2022Power BI DesktopWhakatane District CouncilTe Koputu LibraryTe Koputu Library Natural Gas Compared to Baseline (kWh)15,00010,000201920202021Actual Natural Gas oberSeptemberAugust0July5,000JuneNatural Gas (kWh)20,0002022Expected Natural Gas (kWh)Te Koputu Library Carbon Emissions Compared to Baseline (kg CO2e)4,00020192020Actual CO2 (kg)20212022Expected CO2 (kg)Note: New Zealand was in Covid-19 alert levels 3 and 4 from 23 March until 12 May, 2020. Energy use may have been impacted during this ber0September2,000AugustCO2e (kg)6,000
May 2022Power BI DesktopWhakatane District CouncilTe Koputu LibraryTe Koputu Library Energy Use Index by Month Compared to Rolling 12-Month Values20020192021EUI Monthly (kWh/year/m toberSeptemberAugust0July100JuneEnergy Use Index3002022EUI R12M (kWh/year/m 2) 10,000 5,0002019R12M Electricity Savings (kWh/year)2020R12M CO2 Savings (kgCO2e/year)2021R12M Gas Savings er0 02022R12M Cost Savings ( /year)Note: New Zealand was in Covid-19 alert levels 3 and 4 from 23 March until 12 May, 2020. Energy use may have been impacted during this timeR12M Cost Savings ( /year)50,000OctoberElectricity (kWh) / Carbon (kg CO2e)Te Koputu Library Rolling 12 Month Savings
May 2022Power BI DesktopWhakatane District CouncilMuseum and Research Centre 8642,34721%20,6391,157Monthly Energy Cost SavingsElec. Savings (kWh/mo)Elec. Savings (%)R12M Electricity Savings (kWh/yr)CO2e Savings (kg/mo) 5,6493,94359%41,50111,654Gas. Savings (%)R12M Gas Savings (kWh/yr)R12M CO2e Savings (kg/yr)R12M Energy Cost SavingsGas. Savings (kWh/mo)Comments:The rolling 12 month EUI has dropped consistently since April 2021 for the Museum and Research Centre, which isgood. Electricity use was less than expected in May 2022 and council staff are occupying the building as the CivicCentre is being re-developed. Natural gas use has been well below baseline for the last 12 months.Marginal cost of electricity for the Museum and Research Centre has doubled compared to this time last year, dueto new contract rates.Rolling 12 month savings have reached a new record; with 62,000 kWh in energy savings, 11,600 kg CO2e, and 5,600 saved anually.10,00020192020Actual Electricity (kWh)20212022Expected Electricity(kWh)Note: New Zealand was in Covid-19 alert levels 3 and 4 from 23 March until 12 May, 2020. Energy use may have been impacted during this berSeptemberAugust0July5,000JuneActual Electricity (kWh)Museum Research Centre Electricity Use Compared to Baseline (kWh)
May 2022Power BI DesktopWhakatane District CouncilMuseum and Research CentreMuseum Research Centre Natural Gas Compared to Baseline (kWh)201920202021Actual Natural Gas oberSeptemberAugust0July10,000JuneNatural Gas (kWh)20,0002022Expected Natural Gas (kWh)Museum Research Centre Carbon Emissions Compared to Baseline (kg CO2e)CO2e (kg)6,0004,00020192020Actual CO2 (kg)20212022Expected CO2 (kg)Note: New Zealand was in Covid-19 alert levels 3 and 4 from 23 March until 12 May, 2020. Energy use may have been impacted during this berSeptember0August2,000
May 2022Power BI DesktopWhakatane District CouncilMuseum and Research CentreMuseum Research Centre Energy Use Index by Month Compared to Rolling 12-Month Values30020020192021EUI Monthly (kWh/year/m toberSeptemberAugust0July100JuneEnergy Use Index4002022EUI R12M (kWh/year/m 2)40,000 4,00020,000 2,00002019R12M Electricity Savings (kWh/year)2020R12M CO2 Savings (kgCO2e/year)2021R12M Gas Savings 0November 02022R12M Cost Savings ( /year)Note: New Zealand was in Covid-19 alert levels 3 and 4 from 23 March until 12 May, 2020. Energy use may have been impacted during this timeR12M Cost Savings ( /year) 6,000OctoberElectricity (kWh) / Carbon (kg CO2e)Museum Research Centre Rolling 12 Month Savings
May 2022Power BI DesktopWhakatane District CouncilWar Memorial Hall 2716759%25,516390Monthly Energy Cost SavingsElec. Savings (kWh/mo)Elec. Savings (%)R12M Electricity Savings (kWh/yr)CO2e Savings (kg/mo)48%3,3624,013Gas. Savings (%)R12M Gas Savings (kWh/yr)R12M CO2e Savings (kg/yr) 3,6471,400R12M Energy Cost SavingsGas. Savings (kWh/mo)Comments:A baseline was created for War Memorial Hall that adjusts for ambient temperature. The baseline period is July2020 to June 2021. The War Memorial Hall uses more electricity and gas in winter months. The War Memorial Hallis on a NHH account, some months' usage may be estimated by the retailer and captured by a subsequent meterreading. Manual meter readings can improve accuracy of electricity and gas usage.A new trend emerged from October 2021 as the relative amount of savings achieved at the War Memorial Hall hasincreased compared previous years. This may be due to a reduced level of occupancy as a result of Covid-19.Demand for electricity in May 2022 has increased significantly compared to April 2022, however, 9% savings arestill being achieved at the War Memorial Hall for the month of May. Compared to May 2021, 22% less electricitywas used in May 2022.War Memorial Hall Electricity Use Compared to Baseline (kWh)15,00010,00020192020Actual Electricity (kWh)20212022Expected Electricity(kWh)Note: New Zealand was in Covid-19 alert levels 3 and 4 from 23 March until 12 May, 2020. Energy use may have been impacted during this berSeptemberAugust0July5,000JuneActual Electricity (kWh)20,000
May 2022Power BI DesktopWhakatane District CouncilWar Memorial HallWar Memorial Hall Natural Gas Compared to Baseline (kWh)Natural Gas (kWh)30,00020,00010,00020202021Actual Natural Gas rOctoberSeptemberAugustJulyJune02022Expected Natural Gas (kWh)War Memorial Hall Carbon Emissions Compared to Baseline (kg CO2e)8,000CO2e (kg)6,0004,00020192020Actual CO2 (kg)20212022Expected CO2 (kg)Note: New Zealand was in Covid-19 alert levels 3 and 4 from 23 March until 12 May, 2020. Energy use may have been impacted during this berSeptemberAugustJuly0June2,000
May 2022Power BI DesktopWhakatane District CouncilWar Memorial HallWar Memorial Hall Energy Use Index by Month Compared to Rolling 12-Month Values201920202021EUI Monthly (kWh/year/m rSeptemberAugust0July20JuneEnergy Use Index402022EUI R12M (kWh/year/m 2)30,00020,000 2,00010,000 02021R12M Electricity Savings (kWh/year)R12M CO2 Savings ovemberOctoberSeptemberAugust02022R12M Gas Savings (kWh/year)R12M Cost Savings ( /year)Note: New Zealand was in Covid-19 alert levels 3 and 4 from 23 March until 12 May, 2020. Energy use may have been impacted during this timeR12M Cost Savings ( /year) 4,000JulyElectricity (kWh) / Carbon (kg CO2e)War Memorial Hall Rolling 12 Month Savings
May 2022Power BI DesktopWhakatane District CouncilWater Treatment Plant- 2,413-11,075-10%-40,211-1,425Monthly Energy Cost SavingsElec. Savings (kWh/mo)Elec. Savings (%)R12M Electricity Savings (kWh/yr)CO2e Savings (kg/mo)- 7,034-5,175R12M Energy Cost SavingsR12M CO2e Savings (kg/yr)Comments:Electricity use was more than expected and the EUI is 8% higher than it has been for the past year. Historically,months with lower demand have higher EUIs, such as April 2020, April 2022, and May 2022.Marginal cost of electricity for the WTP has doubled compared to this time last year, due to new contract rates.Water Treatment Plant Electricity Use Compared to Baseline (kWh)150,000100,00020192020Actual Electricity (kWh)20212022Expected Electricity(kWh)Note: New Zealand was in Covid-19 alert levels 3 and 4 from 23 March until 12 May, 2020. Energy use may have been impacted during this 000OctoberActual Electricity (kWh)200,000
May 2022Power BI DesktopWhakatane District CouncilWater Treatment PlantWater Treatment Plant Carbon Emissions Compared to Baseline (kg CO2e)201920202021Actual CO2 ber0September10,000AugustCO2e (kg)20,0002022Expected CO2 (kg) 00- 5,0002 2020R12M Electricity Savings (kWh/year)2021R12M CO2 Savings R12M Cost Savings ( /year)Note: New Zealand was in Covid-19 alert levels 3 and 4 from 23 March until 12 May, 2020. Energy use may have been impacted during this timeR12M Cost Savings ( /year) 5,00050,000DecemberElectricity (kWh) / Carbon (kg CO2e)Water Treatment Plant Rolling 12 Month Savings
May 2022Power BI DesktopWhakatane District CouncilWater Treatment PlantWater Treatment Plant Energy Use Index by Month Compared to Rolling 12-Month Values0.420192020EUI Monthly (kWh/m 3)20212022EUI R12M (kWh/m 3)Note: New Zealand was in Covid-19 alert levels 3 and 4 from 23 March until 12 May, 2020. Energy use may have been impacted during this berSeptemberAugust0.0July0.2JuneEnergy Use Index0.6
May 2022Power BI DesktopWhakatane District CouncilBraemar Road Pump Station 5162,3255%90,254378Monthly Energy Cost SavingsElec. Savings (kWh/mo)Elec. Savings (%)R12M Electricity Savings (kWh/yr)CO2e Savings (kg/mo) 11,33412,015R12M Energy Cost SavingsR12M CO2e Savings (kg/yr)Comments:Continued savings from high efficiency pumps and motors, installed September 2020. The EUI has increasedcompared to March 2022, even though April 2022 was month that achieved a lower EUI. The EUI is the highestthat it has been since the installation of the high efficiency pumps and motors in Sept 2020. An increasing EUI mayindicate that the pumps and motors could benefit from maintenance to return their performance closer to what itwas when the pumps were first installed.Marginal cost of electricity for Braemar Road Pump Station has approximately doubled compared to this time lastyear, due to new contract rates.Braemar Rd Pumps Electricity Use Compared to Baseline (kWh)60,00040,00020192020Actual Electricity (kWh)20212022Expected Electricity(kWh)Note: New Zealand was in Covid-19 alert levels 3 and 4 from 23 March until 12 May, 2020. Energy use may have been impacted during this berSeptemberAugust0July20,000JuneActual Electricity (kWh)80,000
May 2022Power BI DesktopWhakatane District CouncilBraemar Road Pump StationBraemar Rd Pumps Carbon Emissions Compared to Baseline (kg CO2e)201920202021Actual CO2 st0October5,000SeptemberCO2e (kg)10,0002022Expected CO2 (kg) 10,00050,00020192020R12M Electricity Savings (kWh/year)2021R12M CO2 Savings ember0 5,000 02022R12M Cost Savings ( /year)Note: New Zealand was in Covid-19 alert levels 3 and 4 from 23 March until 12 May, 2020. Energy use may have been impacted during this timeR12M Cost Savings ( /year)100,000OctoberElectricity (kWh) / Carbon (kg CO2e)Braemar Rd Pumps Rolling 12 Month Savings
May 2022Power BI DesktopWhakatane District CouncilBraemar Road Pump StationBraemar Rd Pumps Energy Use Index by Month Compared to Rolling 12-Month Values0.30.220192020EUI Monthly (kWh/m 3)20212022EUI R12M (kWh/m 3)Note: New Zealand was in Covid-19 alert levels 3 and 4 from 23 March until 12 May, 2020. Energy use may have been impacted during this berSeptemberAugust0.0July0.1JuneEnergy Use Index0.4
May 2022Power BI DesktopWhakatane District CouncilPaul Road Pump Station- 840-3,769-11%-23,465-484Monthly Energy Cost SavingsElec. Savings (kWh/mo)Elec. Savings (%)R12M Electricity Savings (kWh/yr)CO2e Savings (kg/mo)- 3,412-3,009R12M Energy Cost SavingsR12M CO2e Savings (kg/yr)Comments:A general trend can be observed that months of high demand typically use more electricity than expected. Thismay indicate that the pump is operating outside its optimum efficiency range. The EUI in May 2022 has increasedby 8% compared to April 2022, the pumps are using 8% more electricity for each cubic meter of water pumpedcompared to last month.Marginal cost of electricity for Paul Road Pump Station has approximately doubled compared to this time lastyear, due to new contract rates.Paul Rd Pumps Electricity Use Compared to Baseline (kWh)40,00020192020Actual Electricity (kWh)20212022Expected Electricity(kWh)Note: New Zealand was in Covid-19 alert levels 3 and 4 from 23 March until 12 May, 2020. Energy use may have been impacted during this berSeptemberAugust0July20,000JuneActual Electricity (kWh)60,000
May 2022Power BI DesktopWhakatane District CouncilPaul Road Pump StationPaul Rd Pumps Carbon Emissions Compared to Baseline (kg CO2e)8,000CO2e (kg)6,0004,000201920202021Actual CO2 emberAugust0October2,0002022Expected CO2 (kg)0- 1,000-10,000- 2,000-20,00020192020R12M Electricity Savings (kWh/year)2021R12M CO2 Savings ember- 3,0002022R12M Cost Savings ( /year)Note: New Zealand was in Covid-19 alert levels 3 and 4 from 23 March until 12 May, 2020. Energy use may have been impacted during this timeR12M Cost Savings ( /year) 0OctoberElectricity (kWh) / Carbon (kg CO2e)Paul Rd Pumps Rolling 12 Month Savings
May 2022Power BI DesktopWhakatane District CouncilPaul Road Pump StationPaul Rd Pumps Energy Use Index by Month Compared to Rolling 12-Month Values0.60.420192020EUI Monthly (kWh/m 3)20212022EUI R12M (kWh/m 3)Note: New Zealand was in Covid-19 alert levels 3 and 4 from 23 March until 12 May, 2020. Energy use may have been impacted during this berSeptemberAugust0.0July0.2JuneEnergy Use Index0.8
May 2022Power BI DesktopWhakatane District CouncilJohnson Road Pump Station 7073,20955%21,352413Monthly Energy Cost SavingsElec. Savings (kWh/mo)Elec. Savings (%)R12M Electricity Savings (kWh/yr)CO2e Savings (kg/mo) 4,7082,750R12M Energy Cost SavingsR12M CO2e Savings (kg/yr)Comments:The pumps at Johnson Rd have been used less than previous years. The rolling 12-month EUI for Johnson RoadPump Station has increased over the past year as demand decreases. This is expected as the pump station ha
the cooling and heating coils are fighting each other excessively. Marginal cost of electricity for the Library has roughly doubled compared to this time last year, due to new . Bridger Glade Pu mps Elec tricity Use Com pared to B aseline ( kWh) 0. 10,000. Actual Elec tricity (kWh) 20,000. June. July. August. September. October. November .