Transcription
Paper SAS593-2017Key Components and Finished Products Inventory Optimization for a MultiEchelon Assembly SystemSherry Xu, SAS Institute Inc.ABSTRACTA leading global information and communications technology solution company provides a broad range oftelecom products across the world. Their finished products share commonality in key components, and, inmost cases, are assembled after the customer orders are placed. Each finished product typically consistsof a large number of key components, and the stockout of any components will cause delivery delays ofcustomer orders. For these reasons, the optimal inventory policy of one component should be determinedin conjunction with those of other components.Currently the company uses business experience to manage the inventory across their supply chainnetwork for all of the components and finished products. However, the increasing variety of products andbusiness expansion raise difficulties in inventory management. The company wants to explore asystematic approach to optimizing inventory policies, assuring customer service level and minimizing totalinventory cost.This paper describes the use of SAS/OR and SAS inventory optimization technologies to model such amulti-echelon assembly system and optimize inventory policies for key components and finishedproducts.INTRODUCTIONA leading global information and communications technology solution company (referred to as “SHW” forconfidentiality reasons) supplies a broad range of telecom products selling across the world. Theirproducts range from the telecommunication infrastructure to personal communications facilities. There isa huge commonality in key components across many finished products. Customers usually placeadvance orders, but they might change or cancel orders before deliveries are made. In order to have afast response to customer orders, components are assembled into sub-assemblies and stocked acrossthe supply chain network.Because of the uncertainty of customer orders and supply, SHW maintains a certain amount of inventoryof key components, sub-assemblies, and finished products across the supply chain network. The stockoutand the high inventory exist in the supply system at the same time. It is also hard for the company to tellwhether there is room to decrease the inventory or to identify whether the current inventory is insufficient.SHW is looking for a scientific methodology to improve their current supply chain planning system and tosuggest what to stock, where to stock and how much to.In this paper, I discuss how to approach this business issue and optimize the inventory for SHW.PROBLEM STATEMENTSHW has one manufacturing plant, several warehouses, and regional distribution sites. The keycomponents are assembled into sub-assemblies in the manufacturing plant. The sub-assemblies areshipped to the warehouses. The customer orders come with different package information. Eachcustomer order specifies the required quantity of each item and the required delivery time. The itemsinclude the finished products and/or some sub-assemblies.After the customer orders are received at regional distribution sites (RDSs), the sub-assemblies areassembled into finished products in the warehouses. Then the finished products are transported to theRDS to fulfill the customer orders at the required delivery time. To a large extent, this is an assemble-toorder system. However, the warehouses can deliver finished products to an RDS in advance in order tomeet orders with a tight delivery schedule.1
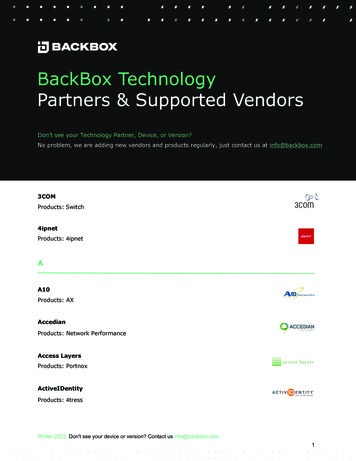
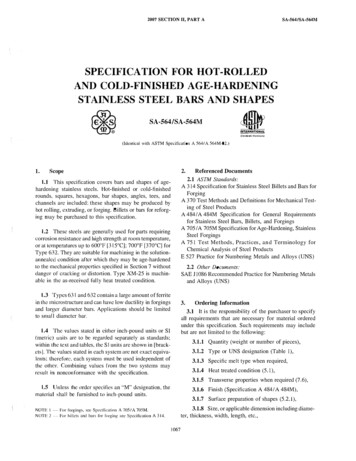
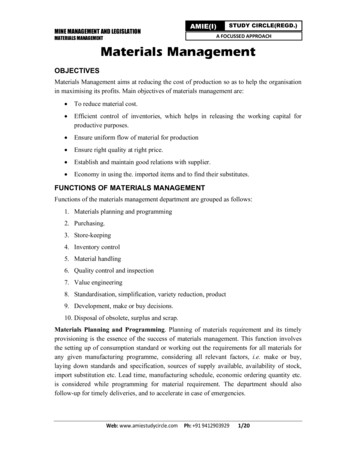
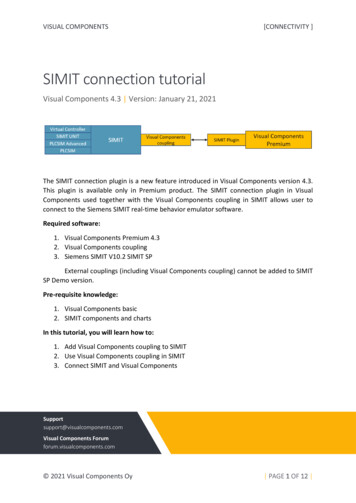
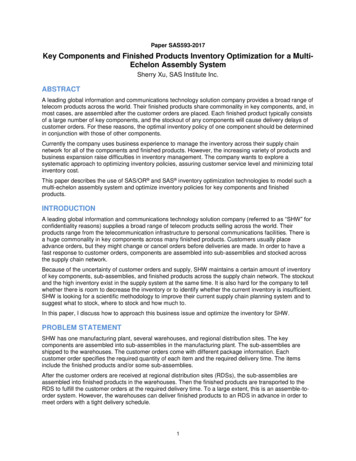
The objective of the research into the supply chain system is to minimize the delay in order delivery andmaximize the inventory turnover ratio.FINISHED PRODUCTSEach type of finished product requires a unique selection of key components and sub-assemblies. Someof the components might be shared across several finished products. The time to assemble a finishedproduct is short. The time to produce sub-assemblies, however, is substantial. Figure 1 shows anexample of a finished product, DBBP530. It is made from the sub-assemblies MPT, BBP, BBI, and UTRP,and the key component DRRU Cable. Sub-assembly MPT is produced from key components OCXO, E1,and FE. There are two options for sub-assemblies BBI, which are 1.25G BBI and 2.5G BBI. Customerscan choose either option when they order finished product DBBP530. This is also the case with subassembly UTRP. The assembly takes place in the warehouses. The production of MPT, BBP, BBI, andUTRP takes place in the manufacturing plant.Figure 1. Example of Finished ProductORDER FULFILLMENTThe customer orders can consist of finished products and sub-assemblies, which must be delivered onthe required delivery date. Early delivery is not allowed. If products arrive at an RDS before they can beshipped to the customer sites, they must wait at the RDS.SUPPLY CHAIN NETWORKSSupply chain networks are classified based on the number of echelons (or levels) in their distributionnetwork. Figure 2 illustrates the three-echelon supply chain network at SHW. Key components areacquired from external suppliers and stored in the plant and warehouses for the production and assemblyprocesses. Sub-assemblies are produced in the manufacturing plant, and stocked across all echelons. Itis worth pointing out that some sub-assemblies are open for ordering, so an RDS might carry an inventoryof finished products as well as sub-assemblies. The supply lead times and production lead times at theplant are long. The assembly lead times at warehouses are relatively short.2
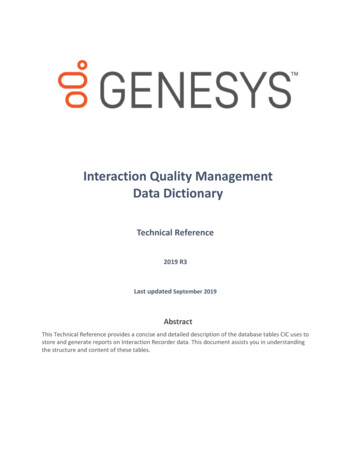
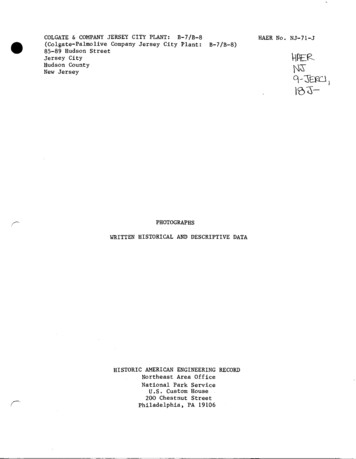
Figure 2. Supply Chain NetworkIn a typical assemble-to-order system, there is no need to carry inventory for finished products. Thefinished products are produced only when the orders are realized and shipped to customer after theproduction is completed. However, SHW needs to hold inventory for finished products for two reasons.The first reason is that the required delivery time is sometimes shorter than the production and assemblytime. Therefore, SHW needs the finished products inventory to meet customer orders. Secondly,customers might modify their orders before the delivery date, which limits SHW’s ability to respond to themodifications from production and assembly and thus requires SHW to use the finished productsinventory to fulfill customer orders.Currently business experience drives the inventory planning at SHW. In order to improve the inventoryplanning, it is necessary to answer these questions: Which key components, sub-assemblies, andfinished products should be stocked in the supply chain network? Where should they be stocked? Howmuch of each should be stocked?SOLUTION APPROACHThe solution approach is depicted in Figure 3. The Demand Forecasts block provides the key input forinventory management. Service levels are optimized for each stock keeping unit (SKU) and locationcombination, from a global perspective. Then, we compute optimal inventory targets and orderprojections, based on the service-level settings determined in the previous step. With the orderprojections of sub-assemblies, the plant can optimize the production plan, and eventually generate thereplenishment order suggestions for key components. The details are explained in the following sections.3
Figure 3. Overall Process Flow of Solution ApproachOPTIMIZE THE SERVICE LEVELAs the first step, we determine the optimal service level for each SKU-location. The SKUs include keycomponents, sub-assemblies, and finished products. The locations include the manufacturing plant, thewarehouses, and the RDSs.The service level is measured as the percent of orders fulfilled. If the customer order is delivered at therequired delivery time, the customer order is fulfilled. Otherwise, the customer order is unfulfilled. Sinceservice levels are set as long-term goals, the stationary demand is used for service-level optimization.The stationary demand is a long-term average demand of customer orders at the RDSs.The order dates and required delivery dates are important. If the time difference between them is bigenough, you will have enough time to assemble-to-order, or even to make-to-order. You need to carryinventory only to cover customer demand within the lead time. So first we must determine how muchdemand needs to be covered by inventory. A demand profile is produced using historical orders bycomparing the time gap between order dates and required delivery dates with transportation time andassembly time. This profile partitions the demand into three different demand streams. The first demandstream is the order percentage to be fulfilled by the inventory at the RDSs, and the second stream is theorder percentage to be fulfilled by the inventory at the warehouses. The last stream tells how much of theorders can be fulfilled by the assemble-to-order process at the warehouses.In the RDSs, for finished products and sub-assemblies, you need to consider only the first stream of thestationary demand. The stationary demand of finished products at the warehouses is the aggregation ofthe stationary demand of their downstream RDSs. The stationary demand of sub-assemblies and keycomponents at the warehouse can be derived from the finished products and sub-assemblies quantity,considering of the bill of materials. However, for some types of sub-assemblies, the stationary demandincludes internal demand from the finished products and external demand from customers directly. It is4
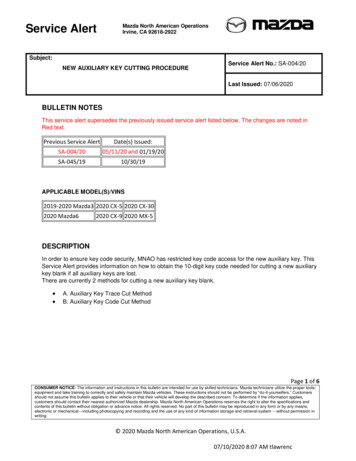
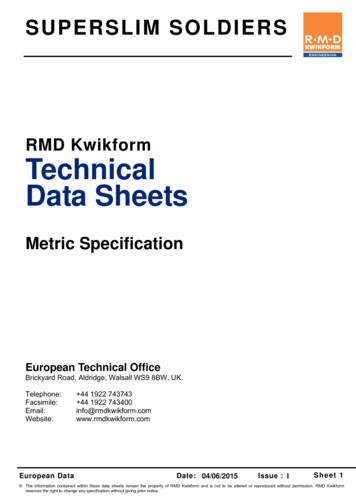
the same with the demand of key components at the manufacturing plant. Remember, all of the demandis within the lead time with respect to the SKU-location combination.By knowing the stationary demand of each SKU-location combination, you can simulate the inventorytarget and the corresponding expected backlog for the different sets of service level, for example, bysetting the service level from 80%, 81%, to 99%. For each service-level setting, the MIRP procedure isapplied to compute the expected backlog and inventory target. Then, the OPTMODEL procedure is usedto determine the optimal service level and inventory target for each SKU-location combination with theobjective of minimizing the total expected backlog across the supply network.In order to optimize the service level for the entire supply chain, we use this close approximation totranslate the multi-echelon problem to a single-echelon case. Figure 4 illustrates the process fromdemand profiling and a stationary demand calculation to service-level optimization, and enumerates thekey input and output of each process.Figure 4. Process to Optimize the Service LevelFigure 5 is an example of statistics that show how many RDSs and how many warehouses hold theinventory for each SKU (the Item column), how much inventory is carried in the RDSs, the warehouses,and the manufacturing plant. Items 100, 200, 300, and 400 are finished products. Items 201 to 204 aresub-assemblies. Items 101 to 106 are key components. For some SKUs, like item 400 and item 203, it isnot suggested to hold any inventory at the RDSs.Figure 5. Inventory StatisticsThe service-level optimization determines whether it is necessary to carry inventory of finished productsor sub-assemblies in each of the RDSs, and the service level for each SKU-location combination is also5
optimized. If the inventory target is zero, it is unnecessary to carry inventory for the SKU-locationcombination. In this way, the supply chain network structure is constructed.OPTIMIZE THE INVENTORY FOR FINISHED PRODUCTSFinished products are carried in the RDSs and the warehouses. The supply chain network structuresuggests the optimized SKU-RDS combinations and SKU-warehouse combinations. The optimal servicelevel and the supply chain network structure are the main drivers to optimize the time-based inventorytarget for each finished products at the RDSs and warehouses.Basically, the optimal inventory target is the sum of the safety stock and forecasted demand over leadtime. The forecasted demand input is the first stream of demand within the RDSs’ lead time. Theforecasted demand input data includes the forecast mean and variance for each SKU-locationcombination. Safety stock represents the amount of inventory that is required to cover the uncertainty inthe demand forecast, which is measured by the demand variance. Because customers can modify orcancel orders before they are delivered, the demand variance input is necessary for the time-basedinventory target optimization.For each finished product and RDS combination, the lead time is the sum of the average transportationtime and the average assemble time. For each finished product and warehouse combination, the demandincludes the internal demand from the replenishment orders of downstream RDSs and the externaldemand from the customer orders. The lead time is the average assemble time.To determine the optimal time-based inventory target, you can use the MIRP procedure with theobjective OPTPOLICY. If the inventory position (includes the on-hand inventory and the pipelineinventory) is below the inventory target, the replenishment order of current period and order projections offuture periods will be generated by setting the objective ORDER KPI in the MIRP procedure. Note thatthe optimal inventory target in this step might be different from the inventory target that was calculatedduring the optimization of the service level, and it varies across the time horizon due to the differentforecasted demand.OPTIMIZE THE INVENTORY FOR SUB-ASSEMBLIESThe sub-assemblies are produced in the manufacturing plant, and are then spread to warehouses andRDSs. This step optimizes the inventory of sub-assemblies in the RDSs, the warehouses, and themanufacturing plant. In the RDSs, the optimization logic and techniques are the same as for the inventoryoptimization of the finished products in the RDSs.In the warehouses, the demand of sub-assemblies consists of two parts. One part is directly related to thecustomer orders and includes the internal demand of the replenishment orders from the downstreamRDSs and the external demand of the customer orders (the second demand stream in the demandprofile). The other part comes from all of the customer orders, expanded by the bill of materials.In the manufacturing plant, the sub-assemblies are produced and stored. First, you need to calculate theinventory target for each sub-assemblies and generate the replenishment orders and future orderprojections. This is a typical use of the MIRP procedure.With replenishment orders of sub-assemblies, you are ready to optimize the production plan, consideringthe availability of each type of resource, with the objective of optimizing the expected revenue.OPTIMIZE THE INVENTORY FOR KEY COMPONENTSSHW orders key components from external suppliers. The lead time for key components replenishment islong. It takes around 30 days to 90 days. Compared with the order lead time, the production time is quiteshort. The replenishment of sub-assemblies is accomplished by SHW’s internal orders of sub-assemblies,which provide the required amount and the required date for each sub-assembly. The demand for keycomponents is derived from the replenishment information and the bill of materials, and the demand timeis simplified to the required sub-assembly date, considering the short production time.The inventory of each type of key component is reviewed periodically. To avoid the unstable supply risk,SHW orders from more than one external supplier for some of the key components. The fixed ordering6
cost and variable ordering cost are different for different suppliers. The longer lead time is applied into theinventory model to optimize the inventory policy. You can use the MIRP procedure to calculate thereorder and order-up-to levels for each period, and produce the order suggestions considering theinventory position. The order amount is allocated to different suppliers according to a best allocation plan,which leads to the least total inventory cost. To pick up the best allocation plan, the inventory cost, whichconsists of the fixed ordering cost, the variable ordering cost, and the holding cost, is first simulated fordifferent allocation plans in the planning periods. Then, the mathematical optimization model is built withthe objective of minimizing the total inventory cost.CONCLUSIONThis paper presents a solution approach that uses SAS/OR and SAS inventory optimization technologiesto support a telecommunication technology company to optimize the inventory for finished products, subassemblies, and key components at different locations. For the first step, the demand is divided into threedifferent steams. For the downstream locations, only the demand within the lead time is covered by theinventory. After that, the OPTMODEL procedure and the MIRP procedure are used to optimize the overallservice level for each of the SKU and location combinations and to construct the supply chain networkstructure. Then, the inventory targets are optimized and replenishment order suggestions are generatedfor the finished products and sub-assemblies at all locations. The last step answers when, where, andhow much to order for each key component.CONTACT INFORMATIONYour comments and questions are valued and encouraged. Contact the author at:Sherry XuSAS Research and Development (Beijing) Co., Ltd.Phone: 86-10-8319-3465Sherry.Xu@sas.comwww.sas.comSAS and all other SAS Institute Inc. product or service names are registered trademarks or trademarks ofSAS Institute Inc. in the USA and other countries. indicates USA registration.Other brand and product names are trademarks of their respective companies.7
systematic approach to optimizing inventory policies, assuring customer service level and minimizing total inventory cost. This paper describes the use of SAS/OR and SAS inventory optimization technologies to model such a multi-echelon assembly system and optimize inventory policies for key components and finished products. INTRODUCTION