Transcription
Presented at the Computer Measurement Group Conference, November 2013Capacity Planning:A Revolutionary Approach for Tomorrow’s Digital InfrastructureAmy SpellmannThe 451 Groupamy.spellmann@the451group.comRichard GimarcCA Technologiesrichard.gimarc@ca.comCapacity planning has been a well-established practice for over 30 years. During thattime, the tools, techniques and processes have been defined and refined. However, ourtraditional approach cannot keep pace with today’s rapidly changing environments; weneed to revolutionize the practice of capacity planning.This paper will examine the current scope and focus of capacity planning and propose aninnovative methodology to evaluate, predict and plan for the all-inclusive DigitalInfrastructure. It is no longer sufficient to utilize yesterday’s outmoded approach whenplanning for tomorrow’s applications, systems and facilities infrastructures. We need torevolutionize the practice of capacity planning. This paper identifies the goals andchallenges of Digital Infrastructure capacity planning and defines a new approach thatadapts to tomorrow’s extraordinarily dynamic, diverse and expanding environments.1 The World Has ChangedCapacity planning has evolved over the past 30 years, adapting to the changing landscape of IT systemsand application architectures. However, the evolutionary process can no longer keep up with the rapidlyincreasing complexity, size and scope of today’s IT enterprises. The exponential transformation intechnology, applications and infrastructures is demanding today’s capacity planning practice to includethe entire Digital Infrastructure. Our use of the term Digital Infrastructure is important and intentionalsince it describes the breadth of today’s capacity planning world view: The 451 Group defines DigitalInfrastructure as encompassing the enterprise-wide computing environment and the data center;including business requirements, technology infrastructure, and facilities infrastructure [SPEL2012]. Thepractice of capacity planning must be revolutionized to embrace a methodology that keeps pace with therate of technological evolution, necessitating the inclusion of all components in the Digital Infrastructure.Traditional brick and mortar, mainframe and distributed systems no longer support the needs of today’sdynamic business environment. In today’s marketplace, businesses must be visionary and aggressive inproviding IT services. Keeping pace with clever competitors and innovative entrepreneurs has driven theneed for accelerated delivery of IT services to support business requirements more cost effectively thanever before. 2013 The 451 Group and CA Technologies. All rights reserved.
To make matters more complicated, IT services can now be constructed from a plethora of technologies and architectures which mustadjust to business requirements on demand; to the extreme of automated and dynamic resourceallocation. The sheer magnitude of compute devices has skyrocketed; from millions to billions. Application architectures comprised of the latest technology stacks, database and storage optionsare widespread. Ownership across the Digital Infrastructure now varies to the extreme; interconnectedcomponents can be delivered internally or in the cloud (e.g., SaaS, PaaS, IaaS, or XaaS); frommodular data centers to combinations of hosting options in various geographic locations.The factors above dramatically affect capacity, performance, and cost for IT Services. The revolutionaryapproach to capacity planning introduced in this paper must address any possible combination oftechnologies and delivery options.1.1Magnitude of ChangeIn Mani Chandy’s 1985 A. A. Michelson Award acceptance speech [CHAN1985] he predicted that “theprimary difference between problems of the year 2000 and those of today will be one of size”. Chandy’sprediction was looking forward from 1985 to 2000, a mere 15 years. When you look at today’s world youcan see the significance and effect of his prediction. Today’s capacity planners are responsible forenvironments that are close to 4 orders of magnitude larger than 1985.To elaborate further, let’s review briefly, “What has changed?”1. Complexity has increased along with the numbers Increasing number of components and the way they interact Heterogeneous components; we are not planning for millions of identical “things” but uniqueones Mobile application architectures are moving more of the processing load from the end userdevice back into the data center (reversal of the historical trend where desktops/laptops keptmost data and processing local)2. Ownership of components varies drastically, more and easier choices are available Many combinations of physical locations versus on premise Compute can happen anywhere: cloud, hybrid, public, private Commodity computing (hardware, software, applications) Converged infrastructure3. Global presence and inter-connectedness are requirements for most businesses today Multiple data centers, world-wide “The sun never sets”4. Facilities design choices and costs are now aligned to the all-inclusive Digital Infrastructure Data center capacity: space, power, cooling options Compute per kWh has doubled almost every year from the 1940’s through 2010 Adding facilities capacity costs M; the tendency is to overbuildPage 2 of 22
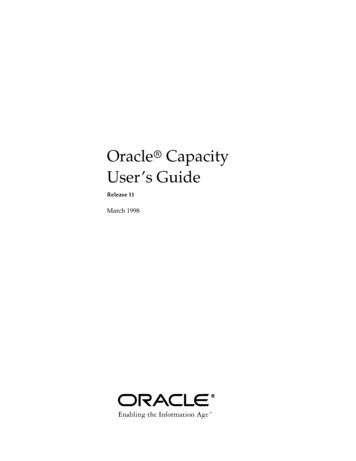
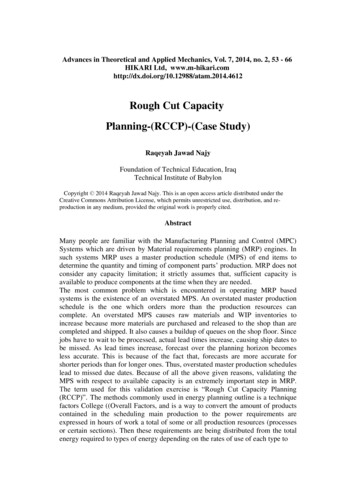
Taking all of these trends into consideration, we see the problem of capacity planning changing by atleast an order of magnitude. As Dijkstra was quoted by Chandy [CHAN1985], “When the size of aproblem changes by an order of magnitude, the problem itself changes.” We are looking at a newproblem! Thus we require a revolutionary solution.1.2A Brief History of Capacity PlanningCapacity planning started in the 1970s. At that time, capacity planners were responsible for a handful of“servers” (a.k.a. mainframes). A large amount of data was collected and analyzed (mostly SMF andRMF). Rudimentary modeling and forecasting was done to predict future infrastructure requirements.Between 1970 and today a number of things have changed: Capacity planners are now responsible for a wide variety of platforms. IT architectures have changed from a centralized platform to physically distributed servers. There is an ever expanding set of measurement data sources. Many tools are available for data collection, analysis and predictive modeling.Figure 1 shows a overview of the capacity planner’s changing landscape.Collect & analyze data from a fewsystems (mainframes)Creation of performance/capacitydatabasesRudimentary modeling & forecastingFew commercial productsAverage number of systems: 1-51960s & 70sIntroduction of client server (non-mainframesystems)Moderate explosion of the number ofcomponents in the infrastructure (servers,storage & network)Trade press predicts the death of themainframeAverage number of systems: 100s1980sCommercialization of capacity planning tools:- Performance/capacity databases- Modeling toolsFormalization of the capacity planning processStill mostly mainframesAverage number of systems: 5-101990sCloudExternal service providers andhosting solutionsHuge increase in the number ofnetworked devicesAverage number of systems:10k-100k2000s2010 The Web is realExplosion in the number of servers & otherinfrastructure componentsHuge increase in the number of distributed systemsAverage number of systems: 1,000sFigure 1. Capacity Planning Historical TimelineWhat can we learn from history? Capacity planners are now responsible for ever increasing, diverse,dispersed and interconnected environments. The single attribute that has most affected today’s DigitalInfrastructure is size; we are now dealing with hundreds of applications and thousands of servers.Capacity planners must find a way to deliver their services in a more comprehensive manner that spansthe breadth of the Digital Infrastructure, from high-level business drivers to the data centers that host theIT equipment.Page 3 of 22
1.3Why Traditional Methods No Longer SufficeWith the large amount of change in magnitude and complexity comes the realization that traditionalcapacity planning practices are insufficient and not sustainable. In general, all our methods have been“siloed” across the Digital Infrastructure: servers, storage, network and facilities. Each silo focuses ontheir narrow niche and ignores the holistic view of the enterprise infrastructure. In many companies, siloseven have secondary silos (e.g., Windows, Unix, zOS).The table below shows the common capacity planning areas (silos): Server, Storage, Network,Power/Space/Cooling (facilities) and Cost. The table lists the typical metrics and methods used forcapacity planning and their limitations.Metrics & MethodsLimitations- Platform level CPU utilization basedtrending, forecasting and modeling- Modeling used to predict andevaluate future infrastructurerequirements- Server-centric view of the enterprise;single OS instance per serverprevailed in the past, but virtualizationchanges the problem- Memory usage has become a popularsizing method over CPU- Difficult to apply to cloud instances- I/Os per second, space used (GB)and storage bandwidth. (MB/sec)- Trending and forecasting of storagespace utilized/free- Generally viewed in isolation- New technologies require moregranular tracking of applicationresources- Isolated network traffic, latency,bandwidth utilization- Traffic modeling used to predictlatency, network utilization andresponse time- Partial view of the world.- Generally ignores computebottlenecks- Service provider unknowns andgeographic limitations- Increased complexity, difficult to trackindividual applicationsPower, Space,Cooling- Space (sq. ft.), power (kWh) andcooling (BTUs) spreadsheetanalysis of electrical trends on anannual basis- Performed independently of ITcapacity planning- Relies primarily on current snapshot,not predictiveCost- IT costs (mostly CAPEX)- Facilities OPEX and CAPEX- Trending based on historicalgrowth, practices- Not comprehensive; siloed- Forces decision making based ontotal IT and facilities costs which arenot correlatedServer(CPU & Memory)StorageNetworkCurrent methods do not utilize information across silos. Cross-silo communication is required to develop acomprehensive capacity plan for the Digital Infrastructure. A new paradigm is required.Page 4 of 22
2 The New ParadigmWe previously defined capacity planning as follows [SPEL2008]:Capacity Planning is the process of predicting when future business demand will exceedthe availability of IT equipment, energy and space in the data center and thendetermining the most cost-effective way to meet SLAs and delay saturation.Based on today’s changing landscape we propose the following refinement:Capacity Planning is the process of predicting the impact of business demand on theavailability and scalability of IT equipment, space, power and cooling in the data centerand then determining the most cost-effective way to optimize service delivery and meetSLAs.Why did we change our definition? The quick answer is that in today’s environment we need to refocuson aligning our Digital Infrastructure to evolving business demands rather than just avoiding saturation.Both definitions share common characteristics: Create an environment that will meet and satisfy business demand Avoid saturationWe refined our 2008 definition to address optimizing the Digital Infrastructure to satisfy business demand.The previous definition was more concerned with avoiding saturation. However, today’s capacity plannermust look for ways to optimize the Digital Infrastructure based on increases or decreases in businessdemand.2.1Guiding PrinciplesThe reason traditional methods no longer meet the needs of the business is that the goals and scope forcapacity planning have changed. We are now driven by a new set of guiding principles: Cost effective IT service delivery Reduced infrastructure footprint More scalable management requirements Optimized infrastructure for business needs Reduced power, space, cooling requirements for facilities Holistic planning across the entire Digital Infrastructure Long term tracking of success/efficiency factors across the Digital InfrastructureThese guiding principles are aligned with our refined definition of capacity planning. The scope of today’scapacity planners has changed; they are now responsible for the entire Digital Infrastructure rather thanjust the IT equipment. Business demand and requirements are still the driving force. However, today’scapacity planners must be able to translate those requirements into a form that is more amenable andadaptable to diverse technology and hosting solutions. Furthermore, capacity planners must have a wayto track and demonstrate their long-term success.Page 5 of 22
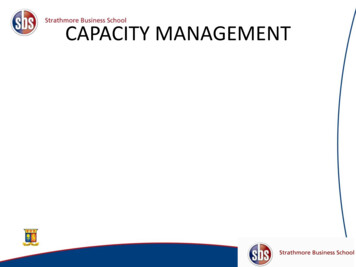
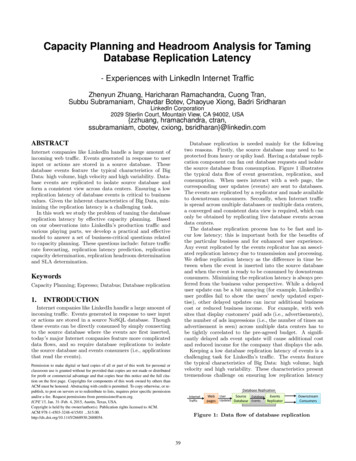
2.2What’s New and Revolutionary?In this paper we are introducing a new structured method for capacity planning. Our methodology isbased on the Capacity Planning Stack that incorporates all components in the Digital Infrastructure,organizing them into a cohesive and comprehensive planning paradigm. This new methodology has thefollowing characteristics: End-to-end view encompasses all components of the Digital InfrastructureoOrganized in a multi-level hierarchyoEach level corresponds to a portion of the Digital InfrastructureoThe hierarchy supports capacity planning workflow from the business to the data center(facilities)Organized workflow between the levels of the Capacity Planning StackoWell defined dependencies and workflow between stack levels (demand and feedback)oEfficiency metrics at each level used for long term tracking (measures of success)oUseful work products generated at each level of the stackoConceptually transparent and straightforwardIntegrated and inclusive capacity planoBusiness view of the costs of the supporting Digital InfrastructureoCost allocation across all components of the Digital Infrastructure3 The Capacity Planning StackWe propose to view capacity planning in terms of a stack. Within IT we are already familiar with anumber of stacks. For example, consider the following examples: Technology Stack - A set of software that provides the infrastructure for a computer. The stacksdiffer whether installed in a client or a server. [DICT2013] Solution Stack - An ordered collection of software that makes it possible to complete a particulartask. [TECH2013] OSI Model Stack - The Open Systems Interconnection (OSI) divides the complex task ofcomputer-to-computer communications into a series of stages known as layers. Layers in the OSIare ordered from lowest level to highest. Together, these layers comprise the OSI stack. Thestack contains seven layers: application, presentation, session, transport, network, data link andphysical. [WIKI2013]The Capacity Planning Stack consists of an ordered set of hierarchical tasks that must be performed todevelop a complete, viable and defensible capacity plan for the Digital Infrastructure. Our initial view ofthe Stack is illustrated in Figure 2.Page 6 of 22
Figure 2. The Capacity Planning StackBusinessCapacity planning always starts with the businesses it supports. It is assumed thateach business is supported by one or more applications. The business is responsiblefor providing usage estimates to the supporting application owners. Usage estimatesare usually expressed in terms of the business transaction volumes.ApplicationApplications are the business’ interface to the Digital Infrastructure. Applications aredesigned and developed to provide the IT services that support the business.Application-level capacity planners are focused on the efficient delivery of applicationsto the business. These planners are tasked with translating the higher level businessrequirements into IT resource requirements. This translation is done per application.Examples include back-office and customer facing applications which can be homegrown, legacy, COTS (commercial off the shelf), and SaaS. Outputs from theapplication capacity planners serve as input to two lower levels: shared servicerequirements and infrastructure requirements.Shared Service Shared services include the hardware and software components that support one ormore application. Examples include message queuing systems, message brokers,databases, Web server farms, or cloud services. The shared service planner’sresponsibility is to size their environment in order to support their upstream applicationusers. Application capacity planners provide the shared services planners with theirexpected demand on the shared components of the infrastructure. The sharedservices planners forward their infrastructure requirements to the next level in the Stack(infrastructure).InfrastructureThe infrastructure level contains the typical physical and virtual components included intraditional capacity planning; servers, memory, storage and network. Infrastructure canbe geographically dispersed, in the cloud or hosted on premise. The infrastructurecapacity planners utilize input from the application and shared services layers toPage 7 of 22
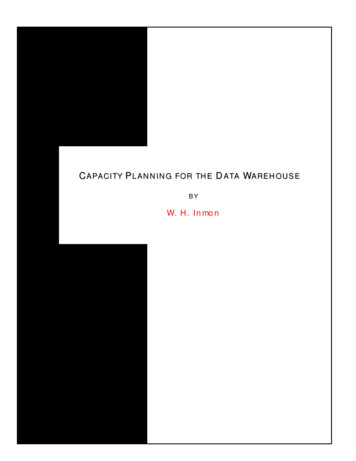
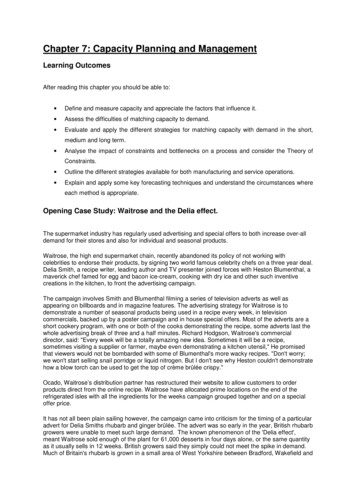
determine the most cost effective way to optimize service delivery and meet SLAs.Infrastructure space and power requirements for on premise physical components aresent to the facility level.Facilities3.1Facilities planners are responsible for ensuring that their data center can support therequired IT infrastructure from a space, power and cooling perspective. Their focus ison the efficient design, maintenance and operation of the data center. The primary taskof the facilities level is to plan for future IT infrastructure support, ensuring that the datacenter can provide adequate resources as IT evolves. The challenge for facilitiesplanners is adapting their timeline, which spans years, to the contrasting IT monthly (orless) horizon.Workflow – Capacity Planning StackThe previous section introduced the Capacity Planning Stack. This section will provide more detailsabout the workflow between the Stack levels and the work products produced as part of the capacityplanning process.A refined diagram of the Capacity Planning Stack is shown in Figure 3. The following additions havebeen made to the Stack diagram. Demand flows down the Stack. Business owners provide the application planners with theirexpected business volumes. The application planners translate business demand into resourcerequirements and pass them downstream to the infrastructure level. Additionally, if appropriate,the application plan determines the shared service requirements, in terms of transaction volumes,and provides this requirement to the shared service level (which in turn determines theassociated resource requirements and passes them down to the infrastructure level. This level-tolevel communication process continues throughout the Stack. The last demand flow is from theinfrastructure to the facilities level; this step is required to ensure that the data center can supportthe entire breadth and depth of the Digital Infrastructure. Feedback flows up the Stack. A feedback loop communicates requirement results back up theStack to ensure alignment to higher level plans, assist in future planning and potentially refineupstream estimates or designs. For example, the capacity plan developed by the applicationplanners determines an infrastructure solution and associated costs. This information is passedback to the business level for evaluation per the business plan. If, for example, the costs exceedbusiness budget, there may ensue negotiations between the levels. Another example to consideris at the bottom of the Stack. Suppose the infrastructure planners determine that they need 100more mid-range servers. What happens if the facilities planners estimate that there is insufficientpower or cooling capacity available in the data center to support the additional servers? Again,the feedback mechanism provides a means to convey this message back up the Stack.Optimization or a change in delivery option at any higher level can potentially alleviate a largefacility expense. Efficiency metrics at each Stack level. Each level in the Stack maintains their own set ofefficiency metrics to track long term trends. Efficiency metrics can be viewed as a “measure ofsuccess” or “report card” for each Stack level. For example, the application planners cangenerate a productivity measure for their application that describes the number of transactionsprocessed per unit of resource (similar to miles per gallon for an automobile) and/or reportperformance of transactions against SLA’s. Facilities planners would use PUE as one of theirefficiency metrics [TGG2007].Page 8 of 22
Business Transactions per DI DollarCloud 6789 10 11 12 13 14 15 16 17 18 19 20 21 22 23 24MonthBiz Trans per Month per DI DollarApp & SS Transactions per CPU FootprintOn Premise2018161412108642012345678910 11 12 13 14 15 16 17 18 19 20 21 22 23 24MonthApplication Transactions per CPU FootprintShared Services Transactions per CPU FootprintApp & SS Transactions per CPU FootprintOn Premise2018161412108642012345678910 11 12 13 14 15 16 17 18 19 20 21 22 23 24MonthApplication Transactions per CPU FootprintShared Services Transactions per CPU FootprintCPU Footprint: Available vs. UsedOn Premise3,0002,5002,0001,5001,0005000123456789 10 11 12 13 14 15 16 17 18 19 20 21 22 23 24MonthTotal CPU Footprint UsedTotal CPU Footprint AvailableEstimated Power Usage per Month (kWh)On 3456789 10 11 12 13 14 15 16 17 18 19 20 21 22 23 24MonthDatabasePower Used (kWh)Web AppPower Used (kWh)Power LimitFigure 3. Refined Capacity Planning StackPage 9 of 22
3.2Demand, Feedback & Efficiency MetricsIn this section we take a closer look at the demand, feedback and efficiency metrics that can be used ateach level of the Capacity Planning Stack. Figure 3 contains a summary of the interactions and workproducts produced by each level of the Stack. The following section will provide examples for each levelin the Stack.Demand Factors ( )Feedback ( )Efficiency Metrics ( )Business- Business volumetrics &priorities- Performancerequirements & SLAs- Total cost- Total time to satisfyrequirements- Expected performance- Business transactionsper Digital Infrastructuredollar- Total cost (cumulativefrom all lower levels)Application- Map Businessvolumetrics toapplication architecture- Estimates volume ofShared Service and/orInfrastructure requests- Estimates requiredApplication resourcefootprint and instances- Determines performancerequirements pertransaction- Cumulative cost from alllower levels- Application requirements(software licenses andhardware).- Expected performance.- Time to deploy,- Staffing requirements.- Transactions/minute perresource footprint- Cost per transaction ( )- Cumulative from lowerlevels- Performance (e.g.,response time) todemonstrate SLAachievementSharedServices- Map Shared Servicerequests to Infrastructurerequests- Estimates requiredShared Service resourcefootprint and instances- Determines performancerequirements- Cumulative cost from alllower levels- Shared Servicesrequirements (softwarelicenses and hardware).- Expected performance.- Time to deploy- Staffing requirements.- Transactions/minute perresource footprint- Cost per transaction ( )- Cumulative from lowerlevels- Performance (e.g.,response time) todemonstrate SLAachievementInfrastructure- Translate Application &Shared Service resourcefootprint and instancerequirements toInfrastructurerequirements- Determine physicalhardware requirements- Initiate procurementprocess- Evaluates expectedperformance, headroomand SLAs- Cumulative cost forinfrastructure andfacilities- Infrastructurerequirements (e.g.,servers, storage,network)- Time to procure & deploy- Count of IT components(servers, storage,network)- Processing capacity perIT component category- Headroom for each ITcomponent category- Cumulative cost ofInfrastructure andFacilitiesPage 10 of 22
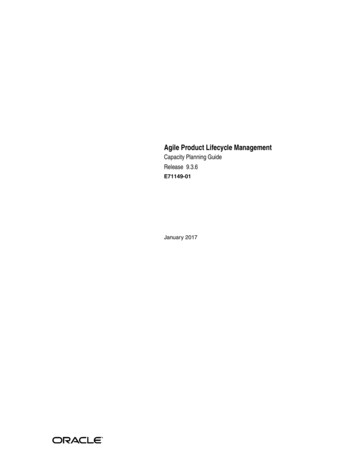
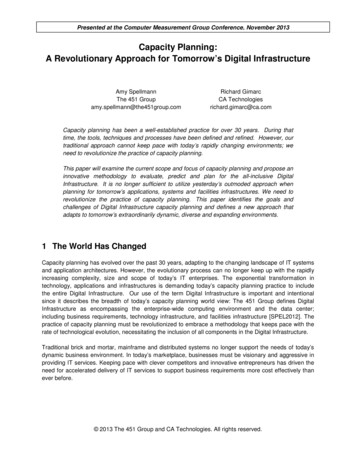
Demand Factors ( )Facilities- Estimate required space,power & cooling- Uptime SLArequirementsFeedback ( )- Cost for facilities- Data center facilitiesrequirements- Time to satisfy and/orbuild outEfficiency Metrics ( )- Power, cooling, spaceper IT Load- PUE- Facilities headroom- Total Cost (OPEX)Business. All capacity planning starts with the business; this does not change with the Stack. TheBusiness develops projections for future workload (either increasing or decreasing). These projections(Demand) are passed to the Application level where they are translated into more application-centricresource and demand metrics.The Application level provides feedback to the Business. Since the Business is at the top of the Stack,the feedback it receives is an aggregation of all lower levels. This feedback enables to Business to get acomprehensive view of what is required in the Digital Infrastructure to support their projected demand.The Capacity Planning Stack introduces the concept of an efficiency metric. The motivation is to provideeach level in the Stack with a way to track and measure their long-term success. A sample Businessefficiency metric is shown in Figure 4. This chart shows the number of business transaction that can beprocessed per Digital Infrastructure dollar over the 24-month planning horizon. The three dips in the chartcorrespond to new hardware purchases (new servers were required to satisfy the projected businessdemand). A couple of comments about this type of efficiency metric: If business volume is not changing, the line should be flat. If business volume is increasing, you should see an increase in the line until you reach the pointwhere a hardware upgrade is required. In that case, the Digital Infrastructure dollars spent for thenew hardware will cause a dip in the efficiency line.Business Transactios per DI DollarOn 89 10 11 12 13 14 15 16 17 18 19 20 21 22 23 24MonthBusiness Transactions per Month per Digital Infrastructure DollarFigure 4. Efficiency Metric - Business LevelPage 11 of 22
Application. The Application level is responsible for translating Business volumetrics into applicationcentric planning metrics. These planning metrics describe the resources required to satisfy the Businessdemand.Planning metrics should be described in a way that is portable across server platforms and architectures.As an example, consider CA’s Resource Score [ZINK2013]. Their Resource Score (Rx) is a platformindependent vector that describes CPU, memory, storage and network resource requirements for anapplication. If the Application planners can describe their resource requirements in terms of somethingsimilar to a Resource Score, then the Infrastructure team can use that sizing information to determine theappropriate platform for the application (e.g., physical server, VM, cloud instance). For this paper we willuse the terms resource footprint to describe an application’s infrastructure resource requirements.There are two demand factors that are generated by the Application planners and passed to lower levelsin the Stack: Shared Services demand – This is similar to the demand factors passed from the Business to theApplication. The difference is that these describe the Application’s expected demand on SharedServices such as message queuing systems or shared databases. Infrastructure demand – The Application level will deliver their resource and instancerequirements to the Infrastructure level. It will be their responsibility to evaluate hosting options.The efficiency metrics produced by the Application level enable long term trending of the resource and/orcost of their application implementation. An example is shown below in Figure 5. The chart shows thenumber of application transactions that can be processed per CPU footprint over a 24-month planninghorizon. In this example, the Application’s resource demand per transaction is not changing whichimplies that its resource footprint per transaction remains constant over the planning horizon. If anoptimization effort were undertaken to reduce the resource demand, you would expect to see the lineincrease (since you can do more work per CPU footprint). This efficiency chart also shows that you canprocess more Shared Services transactions than Application transactions per unit of CPU.App & SS Transactions per CPU FootprintOn Premise2018161412108642012345678910 11 12 13 14 15 16 17 18 19 20 21 22 23 24MonthApplication Transactions per CPU FootprintShared Services Transactions per CPU FootprintFigure 5. Efficiency Metrics - Application & Shared Services LevelsPage 12 of 22
Shared Service. The Shared Service level is very similar to the Application level. The primary differenceis that Shared Services receives their demand from the Application in terms of the number of requeststhat must be satisfied by their components (e.g., message queuing systems or shared databases).The Shared Service planning and efficiency metrics are similar to the Application level.The demand factors generated by Shared Services are forwarded to the Infrastructure level. AfterShared Services does their job, the Infrastructure level will have a complete set of demand factors fromthe higher level Application and Shared Services levels.Infrastructure. The Infrastructure level resembles many of today’s capacity planning groups. Theydetermine the IT infrastructure required to support Business demand. The primary difference with theCapacity Planning Stack is that all demand input to the Infrastructure goes through the intermediateApplication and Shared Services steps. The Stack is enforcing capacity planning based on applicationdemand.The Infrastructure level translates the resource/instance demands from the Application and SharedServices levels into actual servers. The target servers may be physical or virtual and hosted locally onpremise or in the cloud. Hosting decisions are made at the Infrastructure level ba
in this paper we are introducing a new structured method for capacity planning. our methodology is based on the capacity planning stack that incorporates all components in the digital infrastructure, organizing them into a cohesive and comprehensive planning paradigm. this new methodology has the following