Transcription
(Lab 6) Extraction of Caffeine: ranking various teas and coffees by drug contentIntroductionCaffeine is one of three legal, mind-altering drugs available in the U.S without a prescription. Twocommon sources of this drug are tea and coffee, both of which are prepared via extraction of the solidfoodstuff with liquid water. In this lab you will extract caffeine from food samples with liquid solventsand quantify the amount obtained.LaboratoryHypothesis:We can rank various tea and coffee samples by caffeine content by performing a solid-liquid extractionfrom the foodstuff, followed by analysis via thin-layer chromatography.Experiment:In a 50 mL Erlenmeyer flask were placed 2.0 g of black tea. Dichloromethane (15 mL) and 0.2 MNaOH (5 mL) were added successively, and the stoppered flask was swirled gently by hand for 10minutes (note: avoid vigorous shaking, as it will cause an emulsion to form). The dicloromethane layerwas separated from the leaves and the aqueous layer by vacuum filtration through 7 g Celite 545, andthe leaves were washed with a further 15 mL dichloromethane. The combined dichloromethanesolution was placed in a 50 mL round bottom flask and concentrated to a minimal volume (ca. 1 mL)via simple distillation. The remaining dichloromethane solutions was transferred to a watch glass viapipet, and the solvent was evaporated in a fume hood. The sample was evaluated by TLC (a mixture ofmethanol and ethyl acetate as the mobile phase, co-spotted with authentic caffeine).Data:What was your crude yield of caffeine? What was the mass percentage of caffeine in your food source?Given that the materials we are interested in are UV active, compared to the TLC standard how wouldyou characterize the purity of your caffeine extracts?Conclusions:Can you comment on the purity of your caffeine sample? For all samples your class worked with,where does your foodstuff rank in terms of caffeine content? How much caffeine is reported for theytypical serving of coffee or tea? How did your extraction and isolation compare?Source:J. Chem. Ed. 1996, 73, 556–557.
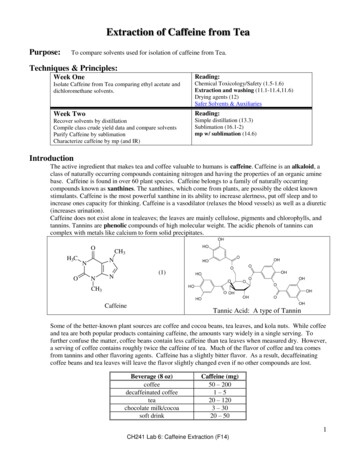
Lab 7 – Spectroscopy & Chemical DyesGoalCalculate the concentration of a dye in real time using sample’s extinction coefficient (ε)and λmax value, the Beer-Lambert Law, and a calibration curve.IntroductionThe field of spectroscopy involves the study of light and how it interacts with matter.You will take measurements of visible light (intensity and wavelength) and makeconclusions about samples of chemical dyes.When dealing with visible light, there are two parameters we will be curious about: “whatcolor is it?” and “how intense is it?” The color is correlated to wavelength (λ) of the lightand the intensity is usually called I.We will use an instrument called aspectrophotometer to measure these properties of light.The spectrophotometer will allow us to select the wavelength and intensity of light shoneupon our dye samples, and will also be able to measure the intensity of light emitted bythe sample. Comparing the intensity of the light before and after interacting with thesample is called measuring transmittance:!!!This is simply saying that transmittance is the intensity of the light passing through thesample (I) divided by the initial intensity of the light (I0). T will be a value between 0 and1, with the lowest values coming from samples that let little light pass, and the highestvalues from samples that let a lot of light through.! Chemists are more likely to talk about the absorbance than transmittance of a particularsample. The absorbance (A) is related to transmittance by the relationship:!!!Large values of A mean that the sample absorbed a lot of light, while small values of Ameans that your sample did not absorb much light at all. Absorbance is the measurementwe will be chiefly concerned about from our spectrophotometer.! logOne reason we care about absorbance so much is that it can give us an idea of theconcentration of a solution. The relevant equation is the ubiquitous Beer-Lambert Law:! ε!"In this presentation of Beer's Law, A is absorbance, ε is a physical constant for yourparticular sample called the “extinction coefficient,” l is the length of the sample (usuallya cuvette of length 1 cm), and c is the concentration of the sample. This means that onceyou measure the absorbance of a sample whose concentration you know, you cancalculate the extinction coefficient for your dye sample. Once we have an ε value for thedye, we can calculate unknown concentrations of samples based on their absorbance.
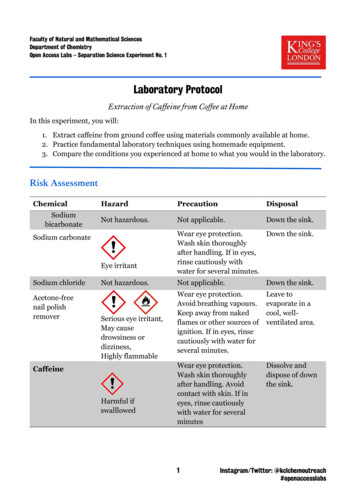
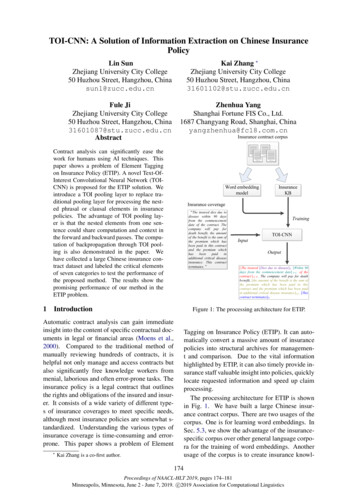
When we observe a large absorbance the concentration is high and if we observe a smallabsorbance the concentration is low.One other aspect of chemical reactions which you will study in this experiment is time.The duration of a reaction is often important when you're trying to make something new.For your chemical dye, you will study how fast it reacts with bleach. You will monitorabsorbance in real time and be able to observe how fast or slowly the colorful dye isconsumed.Laboratory WorkExperimentsDilutions: Your GSI will assign you two of four dye samples: erioglaucine, sunsetyellow, fast green, and/or allura red. The dyes will be supplied in solution at aconcentration of 0.01 M. You will need to perform dilutions of the stock solutions withdeionized water to obtain concentrations of:0.001 M0.0001M0.00001 M0.00008 M0.00005 M0.00003 MFor our purposes it is fine to use your 10 mL graduated cylinder to perform thesedilutions (rinse with deionized water). You may find the disposable glass vials handy forstoring your solutions, but remember to make it easy on yourself and label them clearly.Lambda Max: You will need to find the wavelength of light that your particular dyesabsorb most strongly, the λmax. To do this, using the Ocean Optics spectrophotometers,connect the instrument to the computer and power source. The light source takes 15min to warm up.Light PathwayDirectionUSBPortPower PlugNot for experimental usePortOpen the OceanView UV software. Wait a couple of seconds until the softwareconnects with the instrument. In the Welcome Screen, select “Quick View”.
Click on Create New Spectroscopic Application (upper left hand corner)Select Absorbance (concentration)Select Absorbance only, then click Next.
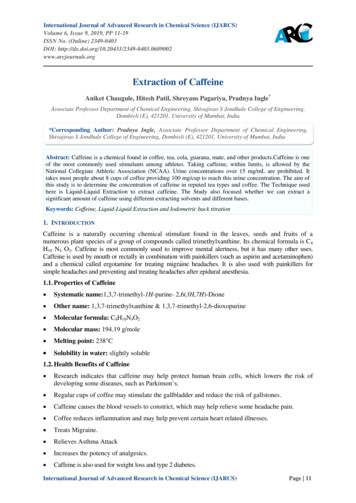
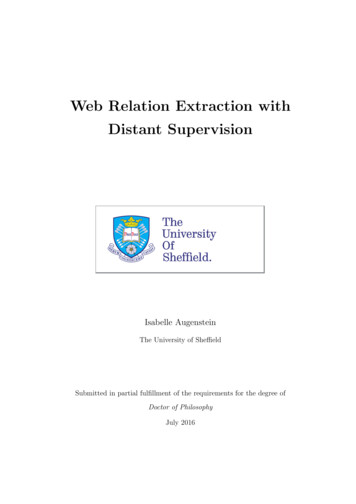
In the set up window, click “automatic” for integration time, check “strobe/lamp enable”.Under the light source panel, check “enabled” as well. It should look like the diagram onthe following page. To move on, click “Next”.IntegrationTime:ClickAutomatic (wait until the spectralintensity stops increasing)Scans to Average: 1Boxcar width: 0Electric Dark: Check markedTrigger Mode: ContinuousStrobe/ LampmarkedEnable:checkLight Source: VisibleLeave Intensity default number, donot changeInsert a DI water blank sample cuvette into the spectrophotometer. Always makesure the triangle is facing you for current light path length. The instrument scansthe reference spectrum automatically. Wait until the spectrum shows up in theupper Live Acquisition box, click the yellow Light Bulb icon Wait until thespectrum shows up in the Reference Spectrum Preview box, then click Next.This is what it should look like for your DI water:
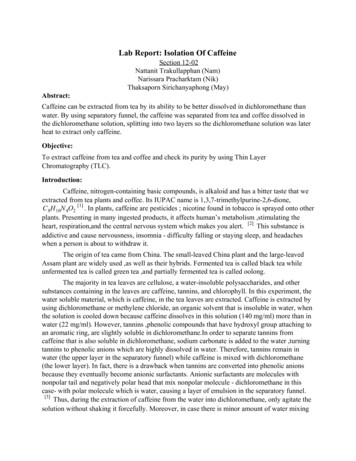
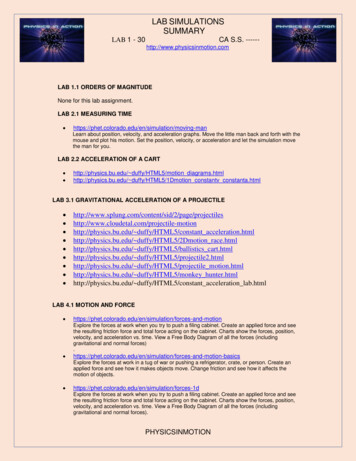
Remove the DI water cuvette, cover both holes of the spectrophotometer with yourhand, uncheck “Strobe/Lamp Enable”. You should hear a click indicating the shutter isclosed. Wait until the spectrum shows up in the upper Live Acquisition box, click thegrey Light Bulb icon Wait until the spectrum shows up in the Background SpectrumPreview box. This is what it the spectra should look like.Re-check mark the Strobe/ Lamp Enable box. You should hear a click indicating theshutter is open, then click Finish.Place a cuvette containing your 0.00001 M dye solution in the spectrophotometer. Thespectrum will read automatically, in real time. Record the observed absorbance for aseries of wavelengths from 400 to 700 nm in 20 nm increments.Determine the wavelength at which your sample displays the maximum absorbance. Thisvalue is called λmax and since it is characteristic of your dye, it is helpful for identificationpurposes.
Repeat the above process, and find a λmax value for your second dye sample. Change thewavelength parameter on your instrument to the respective λmax value for each dye for theremainder of your experiments with those materials.Extinction Coefficient: For at least one of your particular dye samples, record absorbancevalues for your dye samples for the series of concentrations 0.0001M, 0.00008 M,0.00005 M, 0.00003 M, and 0.00001 M at that dye’s λmax.Calculate ε for each of these measurements, and find an average value for ε.Calibration Curve: A plot of these absorbance vs. concentration data is called acalibration curve. It allows you to convert a measured absorbance into a calculatedconcentration using a linear best fit.Bleaching Dyes: For at least one of your particular dye samples, prepare a cuvettecontaining 1 mL at the concentration listed below. Add the noted amount andconcentration of bleach to the cuvette. Bleach is a 6% solution of sodium hypochlorite(NaOCl), so dilution may be necessary.Dye NameErioglaucine (blue 1)Sunset yellow (yellow 6)Fast green (green 3)Allura red (red 40)Concentration of DyeSolution0.00001 M0.0001 M0.0001 M0.001 MVolume and Concentrationof Bleach Solution1 drops of 6% NaOCl2 drops of 0.6% NaOCl1 mL of 6% NaOCl1 drop of 6% NaOClPlace the cuvette in the spectrophotometer and start a timer. Record the absorbance valueevery 10 seconds for the first 5 minutes and every 30 seconds after that for the next 15minutes (20 minutes total reaction time). Use your calibration curve to convertabsorbance to dye concentration at each time point.DataThe important data for this experiment are:-the absorbances observed at varying wavelengths for each dyethe absorbances observed at varying concentration for at least one dyethe absorbances observed at varying time as at least one dye is consumed bybleachConclusionsThe following plots should be included in your post-lab write-up:-your λmax plotyour calibration curveyour [dye] vs t plotWhat is the half-life for the bleaching reaction for your dye?
What is ε and how did you determine it in your experiment? Why is the extinctioncoefficient the same for each concentration of the same dye? What does the λmax youcalculated tell you about your dyes?What do you propose is the relationship between concentration and λmax for a given dye?What concentration of your dye (or dyes) remains at the end of each 20-minute bleachreaction?Post-lab AssignmentYou will write a short communication style manuscript for your post-lab assignment forthis experiment. This is a max of 3 formatted pages, and should summarize yourobjective, methods, data, and conclusions. Make sure to clearly answer each question inthe conclusions section above.For more words on how to write a communication style manuscript, see the AssignmentInformation at the beginning of this document.
(Lab 8) The equilibrium constant: calculating Kc for a reactionIntroductionAll chemical reactions are theoretically reversible. Furthermore, reactions do not necessarily go tocompletion. When a chemist asks the question “did this reaction proceed to completion?” perhaps abetter way to phrase this question would be “exactly how far towards completion did this reactionproceed?” If the amount of remaining starting material is too minuscule to detect, we say that a reactionproceeded to completion. But if we are able to detect an amount of remaining starting material once areaction has “finished” by reaching equilibrium, we can characterize a reaction in terms of just how farit has progressed.We will study a reaction between iron(III) ion and thiocyanate ion as they form a metal-anion complex:Fe3 (aq) SCN–(aq) FeSCN2 (aq)This reaction will not proceed to completion, though we can monitor how much product has formed viaspectroscopic measurement. In such cases we can calculate an amount of starting material remainingafter a reaction has reached equilibrium, and we can write a mathematical expression to express justhow much starting material and product exist in a steady state balance. We call that expression theequilibrium constant expression:[FeSCN 2 ] Kc[Fe3 ][SCN ]Generally, larger values of Kc indicate that the reaction has progressed significantly to the right, andsmaller values of Kc indicate that the reaction has not progressed substantially and that mostly startingmaterial remains. The value of Kc is constant at a given temperature. If we were to run this reactionmultiple times with the starting materials Fe3 and SCN–, the reactants will continue to combine toproduce FeSCN2 until the same value of Kc is reached every time. Your job is to calculate the value ofKc for this reaction at room temperature.LaboratoryHypothesis:We will combine solutions containing known concentrations of iron(III) nitrate, Fe(NO3)3, andpotassium thiocyanate, KSCN. If we can measure the amount of FeSCN2 product present atequilibrium, then we can calculate the amounts of both Fe3 and SCN– consumed, the amounts of Fe3 and SCN– remaining, and ultimately the value for the equilibrium constant Kc.Experiments:Remember to allow 30 minutes for your spectrophotometer to warm up on your bench whilepreparing solutions. Prepare a stock solution of 0.002 M Fe(NO3)3 in 1 M HNO3 and one of 0.002 MKSCN in water. Some things to keep in mind as you prepare these solutions: are these saltsanhydrous, or provided as a hydrate? What are their molar masses? Try to use only as much reactantas you will need: keep in mind you will only need ca. 25.0 mL of the Fe(NO3)3 solution and only ca.15.0 mL of the KSCN solution. How much total mass of each salt will you need to dispense? Is thisa practical amount to measure with a balance?
Prepare five solutions by according to the following proportions:Solution #1:Solution #2:Solution #3:Solution #4:Solution #5:5.0 mL 0.002 M Fe(NO3)3 in 1
(Lab 6) Extraction of Caffeine: ranking various teas and coffees by drug content Introduction Caffeine is one of three legal, mind-altering drugs available in the U.S without a prescription. Two common sources of this drug are tea and coffee, both of which are prepared via extraction of the solid foodstuff with liquid water. In this lab you will extract caffeine from food samples with liquid solvents