Transcription
Supplementary InformationA case of antiferrochirality in a liquid crystal phase of counter-rotatingstaircasesYa-xin Li1,2, , Hong-fei Gao3, Rui-bin Zhang2, Kutlwano Gabana4, Qing Chang3,Gillian A. Gehring4, Xiao-hong Cheng3,5*, Xiang-bing Zeng2* and Goran Ungar1,2*1. State Key Laboratory for Mechanical Behaviour of Materials, Shaanxi InternationalResearch Centre for Soft Matter, Xi’an Jiaotong University, Xi’an, 710049, P. R.China. Email: g.ungar@xjtu.edu.cn; g.ungar@sheffield.ac.uk2. Department of Materials Science and Engineering, University of Sheffield,Sheffield S1 3JD, UK. E-mail: x.zeng@sheffield.ac.uk3. Key Laboratory of Medicinal Chemistry from Natural Resources, Ministry ail:xhcheng@ynu.edu.cn4. Department of Physics and Astronomy, University of Sheffield, Sheffield E1 2C,UK.5. School of Chemistry and Chemical Engineering, Yangtze Normal University, Fuling,P. R. China. Present address: School of Chemistry and Chemical Engineering, HenanUniversity of Technology, Zhengzhou 450001, P.R. China.Table of ContentsSupplementary Information . 1Supplementary Section 1. DSC thermograms . 2Supplementary Section 2. Polarized optical microscopy (POM) . 2Supplementary Section 3. X-ray diffraction data . 4Supplementary Section 4. Second harmonic generation . 12Supplementary Section 5. Reconstruction of electron density maps . 13Supplementary Section 6. Estimate of the number of molecules per column stratum . 14Supplementary Section 7. Additional schematic models with ED maps . 16Supplementary Section 8. Additional AFM images . 18Supplementary Section 9. UV-vis and fluorescence emission spectroscopy . 20Supplementary Discussion 1. Minimum energy packing of helical columns . 21Supplementary Discussion 2: Comments on the number of molecules per column stratum . 25Supplementary Methods. Synthesis and analytical data . 27Supplementary References . 331
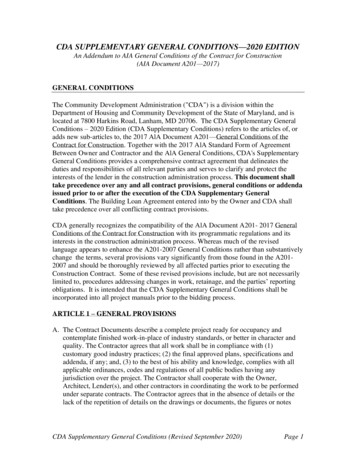
Supplementary Section 1. DSC thermogramsSupplementary Figure 1. DSC heat flow thermograms (exo down) of compounds FCN16and FO16 at heating and cooling scan rate of 10 K min-1.Supplementary Section 2. Polarized optical microscopy (POM)Supplementary Figure 2. POM of IC3/14 examined at a, b 70 ºC and c, d 40 ºC, at whichtemperatures the sample was in Col and Fddd phases, respectively. (b, d) are recorded witha full-wave (λ) plate.2
Supplementary Figure 3. POM of FCN16 examined at a, b 140 ºC and c, d 100 ºC, at whichtemperatures the sample was in Col and Fddd phases, respectively. (b, d) are recorded witha full-wave (λ) plate.Supplementary Figure 4. POM of FO16 examined at (a,b) 140 ºC and (c, d) 90 ºC, at whichtemperatures the sample was in Col and Fddd phases, respectively. (b, d) are recorded witha full-wave (λ) plate.3
Supplementary Section 3. X-ray diffraction dataIC3/12Supplementary Figure 5. a, GISAXS pattern and b, transmission powder WAXS curve ofFddd phase of IC3/12 recorded at 60 ºC. Fitted background has been subtracted separatelyfrom the inner (white) and outer (yellow) portions of the GISAXS pattern.Supplementary Table 1. Indices, experimental, calculated d-spacings, intensities, phasesand lattice parameters of diffraction peaks of IC3/12 recorded by transmission powder SAXSin the Fddd phase at 60 C. All intensities are Lorentz and multiplicity )(331)(440)(800)(531)(711)experimental dspacings (Å)45.243.337.231.726.4calculated dspacings .221.20.120.820.80.1a 173.5 Å, b 106.1 Å and c 40.8 ÅPhase0ππ0ππ-a: (511) and (620) diffraction peaks are overlapping in the powder diffraction pattern. Whiletheir total intensity is taken from the powder diffraction curve, the intensity ratio between thetwo has been determined from the GISAXS pattern. An azimuthal scan through the (511) and(620) diffraction peaks in the 2D GISAXS pattern is obtained first, and the intensities of thetwo diffraction peaks are measured from the areas of the diffraction peaks in the scan by fittingeach peak to a Gaussian function. Due to the sample geometry, equivalent to a fibre pattern(multiple domains sharing the same a-axis), measured intensities needed to be multiplied bythe corresponding qyz, i.e. q vector component which is perpendicular to the common a-axisof the domains. For (511) and (620) these are q(011) and q(020) respectively. Further correctionby diffraction peak multiplicity leads to an intensity ratio I(511) : I(620) of 63:37.4
Supplementary Table 2. Reflection conditions and space groups.Reflection conditionshklh k, h l,k lh0lhk00klklh 4nk 4nl 4nFd2dh 4nk 4nl 4nFdd2k, lh 4nk 4nl 4nF2ddk l 4n; k, lh 4nk 4nl 4nFdddk lh, lh k 4n; h, kk l 4n; k, lk l 4n; k, lh k 4n; h, kh k 4n; h, k00lhh kh, k0k0F222,Fmm2,Fm2m,F2mm,Fmmm,h lh l 4n; h, lh l 4n; h, lh l 4n; h, lh00Spacegroup* h k means the value of h k is even; h, k and l means the values are even.IC3/14Supplementary Figure 6. a, Powder SAXS curve and b, GISAXS pattern of Fddd phase ofIC3/14 recorded at 60 C (cooled from 80 C). The black circled spots are (511) from theother orientation. More details of the other orientation can be seen in Supplementary Figure10. As the d-spacings of (620) and (511/131) are close with each other, it is shown in onepeak in powder SAXS. The separated and fitted peaks are displayed in the figure.5
Supplementary Table 3. Indices, experimental, calculated d-spacings, intensities, phasesand lattice parameters of diffraction peaks of IC3/14 recorded by transmission powder SAXSin the Fddd phase at 60 C (cooled from 80 C). All the intensities are Lorentz andmultiplicity corrected.(hkl)experimental dspacings (Å)calculated 00)(440)(711)c(531)26.823.421.9a 186.8 Å, b 107.8 Å and c 40.8 Åa: As (400) is on the meridian of the GISAXS pattern, its intensity cannot be accuratelydetermined (sensitive to incident beam angle and distribution of domain orientations),consequently it is not possible to determine the (400) and (220) intensity ratio in the sameway as described before for (511) and (620) peaks of IC3/12. It is assumed that the ratio ofthe two is the same as that of two in powder SAXS of IC3/12. Similar treatment is used tocalculate the intensities of (800) and (440).b: The ratio of the intensities of (511) and (131) from the GISAXS pattern can be calculatedto be 0.85:0.15.c: As the intensities of (711) and (531) are too weak to be observed in GISAXS pattern, thecontribution of them in powder SAXS is assumed to be the same as in IC3/12.6
FCN16Supplementary Figure 7. SAXS/WAXS heating and cooling scans of FCN16.Supplementary Figure 8. a, Powder SAXS curve and b, GISAXS pattern of Col phase ofFCN16 recorded at 130 C (cooled from 150 C). In SAXS curve, the intensity of (20) is tooweak to be observed, as indicated by the arrow.7
Supplementary Table 4. Indices, experimental, calculated d-spacings, intensities, phasesand lattice parameters of diffraction peaks of FCN16 recorded by transmission powderSAXS in the Col phase at 130 C (cooled from 150 C). All the intensities are Lorentz andmultiplicity corrected.(hk)(10)(11)(20)experimental dspacings (Å)46.927.1-calculated dspacings (Å)46.927.123.4a 54.1 ÅIntensityPhase100.00.03-00-Supplementary Figure 9. a, b The GISAXS pattern of Fddd phase of FCN16 recorded at120 C (cooled from 150 C). In b, some hkl spots are circled blue and connected to theirhk0 base by blue row lines. The position of the projection of reflection (hkl) rotating around(110) on the 2D plane is calculated byℎ2( 𝑎2 𝑙2𝑏28 𝑙2𝑐2ℎ𝑘ℎ𝑘𝑎𝑏𝑎2 𝑏2( 2 2 )22 2 𝑎1 𝑏1 , 𝑎 1 𝑏 1 ). 22
Supplementary Table 5. Indices, experimental, calculated d-spacings, intensities, phasesand lattice parameters of diffraction peaks of FCN16 recorded by transmission powderSAXS in the Fddd phase at 120 C (cooled from 160 C). All the intensities are Lorentz andmultiplicity corrected.(hkl)aexperimental dspacings (Å)calculated dspacings 8.318.30.20.2-(111)(311)(620)(511)(131)(331)a 186.9 Å, b 107.9 Å and c 34.9 Åa: The calculation of the contribution of each reflection (hkl) to overlapped peaks in powderdiffraction pattern was the same as in IC3/12 and IC3/14.FO16Supplementary Figure 10. SAXS/WAXS heating and cooling scans of FO16.9
Supplementary Figure 11. a, Powder SAXS curve and b, GISAXS pattern of Col phase ofFO16 recorded at 135 and 130 C, respectively (cooled from 150 C).Supplementary Table 6. Indices, experimental, calculated d-spacings, intensities, phasesand lattice parameters of diffraction peaks of FO16 recorded by transmission powder SAXSin the Col phase at 135 C (cooled from 150 C). All the intensities are Lorentz and multiplicitycorrected.(hk)(10)(11)(20)experimental dspacings (Å)46.727.023.4calculated dspacings (Å)46.727.023.3a 53.9 ÅIntensity1000.20.1Phase00πSupplementary Figure 12. a, Powder SAXS curve and b, GISAXS pattern of Fddd phase ofFO16 recorded at 105 C (cooled from 150 C). The white circled spots are (511), (331) and(71̅1) from the other orientation.10
Supplementary Table 7. Indices, experimental, calculated d-spacings, intensities, phasesand lattice parameters of diffraction peaks of FO16 recorded by transmission powder SAXSin the Fddd phase at 105 C (cooled from 150 C). All the intensities are Lorentz andmultiplicity corrected.(hkl)aexperimental dspacings (Å)calculated 00.70.40.10.1a 186.0 Å, b 107.4 Å and c 32.5 Åa: The calculation of the contribution of each reflection (hkl) to overlapped peaks in thepowder diffraction pattern was the same as in IC3/12 and IC3/14.Supplementary Figure 13. GIWAXS/GISAXS patterns of a Col and b Fddd of FO16recorded at 115 C and 90 C, respectively.11
IC3/nFCN16/FO16Supplementary Figure 14. Two alternative settings of the Fddd unit cell with all symmetryelements marked (from International Tables of Crystallography, Vol. A). The locations ofcolumns are indicated with green circles: for the triangular twisted columns of IC3/12 andIC3/12 on 21 screw axes (left) and the ribbon-like twisted columns of FCN16 and FO16 ontwo-fold rotation axes (right).Supplementary Section 4. Second harmonic generationSupplementary Figure 15. Temperature dependence of intensity of the second harmonic(400 nm) vs. background for 800 nm excitation, generated 20 μm above the substrate surfacein (a) IC3/12 and (b) IC3/14 recorded on heating. The residual SHG ratio of ca. 1.3 is due tosurface effects – for more details see ref. 1. DSC curves are shown above to indicate thephase transitions.12
Supplementary Section 5. Reconstruction of electron density mapsStarting with IC3/12, its six strongest peaks (220), (400), (131), (511), (620) and (440) inSupplementary Table 1 are used to reconstruct the electron density (ED) map of the low-Tphase based on Fddd symmetry. As Fddd is centrosymmetric, there are eight possible phasecombinations as the phase of each peak can be only 0 or π. Some of these phasecombinations are equivalent by simple shift of origin or full phase inversion. The structureshould be closely related to the Col phase of the bent-core IC3/n, judging by the negligible orsmall changes in position of the strongest diffraction peaks, POM texture, birefringence andtransition enthalpy. The triangular cross-section of the columns thus precludes their positionson two-fold rotation axes of the Fddd unit cell (see Supplementary Fig. 14), which means thatreflections (220) and (400) must have different phases. As the aromatic column cores havehigher ED than the surrounding aliphatic continuum, the only remaining choices is 0 for (220)and π for (400). In contrast, the linear molecules of the FCNn compounds should be parallelto each other in a column stratum and their symmetrical nature implies that the columns havetwo-fold rotational symmetry. Therefore they lie along the 2-fold axes of the unit cell, as shownin Supplementary Fig. 14, meaning that the phase choice of reflections (220) and (400) mustbe π, π. The phases of other, weaker reflections is determined by trial and error with the maincriterion being the match with the model of rotating strata at every z-level, as shown inSupplementary Figs. 17-18. A powerful endorsement of the choice is the match with the AFMimages of the counter-rotating helices in Fig. 3j.Supplementary Fig. 16 below show the 2D ED maps of the high-temperature columnar phase:hexagonal for FCN16 and FO16 and trigonal for IC3/12 (see also ref. 1).Supplementary Figure 16. ED maps of Col phases of a FCN16, b FO16 and c IC3/121.13
Supplementary Section 6. Estimate of the number of molecules per column stratumSupplementary Table 8. Calculation of number of molecules per column stratum of Fdddand Col phases based on density. The results are independently verified by comparing theresulting molecular volumes with those calculated by the crystal increment method – seeSupplementary Table 7.9-107.4-c-40.8-40.8-34.9-32.5-4.54.54.54.54.63.5 (h)4.73.5 03.02.23.02.23.0Height ofcolumn stratumh’ or h (Å)aVolume ofcolumn stratumVstrat (Å3/103)bNumber ofmolecules perstratum ca: h’ is the average intermolecular distance along the column axis (or stratum thickness) forCol phase of all compounds, as well as for Fddd phase of IC3/n. By analogy with similarcompounds, h’ is estimated to be within 4.6 0.1 Å, with a minor adjustment up to 0.1 Åto make an integer. For Fddd phase of FCN16 and FO16, h is determined from theposition of the meridional streak in GIWAXS.b: Volume of a column stratum. Fddd: Vstrat abh/8 or abh’/8; Col: Vstrat a2h’ sin 60 .c: Number of molecules per column stratum is calculated from M/NAVstrat, where isdensity, M is molecular mass and NA is Avogadro’s number. Based on data on similarmaterials 0.9 g cm-3 is assumed. This choice is justified in detail in the Appendix at theend of this document.Supplementary Table 9. Comparison of molecular volumes calculated by crystal volumeincrements and density dd Col Fddd Col FdddColFddd ColVmol by crystalincrements (Å3/103)2.993.393.783.823.76bVmol from density3.133.47 3.47 3.77 3.73 4.004.003.95 3.93(Å3/103) ca: This table compares the molecular volume obtained independently by two differentmethods: (i) by crystal volume increments2, whereby an incremental increase in volumeby every atom is taken from an average of several hundreds or thousand of crystalstructures, and (ii) from Vstrat and values in Supplementary Table 8. The similarity of theobtained Vmol values provides further confidence in the numbers given in SupplementaryTable 8.b: Volume of the molecule: Vmol Varom Valiph; Varom volume of aromatic part of themolecule calculated using the crystal volume increments2; Valiph volume of aliphatic partof the molecule assuming a density of 0.8 g cm-3 (density of liquid alkanes). The volumeof the molecule in the next row is calculated by the density method and is shown forbetter comparison.c: Vmol Vstrat/ 14
Supplementary Table 10. Twist angles between strata in Fddd phase.CompoundNo. of strata per columnper unit cell: m c/h(’)Twist angles betweenstrataIC3/n: α 120 /mFCN16/FO16: α 180 .4Supplementary Table 11. Comparison of lattice parameters ratios for compounds in thiswork and block copolymers.Compound nameaBlock copolymers3IC3/12IC3/14FCN16FO16c:b:a0.500 : 1 : 30.385 : 1 : 1.6350.378 : 1 : 30.323 : 1 : 30.298 : 1 : 3a: Lattice parameter a is defined as the largest one.15
Supplementary Section 7. Additional schematic models with ED mapsSupplementary Figure 17. Detailed ED maps (high ED region) and sketched modelsviewing along c-axis with different layers of IC3/12 (see also videos 1.1-1.3).16
Supplementary Figure 18 Detailed ED maps (high ED region) and sketched modelsviewing along c-axis with different layers of FCN16 (see also videos 2.1-2.3).17
Supplementary Figure 19. Additional schematic Fddd models, comparing the singlenetwork model formed by block copolymers with the model of IC3/n.Supplementary Section 8. Additional AFM imagesSupplementary Figure 20. AFM of FCN16 in the Fddd phase at 50 C: a, b original phaseand height images; c, d corresponding Fourier filtered images. Inset in (b) shows the Fouriertransform of (b).18
Supplementary Figure 21. AFM of FCN16 in the Fddd phase at 50 C at highermagnification: a, b original phase and height images; c, d corresponding Fourier filteredimages; e, f scanned spectra along the two axes of (d).19
Supplementary Section 9. UV-vis and fluorescence emission spectroscopySupplementary Table 12. UV-vis and Fluorescence Emission Emissionλmax/nmbStokes shift(nm)FCN16Col209, 396, 6521.52 (130 C)--FCN16Fddd209, 412, 6967141.42 (120 C)1.35 (30 C)--FO16Col209, 316, 384,⁓5002.15 (110 C)625-633113-121211, 321, 396,2.13 (100 C)642-6461302.10 (40 C)⁓520a: Band-gap, based on the longest wavelength absorption, is calculated by the Tauc plotmethod4. The band-gap of FCN16 is smaller than that of FO16 due to the stronger electronaccepting ability of the fluoren-9-ylidene malononitrile group.b: λmax in Emission spectra.FO16Fddd20
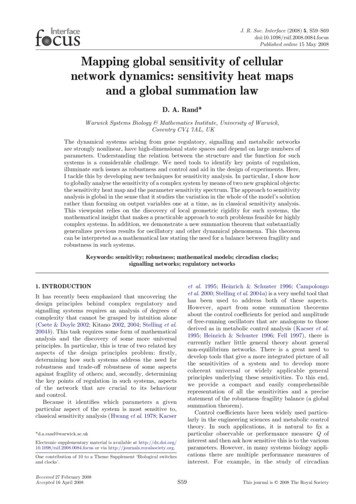
Supplementary Discussion 1. Minimum energy packing of helical columnsWe have developed a simple quantitative theory in order to examine the interactions andpackings of helical columns, and to explore their possible minimum energy structures. Thetheory suggests that the Fddd structure is indeed the minimum energy structure from packingof helical columns, among the different candidate structures we have explored. r12Supplementary Figure 22. (a-c) Different orientations of two dimers of straight core phasmidsin neighbouring columns result in different system energies. (a) Highest energy state due toheavy clashes between aliphatic chain ends of the dimers. (b) Medium energy state due toinefficient packing of space (voids between straight cores of the dimers). (c) Minimum energystate where the space is efficiently packed with little clashes between chain ends. Such energylandscape matches that from the interaction of two linear quadrupoles, with the orientations ofthe quadrupoles the same as those of the dimers (d-f). (g) The interaction energy betweentwo linear quadrupoles are linked to their distance r12 and their orientations as defined byangles 1 and 2.In FCN16 and FO16, the basic unit of the helical column is the dimer. In each stratum of thehelical column there are two molecules, with their straight cores parallel to each other and sixflexible aliphatic chains at each ends of the dimer core (Fig. 4d). As shown in SupplementaryFig. 22a-c, how efficiently the space is filled between two columns very much depends on theorientations of the dimers in two neighbouring columns. The interaction energy between thetwo dimers is high if they are pointing at each other as their chain ends would clash. There isless clash between two dimers if they are pointing away from each other (Supplementary Fig.22b), but the voids between the two dimers means inefficiency in space packing hence it ishigh energy too. The best packing of space is achieved when one dimer is pointing directly atthe other, while the other is pointed way (oriented perpendicular to the other), as inSupplementary Fig. 22c. Interestingly, such dependence of interaction energy between thedimers on their orientations is very much similar to that between two linear quadrupoles, asshown in Supplementary Figure 1d-f, the energy is highest when the two quadrupoles arepointing at each other, lowest when one of them points at another, while the other pointsperpendicularly away.The interaction energy between two quadrupoles, with quadrupole moment 𝜙 3𝑞𝑑2 (q is thepartial charge at the ends and d is the length of the quadrupole, as shown in SupplementaryFig. 22d), is𝐸𝜙 𝜙 𝐴𝜙25𝑟12Where r12 is the distance between the two quadruples and A is the factor linked to theorientations of the two quadrupoles. In our case the two quadrupoles are in the same planeand their orientations are defined by two angles 𝛽1 and 𝛽2 (Supplementary Fig. 22g)5.𝐴 3 cos(2𝛽1 2𝛽2 ) 915159cos 2𝛽1 cos 2𝛽2 cos 2𝛽1 cos 2𝛽2 1616161621
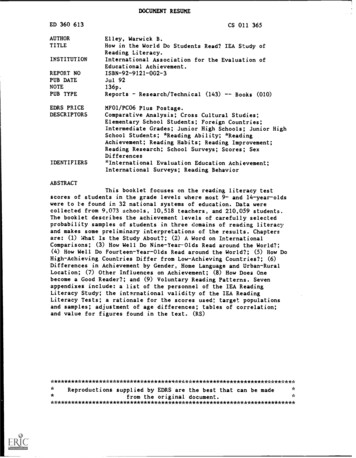
The minimum values of A is found with 𝛽1 0 and 𝛽2 𝜋/2 (or 𝛽1 𝜋/2 and 𝛽2 0), with𝐴𝑚𝑖𝑛 3. The maximum value of A is found with 𝛽1 𝛽2 0, with 𝐴𝑚𝑎𝑥 6. For randomarrangement of 𝛽1 and 𝛽2 , the averaged A is 𝐴𝑎𝑣𝑒 9/16.𝛼 𝛽2 𝛽1 𝜋/2𝛼 𝛽2 𝛽1 𝜋/2Supplementary Figure 23. (a, b) Side and projected views of minimum energy neighbouringco-rotating (a) and counter-rotating (b) helical columns. Twisting of dimers along the columnardirection (z-axis) is represented as a series of twisting linear quadrupoles. (c,d) The minimumenergy 1D array of helical columns, with nearest neighbours always co-rotating (c) or counterrotating (d). The rotating direction of each column is shown by yellow arrows, and theorientation of the quadrupole at z 0 is shown by the coloured rod at the centre. The interactionbetween two neighbouring co-rotating and counter-rotating helices depends on an angle 𝛼.For co-rotating helical columns 𝛼 𝛽2 𝛽1 , and for counter-rotating ones 𝛼 𝛽1 𝛽2 . Here𝛽1 and 𝛽2 define the orientations of the two quadrupoles, one from each column, at the samez-level. 𝛼 is a constant independent of z and defines the relative orientation of the two helicalcolumns.To calculate the interaction energy of two helical columns, each of which consists of a seriesof dimers represented by quadrupoles, with the direction of dimer/quadrupoles twisting alongits helical axis (Supplementary Fig. 23a,b), we make the assumption that the helix iscontinuous, and the interaction between the two helical columns is simply the average ofquadrupole interactions at different heights, i.e. we ignore the interactions between dimersfrom the two columns at different heights. This, even though much simplified, is in factequivalent to considering the average orientation of dimers/quadrupoles that are interactingwith a dimer/quadrupole from another column, and should carry the essence of suchinteraction between helical columns.If the two neighbouring columns are co-rotating, i.e. have the same hand, then at differentheight we always have 𝛼 𝛽2 𝛽1 being a constant (Supplementary Fig. 23a). When theheight z goes from 0 to p/2, where p is the helical pitch of the column, 𝛽1 changes from 0 to𝜋 and 𝛽2 changes from 𝛼 to 𝛼 𝜋. Average at different heights thus gives the interactionenergy per pair of dimers between co-rotating columns as𝑈𝑐𝑜2𝜙 2 𝑝/23𝜙 2(𝑧)𝑑𝑧 5 𝐴𝑐𝑜 5 (3 cos 2𝛼 6)𝑝𝑟12 032𝑟12If the two neighbouring columns are counter rotating instead, at different height 𝛼 𝛽1 𝛽2 isa constant (Supplementary Fig. 22b). When the height z goes from 0 to p/2, 𝛽1 changes from0 to 𝜋 and 𝛽2 changes from 𝛼 to 𝛼 𝜋. Average at different heights thus gives𝑈𝑐𝑜𝑢𝑛𝑡𝑒𝑟 2𝜙 25𝑝𝑟12𝑝/2 𝐴𝑐𝑜𝑢𝑛𝑡𝑒𝑟 (𝑧)𝑑𝑧 0223𝜙 2532𝑟12(35 cos 2𝛼 6)
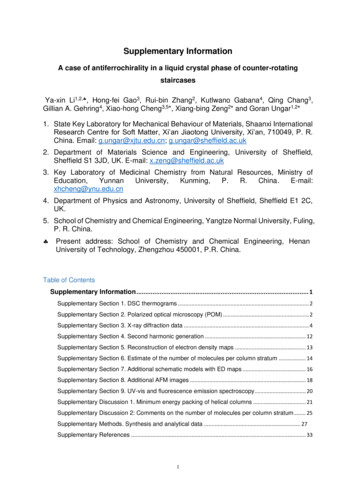
In both cases the energy minimum is given by 𝛼 𝜋/2, i.e. when at a particular height thedimer from one column is pointing at another column, while the dimer in the other column atthe same height is pointing perpendicularly away. It is also obvious from the calculation thatneighbouring counter-rotating helices is more favoured energetically comparing to co-rotatingones. Such behaviour is like that of two intermeshing cogwheels, where they rotate in oppositedirections so the teeth of each cogwheel always avoid direct clash with those of another.The minimum energy configuration of our helical columns can be readily derived in 1D, as allneighbouring columns can be counter rotating and with 𝛼 angle being 𝜋/2, as shown inSupplementary Fig. 23d. If all the columns have the same handedness hence co-rotating, the1D minimum energy configuration is shown in Supplementary Fig. 23c, again with all 𝛼 angles3𝜙2being 𝜋/2. Expressing the energy in the unit of 32𝑟5 , the minimum energy per dimer in a 1D12counter-rotating array is -29, that of the co-rotating array is 3, and for a random 1D array(without any z-correlation between columns) the energy per dimer is 6.Supplementary Figure 24. (a) Calculated minimum energy configuration on a 2D hexagonallattice, with two left- and two right-handed columns in a 2x2 hexagonal unit cell. The result isequivalent to the Fddd structure we have observed experimentally. (b) Calculated minimumenergy configuration on a 2D hexagonal lattice, with three left- and one right-handed columnsin a 2x2 hexagonal unit cell. (c) Calculated minimum energy configuration on a 2D hexagonallattice, with four right-handed columns in a 2x2 hexagonal unit cell. It turns out that verticalshifting of the second row of columns, in relation to the first row, does not change the systemenergy. (d) Calculated minimum energy configuration on a 2D hexagonal lattice, with two leftand one right-handed columns in a 3 3 hexagonal unit cell. The orientation of the righthanded (red) columns can be random without affecting the system energy.However, the condition to keep all neighbouring columns counter-rotating cannot be satisfiedon a 2D hexagonal lattice, as around each triangle in the lattice there are three columnsneighbouring to each other, and at least two of them must have the same hand. The obviouschoice to minimize the system energy is to keep as many counter-rotating neighbours for eachcolumn as possible. As shown in Supplementary Fig. 24a, a 2x2 periodic supercell is assumed,as both counter- and co-rotating minimum energy 1D columns have a repetition every twocolumns (with 𝛼 angle being 𝜋/2). We have two left-and two right-handed helical columns inthe unit cell, and each column has four counter rotating and two co-rotating neighbouringcolumns (a ratio of 2:1). It is also not possible to make all rows of co-rotating and counterrotating columns to have 𝛼 angles of 𝜋/2. Energy minimization shows that all co-rotating23
columns have 𝛼angles of 𝜋/2, and all counter-rotating columns have an 𝛼 angle of 5𝛼/123𝜙2(Supplementary Fig. 24a), with an average energy per dimer of about –45.6 (in unit of 32𝑟5 ,12Supplementary Table 13). The minimum energy configuration fits very well with ourexperimental observations (Fig. 4b in the main text).While the model shown in Supplementary Fig. 24a seems reasonable, we have also exploredother possible configurations on a 2D lattice and these are shown in Supplementary Fig. 24bd. In the configuration in Supplementary Fig. 24b, we have again a 2x2 superlattice, but withthree left-handed and one right-handed columns. While around a right-handed column, all itssix neighbouring columns are counter-rotating, for the left-handed columns, four of itsneighbouring columns are co-rotating and the other two are counter-rotating. Overall the ratiobetween counter-rotating neighbours to co-rotating ones is 1:1. While the 𝛼 angles betweencounter-rotating columns are 𝜋/2, the 𝛼 angles between co-rotating columns are 𝜋/3. Due tothe reduced number of neighbouring counter-rotating columns, it is no surprise that thisstructure turns out to have a higher energy than our Fddd structure (-36.75 vs -46.5 per dimerin unit of3𝜙25 ,32𝑟12Supplementary Table 13).When all columns have the same handedness, as shown in Supplementary Fig. 24c, theenergy is found to be much higher (15 in unit of3𝜙25 ).32𝑟12There are also many equivalentminimum energy configurations. While row 1 and row 2, as shown in Supplementary Figure3e, have 𝛼 angles of 𝜋/2, the system energy will not be affected by a change in the relativeangles (or equivalent shift of the rows in the z-direction) between the two rows.The other configuration we have studied is shown in Supplementary Fig. 24d, a three-columnsuper-lattice structure similar to that proposed for the so-called “ordered columnar hexagonal”phase found in temperatures below the normal discotic columnar hexagonal phase in Hexahexylthiotriphenylene (HHTT)6. It has three columns in its unit cell, two left-handed and oneright handed. In its calculated minimum energy configuration, all neighbouring co-rotatingcolumns have 𝛼 angle of 𝜋/2 . The system energy, however, does not depend on theorientation of the right-handed columns at all. The calculated energy turns out to be exactlythe same as that of the previous model but much worse than the first two, where rows ofcounter-rotating columns have been better preserved.In summary, our theore
and FO16 at heating and cooling scan rate of 10 K min-1. Supplementary Section 2. Polarized optical microscopy (POM) Supplementary Figure 2. POM of IC3/14 examined at a, b 70 ºC and c, d 40 ºC, at which temperatures the sample was in Col and Fddd phases, respectively. (b, d) are recorded with a full-wave (λ) plate.