Transcription
MATRIX QUERIES AND MATRIX DATAREPRESENTATIONS IN NVIVO 12 PLUSNVivo Advanced(Updated)
OVERVIEW1. Matrices and their basic structures2. Types of elements (variables) for matrix comparisons3. Setting up matrix queries in NVivo 12 Plus4. Specific matrix “use cases” in qualitative, quantitative, and mixed methodsresearch5. Wrap-up2
IF MULTILINGUAL SELECTION OF A BASELANGUAGE (“TEXT CONTENT LANGUAGE”)Go with default (determinedby QSR International basedon purchaser location in theworld)ORNVivo ribbon - File tab - Info - Project Properties - General (sub) tab - Textcontent language (dropdownmenu)3
1. MATRICES AND THEIRBASIC STRUCTURES4
DEFINITION(S) AND PURPOSESGeneral PurposesStructureMatrices are used to explore and showdata relationships and patterns“a rectangular array of quantities orexpressions in rows and columns that istreated as a single entity and manipulatedaccording to particular rules” (in amathematics sense; in a computer science /information technology sense) (per Googlesearch engine) In NVivo, any defined element may be used topopulate the respective matrices NVivo uses (intensity) matrices to report out onsentiment analysis autocoding findings NVivo 12 Plus uses (intensity) matrices to reportout on theme and subtheme autocoding findingsa complex of lines intersecting at rightangles (via rows and columns)5
MATRICES ARE ABOUT RELATIONSHIPSTypes of Common Relationships found in Matrices: hierarchical such as general to specific, topic to subtopic,within the set of, part of a type, contained within, found withinincluded with, co-occurring with,associated with (some relationship but not fully defined)appearing in close proximity with,similar to, related by likenessdifferent from (orthogonally unrelated)6
MATRICES ARE ABOUT RELATIONSHIPS(CONT.)For example, some relationships described by matrices include: Which source documents (articles) are related to particular themes? Which themes and subthemes are related to which documents? Which terms from text sets are related to the four sentiment categories (very negative, moderatelynegative, moderately positive, and very positive)? What are similarities and dissimilarities between the coding of two coders (in a dyadic comparison in acoding comparison)? What are macro themes in a coding structure or codebook (through a matrix coding query)?7
TYPES OF MATRICESMatrices are referred to by their application (matrix type), which includes the typesof data and the analytical uses of that data Confusion matrix / contingency table or cross-tabulation analysis / error matrix (predicted values vs.actual empirical values) These are sometimes used to highlight the differences between Type I and Type II errors in basic signals detection Effects matrix Sentiment analysis intensity matrix (a temperature matrix, to a color-saturation heatmap but inmatrix format or with intensity indicated by number) Relational or network matrices (for relationships), and othersMatrices are generically referred to sometimes by the numbers of their elements intheir rows and columns (as in a 5 x 7 matrix, or a 2 x 2 matrix)8
TYPES OF MATRICES(CONT.)Specific topical matrices are referred to by their main contents (one content typealong its column headers and the other along its rows) For example: type-by-document matrices, document-by-theme matrices, and others9
GENERAL FEATURESMatrices do not have to be symmetrical in terms of the labels on Column A1 and Row1A (in the next diagram)The numbers of entities (column and row headers) in the rows and columns do nothave to match; they do not have to pair either (but may depending on the type ofmatrix) Data may be incomplete, and matrices still have informational value (they are robust even in thecondition of missing data)Tables tend to be more structured, with unique records on each row (runninghorizontally) and variables at the top of each column (running vertically)Matrices may be automatically extracted (by computer); they may be manuallycreated10
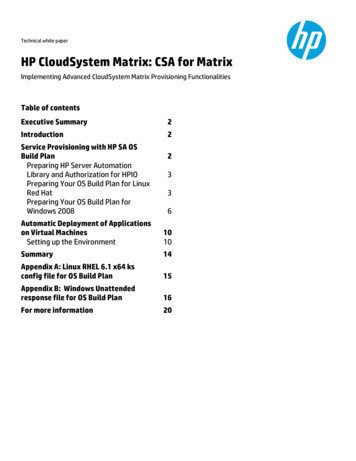
BASIC STRUCTUREMatrix Variables (Columns)A1Matrix Variables (Rows)Data Cells11
MATRIX INDICATORS(W/ DEFINED ROW AND COLUMN LABELS/HEADERS)Variables may be Of a similar kind or type (in the matrix): all nodes / case nodes (individuals to individuals, ororganizations to organizations) / codes; all interviews (in various groupings); all (cross-referenced)responses to questions, etc. Of mixed kinds or types (across rows and columns, not within the cells): themes and researchdocuments; physical locations and interview subjects; themes (terms) and interviews; themes (concepts)and categorical outcomes; individuals and organizations; time periods and themes; sources in NVivo(sources, memos, codes, transcripts, interviews, and others)In the data cells Presence or non-presence of a relationship (1 or 0; a binary finding) Frequency of occurrence of relationship; “strength” of relationship (may be turned into a networkgraph); intensity Contents of matrix variable overlap in text (content) format; coded text12
MATRIX CELLSCells come at the intersection of respective column headers and rows (individualrecords)Matrices may be labeled “sparse” if there are more cells with 0s than with nonzeroes (whether in binary matrices or strength-of-relationship matrices)13
IN QUALITATIVE AND MIXED METHODSRESEARCH, MATRICES Are word- or text-based; may include a quantitative aspect (usually frequency countsas an indicator of relationship strength) Text may be “raw” (primary source data; transcripts) or highly processed (edited research articles)Are based on variables (nodes, themes, interviewee / survey taker / focus groupparticipant demographics and “characteristics” for grouping, and others)May be used at various scales: the micro- (cell-level), meso- (relational, dyadic,triadic / motif ), and macro- (matrix-scale pattern)May be designed (1) based on a targeted question, (2) based on the need to surfaceleads for further exploration (such as a “text summarization” application), (3) basedon pure exploratory discoveryMay contain single or multiple queries14
2. TYPES OF ELEMENTS (VARIABLES)FOR MATRIX COMPARISONS15
VARIABLES FOR MATRIX COMPARISONSIN NVIVO 12 PLUSAny text (at the most atomistic level)Any attributes or variablesAny groups of text or multimediarepresented by text descriptors (foldersof contents)Any categorical variablesAny codes (nodes, case nodes)Any groups of nodesAny “coded by” set (of codes / nodes) Such as indicated by classification sheetsAny relationshipsAny modelsAny model items Coder-based comparisons16
THE RESEARCH PROCESSGeneral OverviewPossible Matrix ApplicationsLiterature reviewText summarization (themes and documents)Research designRelevant document identification (for close reading)in a literature reviewResearch instrument prototyping and design (oracquisition) and pilot testingSamplingPattern identification in interviews, surveys, notes,and codesResearchData visualization as relational network graphs (foranalysis, for presentation)Data collection and othersData cleaningData analysisWrite-up and presentation17
SOME TYPES OF “ASKABLE” QUESTIONSWITH MATRICESAre there instances of particular text in particular “searchable” documents (.PDF, .txt,.rtf, .doc, .docx, etc.)?Are there locational or spatial patterns in (textual) data?Are there temporal patterns in (textual) data?Are there topical or theme patterns in (textual) data?Are there similarities / differences between responses of individuals from differentdemographic or categorical or spatial or other groupings? (from interview, survey,focus group, or other similar types of data)Are there relationships between concepts? Individual entities? Group entities?18
3. SETTING UP MATRIX QUERIESIN NVIVO19
DATA INGESTION IN PROPER FORMSSizes of ContentsAll text ingested atomistically (the lowest indivisible “unit of analysis” or “record” ormulti-media-based “object” such as an article or a memo) If a series of articles are all created as one text set, generally, the text set will be queried as onedocument (instead of a series of articles in a text corpus)Accessible Machine-Readable TextAll scanned text as “searchable” or optical character recognition (OCR) textAll video transcribed into machine-readable textAll audio transcribed into machine-readable textAll imagery alt-texted into machine-readable text20
DATA PREPARATIONGeneral in NVivoSpecific in NVivoAll relevant research materials included andcoded; clear data labeling, consistentnaming protocolsCombined master file of group codedprojects, with multiple user codedcontents (for runs of interrater reliability)Various types of groupings (by folder, bynode, by nickname, by classification variable,and others), without creating dataredundancy (which skews text queries andtext frequency counts and other types ofanalyses); may delete redundant text fordata queries or create new (sub) NVivoprojects with select data for particular dataqueriesRelationships defined and linkedCase node source classifications appliedModels createdGoal: all data fully exploited in clear ways21
PATHS USED TO CONDUCT DATA QUERIESRESULTING IN DATA MATRICESNVivo ribbon - Query tab - Matrix CodingNVivo ribbon - Query tab - Coding ComparisonNVivo ribbon - Query tab - Group Query (models, relationships, attributes, codingat)( to live and interactive demos)22
QUERIES FOLDER STORAGEMatrix queries are storedin the Queries folder (unless saved elsewhereby the researcher)23
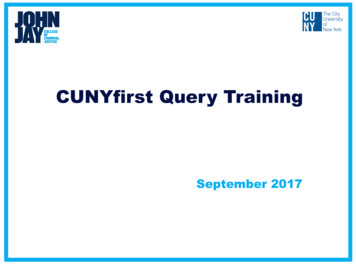
RELATED DATA VISUALIZATION: MATRIX “CHART”24
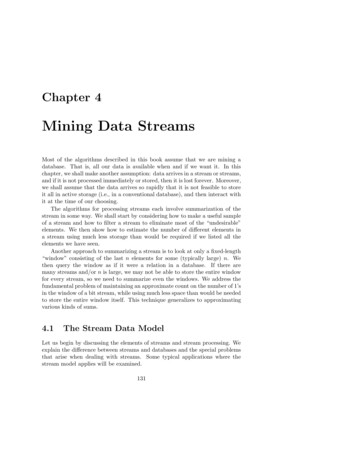
A RELATIONAL MATRIX TO A NETWORK GRAPH(READ ACROSS)AABCDEFGHIBCDEFGHI----------25
A RELATIONAL MATRIX TO A NETWORK GRAPH(CONT.)Node-link diagram (vertex-relationship diagram)26
PATHS USED TO CONDUCT AUTO CODING RESULTING ININTENSITY DATA MATRICES (IN NVIVO 12 PLUS)Theme and subtheme extraction / topic modeling Highlight source. (You can use CTRL A to select all in a folder.)In ribbon, select Analyze tab. Click Auto Code Button.Select “Identify themes ”Proceed with the Auto Code Wizard Sentiment extraction Highlight source. (You can use CTRL A to select all in a folder.)In ribbon, select Analyze tab. Click Auto Code Button.Select “Identify sentiment ”Proceed with the Auto Code Wizard 27
28
29
30
31
4. SPECIFIC MATRIX “USE CASES” In Qualitative and MixedMethods Research32
MACHINE-READING RESEARCH ARTICLES (OR OTHERTEXTS) FOR THEMES AND SUB-THEMES(TO SAVE ON HUMAN “CLOSE READING,” ESP. OF RELATIVELY “BIG DATA” CORPUSES USING AUTOCODING)Theme or Conceptor Phenomena orIndividual(keyword orphrase)Theme or Conceptor Phenomena orIndividualTheme or Conceptor Phenomena orIndividualTheme or Conceptor Phenomena orIndividualResearch article(or source) #1“““““33
COMPARING AND CONTRASTING RESEARCH SUBJECTRESPONSES BY CATEGORICAL GROUPINGSSexAge riable34
COMPARING AND CONTRASTING RESEARCH SUBJECTRESPONSES BY (CATEGORICAL) OUTCOMESOn-time GraduationLate le35
EXPLORING POTENTIAL LOCATIONAL OR SPATIALPATTERNSLocation #1Location #2Location #3Location #4Interview Subject#1 / or Nodes / or etc.#2#3 36
EXPLORING POTENTIAL TIME PATTERNS (LIKE CHANGESOVER TIME, LIKE PRE-POST EVENT TIME CHANGES)Time Period 1Time Period 2Time Period 3Time Period 4VariableVariableVariable 37
IDENTIFICATION OF OVERLAPS IN CODIFIEDTHEMES (MATRIX CODING QUERIES)NodeNodeNode NodeNodeNode 38
OUTLIER CASE COMPARISONSOutlier Case AOutlier Case Z39
COMPARING SENTIMENTS, EMOTIONS, ATTITUDES,AND BELIEFSSentimentsEmotionsAttitudesBeliefs Interviewee #1 40
CROSS-QUERY RESPONSE ANALYSIS(COMPARISONS AND CONTRASTS)Question 1ResponsesQuestion 2Responses41
COMPARING CHANGES ACROSS TIME PERIODS(TYPES OF TIME: DISCRETE, PERIODIC, CONTINUOUS; SHORT-TERM VS. LONGITUDINAL)Time Period #1Time Period #2 Variables of aType42
INTER-RATER RELIABILITY(SIMILARITY/DIFFERENCE ANALYSIS)Coder A CodingCoder B Coding43
AUTOMATED SENTIMENT ANALYSISPositiveVery veVery NegativeTweetstreamsInterviewsFacebook PostingsSurvey Responses Organizedby TopicNewspaper Articles on aSpecific TopicAd Hoc #Hashtag DiscussionsOthers 44
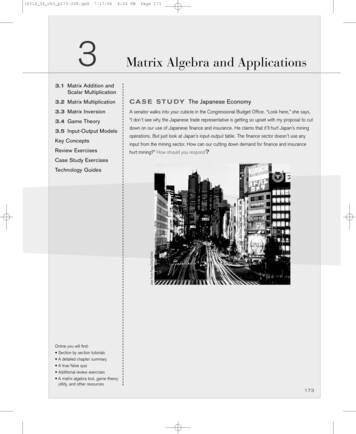
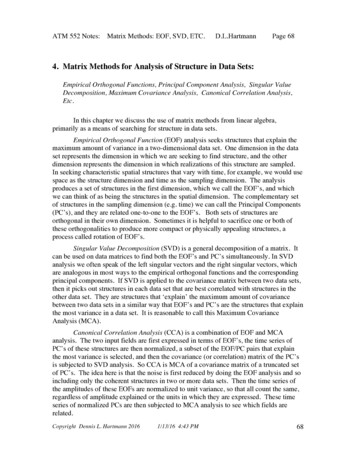
ALSO QUANT-BASED CROSS-TABULATIONANALYSES(USED WITH NON-PARAMETRIC CATEGORICAL DATA)Matrix Variables (“Banners” / Column Headers)A1Data Cells with CountsMatrix Variables(“Stubs” / Row Headers)Need to Calculate:(Observed Variables – Expected Variables)2 / Expected VariablesNeed to calculate chi-squaredNeed to calculate p (statistical significance level)Need to calculate degrees of freedom (df) (banners -1)(stubs -1)4545
ALSO QUANT-BASED CROSS-TABULATIONANALYSES(CONT.)(aka contingency tables)Contrasting what is expected (if there is nothing acting on the variables) vs. what isobservedResults in associational observations (not causal ones), insufficient power to assertcausationChi-square analysis based on: raw number counts and percentages: (actual observations - expected observations)2 / expectedobservations Goodness-of-fit test (from pure randomness / null hypothesis to some form of non-randomness orpatterning) Test of independence of variables (Of two categorical variables from one population: Is there anyassociation between the two variables? Can the level or incidence of one be used as a possiblepredictor of the other variable?)46
ALSO QUANT-BASED CROSS TABULATIONANALYSES(CONT.)Degrees of freedom (df) (number of banners – 1)*(number of stubs – 1) df consists of the mean of the chi square distribution df is used to calculate statistical significance of a chi-square statistic and the (in)validity of the nullhypothesisMinimum of 2x2 tables but may be much largerp-value (probability of obtaining a particular observed result )A value used to assess statistical significance (p .05, p .01, or other)Will need to transfer table to another tool (Excel, Qualtrics) for the complete crosstabulation analysis (by setting up a pivot table, calculating expected frequencies,calculating observed frequencies, frequency distributions, percentages of columns andof rows, etc.47
QUALITATIVE CROSSTABULATION ANALYSIS INNVIVO 12 PLUSThe newest version of NVivo enables a qualitativecross-tabulation analysis, which is built off of amatrix. Basically, users may cross-referenceselected cases (individual persons or “egos,” groupsor “entities”) or demographic attributes againstvarious folders or codes (themes / topics) toidentify relationships that may be otherwise latent.The respective cells contain numbers.No chi-squared analysis or statistical significancenumber is calculate.The result is an intensity matrix based on numbercounts alone.48
ADDING VALUE TO QUALITATIVE CROSSTABULATION ANALYSESUse case nodes (egos/individuals and entities/groups)Use classification sheets to enable the grouping of egos and entities based ondemographic and other (defined) dimensions / attributes / factorsHypothesize a priori based on qualitative cross-tabulationsHypothesize in a post hoc way based on cross-tabulations (but be sure to indicatethese as such)49
WRAP-UP50
WHERE MATRICES COME FROMNot all matrices come from matrix queries or matrix coding queriesSome forms of autocoding / machine learning (sentiment analysis, theme and subtheme extraction) result in intensity matrices that are used to report out the findingsFrom the matrices, various data visualizations may be created, including bar charts,social network graphs (from Twitter ), and hierarchy charts (treemap and sunburstdiagrams in NVivo 12 Plus)51
EXPORT OF MATRICESMatrices export out as .txt, .xl, and .xlsx formatsExtracted data (highly portable) may be analyzed in other software tools and inother ways to a data table, for some of the autocoded matrices: Column headers are variables Rows are records52
53
ADDITIONAL QUESTIONS?What are some other types of matrix queries possible based on your own research?How would you set up your matrix query, and why? (Is there a manual equivalency toa computerized matrix query? A computerized equivalency outside of NVivo? Howwould that work (in either case)?)What can matrix queries tell you that you could not find out otherwise? (Or if thematrix query is not possible, what are some other ways to surface and discover thesame information?)How would you present matrix query findings in a presentation? A research paper?[When would you keep a matrix query’s findings on background (just for youranalysis)? When would you put a matrix query’s findings on foreground (inpublications and presentations for the public consumption)?]54
ADDITIONAL QUESTIONS?(CONT.)How would you use some matrix data visualizations with data created in autocoded /auto-created ways?How would you represent the findings?Besides bar charts, what are some other ways to represent matrix data? What about relational matrices expressed as network graphs? (a very common visualization)55
CONCLUSION AND CONTACT INFORMATIONDr. Shalin Hai-Jew Instructional Designer, iTAC146 Unger ComplexKansas State Universityshalin@k-state.edu785-532-5262The presenter has no formal tie to QSR International.The student subscription version of NVivo 12 Plus (available for about 70 a year fora two-year subscription) enables matrix queries and matrix-based visualizations. It isa full performance version of the software.56
2. Types of elements (variables) for matrix comparisons 3. Setting up matrix queries in NVivo 12 Plus 4. Specific matrix "use cases" in qualitative, quantitative, and mixed methods research 5. Wrap-up 2