Transcription
Journal of Occupational and Environmental Hygiene, 3: 144–152ISSN: 1545-9624 print / 1545-9632 onlineDOI: 10.1080/15459620500526552Silica Exposure on Construction Sites:Results of an Exposure Monitoring DataCompilation ProjectMary Ellen Flanagan,1 Noah Seixas,1 Paul Becker,2 Brandon Takacs,2and Janice Camp11Department of Environmental and Occupational Health Sciences, University of Washington,Seattle, Washington2Safety and Health Extension, West Virginia University, Morgantown, West VirginiaTo expand on the limited size and scope of constructionsilica exposure studies, a silica monitoring data compilationproject was initiated through the American Conference ofGovernmental Industrial Hygienists Construction Committee.Personal silica exposure monitoring data was collected andanalyzed from 13 private, research, and regulatory groups. Aneffort was made to collect as much detail as possible abouttask, tool, and environmental and control conditions so asmuch information as possible could be garnered. There wereconsiderable data gaps, particularly with regulatory agencydata, that represented over half of the data set. There were1374 personal quartz samples reported with a geometric meanof 0.13 mg/m3 and a GSD of 5.9. Descriptive statistics arereported by trade, task, tool, and data source type. Highestexposures were for abrasive blasters, surface and tuckpointgrinders, jackhammers, and rock drills. The sample periodwas important, with short-term samples (up to 2 hours) havingconsiderably higher levels than midterm (2–6 hours) or longer(over 6 hours) samples. For nearly all exposure variables,a large portion of variable categories were at or over thequartz occupational exposure limit of 0.05 mg/m3 , including8 of 8 trade, 13 of 16 task, and 12 of 16 tool categories.The respiratory protection commonly used on constructionsites is often inadequate for the exposures encountered. Thedata variability within task and tool was very large, withsome very high exposures reported for a broad spectrum oftools. Further understanding of the conditions leading to highexposures will require more detailed documentation of thesample characteristics following database design recommendations or systematic surveys of exposure in this complexindustry.Keywordsconstruction, respirator, silica, task, tool, tradeSilica exposure continues to be an important hazardin the construction industry and therefore remainsa concern for construction workers’ health. Moresilicosis deaths were associated with constructionthan any other U.S. industry in an evaluation of 1985–1990 death certificates.(1,2) Elevated quartz exposures havebeen reported for several construction activities(3 10) althoughsample sizes are usually relatively small and scattered acrossa broad spectrum of construction activities.A comprehensive study of construction related silica exposure would provide better information for assessing risk fromspecific activities so that controls could be targeted for mostbenefit. Large and comprehensive studies are very challengingin construction due to continually changing workplaces, tasks,and environmental conditions.The American Conference of Governmental HygienistsConstruction Committee initiated a silica data compilationproject to obtain a larger dataset to represent as many silicadust producing construction activities as possible, determinemost influential factors for predicting silica exposure, andidentify strengths and weaknesses of existing data. Data wascollected from public and private occupational health entitiesto compile more comprehensive silica exposure informationfor the construction industry. The database was designed with25 variables selected for collection of more comprehensiveinformation on exposure determinants.METHODSDAddress correspondence to: Mary Ellen Flanagan, University ofWashington, Department of Environmental and Occupational HealthSciences, 4225 Roosevelt Way NE, Suite 100, Seattle, WA 98105;e-mail: mflanaga@u.washington.edu.144ata were solicited from organizations and agencies thathave conducted air monitoring for silica on constructionsites, primarily through professional organization contacts.Data from the Occupational Safety and Health AdministrationIMIS database does not provide the detail needed to meet thesample criteria test. All seven present and past silica SENSORJournal of Occupational and Environmental HygieneMarch 2006
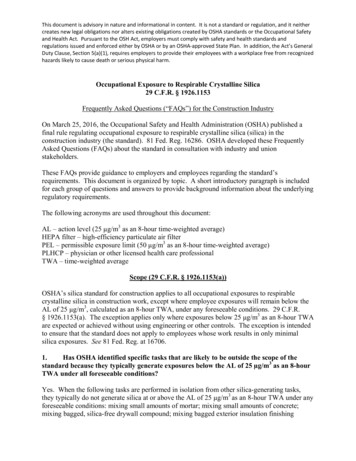
states were contacted, and 10 research or academic groupsknown to have an interest in construction silica exposure characterization were contacted to solicit data. Data submittal wasalso requested of contractors, consultants, and others present atconstruction sessions of conferences of the Construction SafetyCouncil and the American Industrial Hygiene Association.All 12 parties who expressed interest at these meetings werecontacted.Thirteen organizations provided data that was entered into adata file at the University of Washington. Data were received inelectronic or hard copy format with five sources providing hardcopy data while the remainder submitted data electronically.For inclusion in data analysis, the following sample criteria testhad to be met: a reported respirable quartz and/or respirabledust concentration, sample duration, and trade, task and/ortool associated with the sample. All data files required somerecoding to meet the project’s format.The database was designed to collect as much detail aspossible for variables that could be important in describing theconditions of exposure. There were 25 variables in the dataset. Variables describe sample collection parameters, projectconditions, and site and activity conditions. Variables withmuch missing data and/or poor quality data were not analyzed.These included country, SIC code, secondary and tertiarytask, tool, tool model, site ventilation, and percent time doingdusty task. If the details for a variable were unavailable fromthe source data, the record was coded with “unreported” forthat variable. If categories of a variable had fewer than eightentries, categories were combined. For example, for Trade,plumber, fabricator, painter, electrician, carpenter, drywall, andironworker were recoded to “Other.”All data sources reported some samples below the quartzand/or respirable dust limit of detection or quantification. Themanner of reporting non-detects varied among data sourceswith some sources reporting a calculated concentration whileothers reported “below LOD” or “below LOQ”. To standardizethe non-detect data, we solicited the laboratory limit ofdetection and limit of quantification from each analyticallaboratory and used the laboratory’s limit of quantification andsample volume to calculate a sample LOQ concentration. Thisvalue was divided by 2 for entry in the data set as recommendedby Hornung and Reed(11) for a skewed data set with a largeportion of the data below the detection limit. Quartz was belowthe detection limit for 30% of personal quartz samples.Sample year was grouped into three categories to assesstime trends: 1992–1995, 1996–1998, and 1999–2002.Quartz percentage is the respirable quartz percentage calculated for all records that reported both a respirable dust andrespirable quartz concentration. No information was collectedon bulk samples from substrate worked.To assess whether workers are protected by commonly usedrespirators, the long-term samples (over 6 hours) from thisdata set were used to determine the percentage of tool userswho would be protected while wearing a respirator. Protectionfactors of 5, 10, and 50 were used for dust mask, halfface cartridge, and full-face cartridge respirator, respectively.National Institute for Occupational Safety and Health (NIOSH)protection factor values(12) were used for cartridge respirators.The NIOSH protection factor assumes that the respirator hasbeen fit tested assuring good fit. It is difficult to achieve agood fit with a dust mask, and our knowledge of respiratoryprotection programs on construction sites suggests that dustmasks are rarely fit tested; therefore there is less confidence inthe assumption of good fit. The NIOSH protection factor of 10for NIOSH rated dust masks was reduced to 5 for this analysisto reflect the lack of confidence in a good fit for dust maskson construction sites. The percentage of tool users protectedwas calculated as a parametric exceedance factor(13) using the Rthreshold limit value (TLV ) of 0.05 mg/m3 .Statistical analysis utilized the statistical software SPSS10.0. Quartz and respirable dust concentrations were generallylog normally distributed so these variables were log transformed for analysis. Geometric means and geometric standarddeviations were calculated to describe exposure variables.Linear regression was run on 15 variables to identify themost influential exposure determinants. Model developmentwas an iterative process whereby predictors (tool, task, individual source, source category, state, sample duration, quartzpercentage, trade, project purpose, environment, samplingdevice, construction sector, quartz analytical method, controls,nearby dust source, and sample year) were added in rankorder and their overall effect on the model was considered.Nonsignificant (p 0.05) predictors including task, projectpurpose, source category, sampling device, quartz analyticalmethod, and nearby dust source were removed from the model.Individual source and state were excluded from analysis dueto overlap with construction sector.RESULTSData sources included three federal or state regulatoryagencies (n 827 samples), six university or researchagencies (n 491), and four private consultants or contractors(n 134). Samples were collected from 1992 to 2002 with76% of samples from 1997 to 2000. There were numerousgaps from the source data with 3% of trade, 17% of task, 26%of tool, 43% of project type, 62% of environment, and 83% ofcontrol status unreported.There were 1,630 samples that met the sample criteriatest. Of these, 178 samples were area samples. Becauseinformation on the purpose and location of area samplecollection was limited, these samples were eliminated fromthe analysis. Of the 1,452 personal samples, 1,374 reporteda quartz concentration and 1,394 reported a respirable dustconcentration.Descriptive statistics for exposure variables are shownin Tables I and II. The overall geometric mean (GM) andgeometric standard deviation (GSD) for personal exposureswas 0.13(5.9) mg/m3 for quartz and 1.36(5.5) mg/m3 for respirable dust. Source is presented by sample duration category(Table I). Concentrations were higher especially for samplesof 2 hours as would be expected with task sampling vs. fullJournal of Occupational and Environmental HygieneMarch 2006145
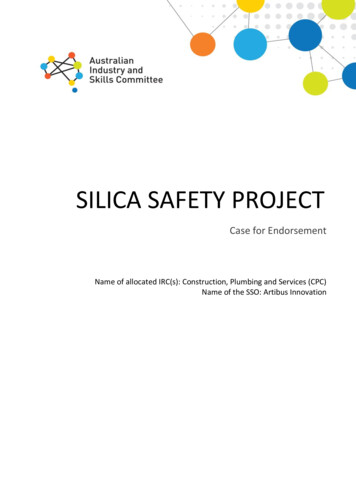
TABLE I.Quartz Concentration (mg/m3 ) by Data Source and Sample DurationSource TypeRegulatory: GM (GSD)Research: GM (GSD)Private: GM (GSD)Sample Duration Totals: GM (GSD)Up to 2 Hours2–6 HoursOver 6 HoursTotal0.33 (6.0)N 2060.28 (3.9)N 500.20 (4.0)N 230.30 (5.4)N 2790.13 (5.3)N 4430.12 (5.2)N 2340.08 (4.8)N 540.12 (5.3)N 7310.11 (5.3)N 1140.07 (6.6)N 2060.05 (4.6)N 440.08 (6.0)N 3640.16 (5.8)N 7630.10 (5.9)N 4900.08 (4.9)N 1210.13 (5.9)N 1374shift sampling, although it cannot be assumed that the shortersamples are task samples since the purpose of sampling is notreported for much of these data. Exposures from regulatoryagency samples were higher (GM of 0.16) than research (GMof 0.10) and private (GM of 0.08) samples. Variability was highwith most geometric means in the range of 4.0 to 6.0 for mosttrades, tasks, and tools (see Table II).Sample duration ranged from 6 to 601 minutes with amedian of 219 minutes. Duration was coded into categoriesof less than 2 hours, 2–6 hours, and over 6 hours for analysis.For both quartz and respirable dust, the short term samples (upto 2 hours) were on average considerably high than the midand longer term samples, with a quartz GM of 0.30 mg/m3 forshort term and 0.12 and 0.07 mg/m3 for mid and long termcategories.For exposure controls, dust generation, and environment(Table II), levels generally follow the expected direction,although it is important to note for all three of these variablesthe majority of the records had missing data for these variables.For construction sector exposures were highest for residentialconstruction and lowest for industrial/commercial projects.For project purpose, new construction projects showed lowerexposure than other projects involving demolition, remodeling,and maintenance. The sampling device used for 92% ofsamples was either a nylon or aluminum cyclone. There wasessentially no difference for these two devices. The otherdevices used had concentration means that varied considerablyfrom the cyclone means, although the sample size was verysmall for each of these devices.Quartz concentration trended downward over time(Table II), with a statistically significant difference betweenmeans.The quartz content varied with the tool used (Table IV).Relatively low quartz percentages were seen for abrasiveblaster and cement mixer, whereas over half the walk behindsaw samples had quartz percentage of over 15%. Several toolsthat are used at varying substrate depths and on various silicacontaining materials, including surface grinder, jackhammer,and backhoe had a fairly equal distribution across all quartzpercentage ranges.Multiple regression models for ln quartz (R2 0.29) andln respirable dust (R2 0.22) are shown in Table VI. For146both quartz and respirable dust models, tool, trade, sampleduration, environment, and controls were significant variables.In addition, Quartz%, sample year, and construction sectorwere also significant in the quartz model.For tool, parameter estimates were significant or highlysignificant for 12 of 13 tool categories in the quartz model.For environment, as the setting is more enclosed exposureincreases. Quartz% was highly significant in the quartz modeland sample duration was highly significant in both models.DISCUSSIONFor all data sources, the data submitted represents samplescollected from multiple construction projects. The objective for sampling (regulatory compliance, site characterization,worst case, etc.) is not known in most cases. It is also notknown if the sample period encompasses the entire period ofdust exposure and whether only one sample was collected onone worker for the monitored shift. Over half of the sampleswere obtained from federal OSHA or state plan agencies andthese data tended to have fewer details recorded.We attempted to collect data for 16 exposure determinantvariables. With data coming from various sources, some withmore complete data collection and retention mechanisms thanothers, the database has considerable data gaps. This projectillustrates the importance of thorough and detailed data collection and documentation. The majority of samples collectedwere from regulatory sources. These sources provided muchlarger data sets but with much more limited detail (Table III).With improved regulatory agency databases, these data couldserve as a more valuable resource for understanding exposuresand contributing factors.For source type there was a statistically significant difference between means although with modeling it was notsignificant. Data sources represented in this data set usuallyevaluated construction projects in only one or two states andfor most sources projects tended to be of only one constructionsector so there may be considerable overlap of state, datasource, and construction sector. Source type was removed fromthe model for nonsignificance. State was excluded from themodel due to overlap with construction sector.Journal of Occupational and Environmental HygieneMarch 2006
TABLE II.Quartz and Respirable Dust Concentrations by Exposure VariableQuartz (mg/m3 )TotalTaskTuckpoint grindingSurf grindingCut trench/tunnelAbrasive blastingDrill concreteCut other AUnreportedHand-held demolitionRoad demoCut concrete/brickOther highway BHod carrier/mixingCleanupOther industrial/commercialCPrep/finish concreteHeavy equipment demolitionToolTuck point grinderSurface grinderAbrasive blasterRock drillHand-held sawJackhammer/chipping gunUnreportedRoad millWalk behind sawOther highway DTable sawOther industrial/commercial EConcrete mixerBroom/shovelNoneBackhoe, excavator, bulldozer, and bobcatTradeAbrasive blasterCement finisherLaborerStone/brick masonHod carrierUnreportedOther FHeavy equipment espirable dust (mg/m3 )N1374GM (GSD)0.13 (5.9)N1394GM (GSD)1.36 (5.4)1011228649720239226511641954615350450.60 (5.5)0.29 (5.0)0.25 (37.0)0.24 (5.0)0.20 (5.2)0.18 (4.4)0.17 (6.9)0.14 (4.3)0.09 (3.9)0.08 (4.0)0.07 (8.0)0.05 (4.7)0.05 (3.7)0.04 (2.9)0.03 (3.4)0.03 (4.7)971149659521250228501852052625149466.05 (3.9)2.72 (5.9)15.64 (2.7)3.74 (5.9)1.82 (4.4)1.36 (4.3)1.28 (6.0)1.63 (4.1)0.72 (2.8)0.72 (3.8)0.42 (6.8)1.26 (3.9)0.66 (3.5)0.48 (4.3)0.61 (3.9)0.34 (4.8)1021235693651783604833375163324956280.61 (5.4)0.28 (5.1)0.24 (5.0)0.21 (5.2)0.13 (5.4)0.15 (4.1)0.14 (6.2)0.11 (3.6)0.09 (3.3)0.09 (4.8)0.07 (3.9)0.06 (5.3)0.04 (4.0)0.03 (3.6)0.03 (3.3)0.01 (2.6)981145692711803784837365363325056306.36 (3.9)2.83 (5.6)4.44 (5.9)1.86 (4.7)1.13 (4.5)1.60 (4.1)1.19 (5.1)0.90 (2.7)0.52 (3.8)0.49 (6.2)0.85 (3.8)0.99 (6.0)1.39 (3.9)0.48 (3.5)0.42 (4.1)0.36 (5.3)482295912403438921020.22 (5.3)0.16 (7.0)0.14 (5.4)0.13 (6.6)0.10 (4.2)0.10 (7.5)0.10 (4.4)0.05 (4.2)492176072503238961054.44 (5.8)2.01 (5.9 )1.39 (4.8)1.49 (5.8)1.03 (4.1)0.95 (8.8)0.75 (4.2)0.53 (4.2)166711451460.17 (7.5)0.14 (4.9)0.14 (6.1)0.08 (4.4)13671158156Journal of Occupational and Environmental HygieneMarch 20061.68(12.3)1.57 (6.6)1.45 (5.4)0.78 (3.9)(Continued on next page)147
TABLE II.Quartz and Respirable Dust Concentrations by Exposure Variable (Continued)Quartz (mg/m3 )TotalNearby Dust nmentConfined (stairwell, corridor, tunnel)Partially enclosed (2–4 walls)UnreportedEnclosed (walls, roof, and windows)OpenConstruction l/commercialProject PurposeUnreportedOtherGNew constructionSampling DeviceImpactorBGI cycloneNylon cycloneAluminum cycloneDirect-readingUnreportedQuartz Analytical MethodUnreportedFTIRXRDSample Year1992–19951996–19981999–2002Respirable dust (mg/m3 )N1374GM (GSD)0.13 (5.9)N1394GM (GSD)1.36 (5.4)1247710251480.17 (4.9)0.13 (5.3)0.13 (5.9)0.09 (6.1)1227710491461.55 (4.9)1.77 (5.4)1.35 (5.5)1.13 (5.1)15748511602740.33 (5.6)0.21 (4.7)0.15 (5.6)0.12 (6.7)0.08 (5.8)13748671632775.58 (4.9)2.10 (4.9)1.49 (5.3)1.52 (5.6)0.78 (5.2)591242944650.17 (6.2)0.14 (8.2)0.13 (5.5)0.09 (5.2)612242914671.58 (6.1)2.53 (5.5)1.09 (4.9)1.23 (4.7)7933412400.17 (5.9)0.10 (5.0)0.07 (5.8)8163422361.63 (5.4)1.25 (5.0)0.83 (5.3)26810771813790.48 (1.1)0.36 (4.7)0.13 (5.8)0.13 (6.1)0.08 (3.9)0.03 (3.6)268109918237610.38(1.1)1.97 (4.4)1.34 (5.3)1.42 (6.5)0.92 (3.6)0.35 (2.6)24069660.94 (7.4)0.16 (5.5)0.12 (6.0)473729750.79 (3.2)1.54 (4.6)1.34 (5.8)1074717960.23 (6.4)0.18 (5.4)0.09 (5.7)1144748061.49 (5.7)1.58 (5.0)1.22 (5.5)A Cutfibrous cement board and unreported substrate.support, flagger, inspector, rock crusher, transport, and pile driver.C Apply shot crete, polish stone, lay brick, hang fibrous cement board, sand drywall, transport, flagger.D Vermeer saw, boring machine, compressed air, drill rig, crane, rock crusher, water truck.E Vacuum cleaner, wall saw, core drill, trenching machine, compressed air, hydraulic shear, rock crusher, gunite gun, water spray.F Plumber, fabricator, painter, electrician, carpenter, drywall, and iron worker.G Renovation, maintenance, and demolition.B DemolitionTABLE III.Data SourcePrivateResearchRegulatoryUnreported Factors by Data SourceNControlsEnvironmentNear by DustConstruction te: Percentage of all records missing.148Journal of Occupational and Environmental HygieneMarch 2006
TABLE IV.Respirable Quartz Percentage by Tool UsedRespirable Quartz Percentage RangeToolTuckpoint grinderSurface grinderAbrasive blasterRock drillHand-held sawJackhammerRoad millWalk behind sawTable sawConcrete mixerBackhoe, excavator, bulldozer, bobcatBroom/shovelN0–5%6–10%11–15%Over 15%1021235693651784833513228497 (8%)13 (11%)21 (50%)6 (7%)6 (10%)32 (19%)2 (4%)2 (6%)11 (23%)16 (55%)6 (25%)7 (16%)40 (44%)44 (38%)7 (18%)29 (32%)12 (20%)42 (25%)16 (33%)7 (22%)16 (33%)6 (21%)5 (21%)23 (53%)32 (35%)28 (25%)2 (5%)21 (23%)25 (41%)36 (22%)12 (25%)5 (16%)11 (23%)4 (14%)4 (17%)6 (14%)12 (13%)30 (26%)12 (29%)34 (38%)18 (29%)55 (33%)48 (38%)18 (56%)10 (21%)3 (10%)9 (37%)7 (17%)Ideally, all exposure sampling would be conducted for a fullshift when comparison is made with a full shift occupationalstandard. In construction it is frequently not feasible tocharacterize exposure with full shift sampling because taskscan change often within a shift. Even regulatory samplescollected in this database were, more often than not, partial shiftsamples. There is considerable difference in exposure levelreported for shorter vs. longer sample durations. Confidencein this interpretation is strengthened because this trend issustained for all data source types. The higher exposures atshorter duration found in this data set suggest that short termsamples are more likely to be continuous dusty operations andperhaps task samples, although this cannot be concluded withthe information available.It was encouraging to see a downward trend in exposure overthe period represented in this data set although quartz exposurefor the most recent period (1999–2002) was still almost twicethe TLV.As tool and task are defined in this database, they oftenoverlap. Frequently the tool used and task performed aredescribing the same construction activity. This is why taskdropped out of multiple regression modeling. When designinga data collection scheme for construction, tool may be a moredescriptive variable than task, with less uncertainty aboutinterpretation of category definitions.For trade, task, and tool, (Table II) exposures generally agreewith levels reported in the literature.(3 10) For trade, abrasiveblasting was the highest quartz exposure followed by cementfinisher, laborer, and stone/brick mason. It was unexpected thatfor both task and tool, the highest quartz exposure was tuckpoint grinding, followed by surface grinding, both exceedingabrasive blasting which is commonly considered an extremelyhigh exposure.For abrasive blasting, practices vary with air samplescollected both inside and outside of the blasting hood. The GMabrasive blasting exposure was considerably lower than sandblasting concentrations outside the hood reported by Linch.(14)Information on blasting medium was not collected in thisdataset. In the last decade several alternative nonsilica blastingagents have been introduced.(15) Some of these agents mayhave been used during some of the abrasive blasting samplingin this dataset. Unreported information on these factors limitconfidence in the abrasive blasting results.The range of exposures for any tool or task is extremelybroad–spanning 3 or 4 orders of magnitude for most tasksand tools. This wide range means that using any measureof central tendency to represent an activity could seriouslyunderestimate exposures in some cases. For this data set,13% of all quartz samples were over 1.0 mg/m3 or 20 timesthe TLV. These extremely high exposures represented 9 of12 tools and less than half were abrasive blasting or grindingsamples, those activities one might expect to produce extremeexposures.The heterogenous nature of construction silica exposure hasbeen recently documented by Nij et al(16) and Rappaport et al.(6)Rappaport et al found that between worker variance tended tobe much greater than within worker variance when looking atactivities for four trades. Nij et al found that differences in thematerial worked explained most differences in between workervariance in a study of 8 construction tasks.There are other factors that are also very important toexposure. The degree of work area enclosure, the presenceand degree of natural ventilation, adjacent dusty activities, andthe continuous vs. intermittent nature of the dusty task areall potentially important factors. Environment was identifiedas important in multiple regression modeling of these data.Flanagan et al(7) and Akbar-Khanzadeh and Brillhart(17) wereable to document the importance of these factors for someconstruction activities. More work is needed to describe thefactors that produce variability, with a focus on identifyingsituations that result in the highest exposures so they can betargeted for control.Journal of Occupational and Environmental HygieneMarch 2006149
TABLE V.Exposure Determinant Models for Quartz and Respirable Dust ExposureLnQuartz–R2 0.29SEβ0.50 0.750.493.54 2.28 1.68 1.65 1.38 1.41 1.11 1.52 0.94 1.41 1.28 0.71 40.380.360.380.410.400.402.84 1.36 1.39 0.80 0.79 0.84 0.010.89 1.30 0.64 0.61 0.37 0.33 0.32 40.360.390.380.380.610.45 0.36 0.01 0.38 0.23 0.22— 0.01 0.550.210.250.350.340.250.270.840.39 0.53 0.16 0.14 0.28 0.08— 0.01 0.520.200.240.350.330.250.270.94 0.29 0.60 0.56 —0.460.140.210.161.41 0.41 0.64 0.76 —0.460.140.210.16βInterceptToolTuck point grinderSurface grinderAbrasive/sand blasterHand-held sawTable top sawJackhammer/chipping gunWalk behind sawRock drillConcrete mixerRoad osier/bobcatTradeAbrasive blasterLaborerFinish masonHod carrierUnreportedStone masonOtherHeavy equipment operatorSample Duration (min)EnvironmentConfined (stairwell, corridor, tunnel)UnreportedPartially enclosed (2–4 walls)Enclosed (walls, roof, and windows)OpenConstruction rSample irable Dust–R2 0.22 4.21 0.000.000.39 0.110.06—0.370.360.370.47 0.100.08—0.380.360.370.620.25 0.61 —0.460.160.270.540.06 0.53 —0.460.150.260.52 0.30 —2.08 0.180.100.210.15—0.170.100.29Note: Parameter set to zero because it is redundant. Dependent Variable, ln of conc. (mg/m3 ) p .001; p .05; p .1.150SEJournal of Occupational and Environmental HygieneMarch 2006
Quartz % means were significantly different by constructionsector. Differences in construction techniques and to someextent the concrete composition could explain this difference.All concrete contains three components: a cement and watermixture known as paste (containing little or no silica); sand(almost always a silica base); and aggregate rock (withsilica content depending on the rock source). For industrialprojects the composition is approximately 30% paste, 30%sand, and 40% aggregate by volume. Highway projects maycontain a somewhat smaller proportion of paste and largerproportion of aggregate. Highways are built on a crushed rocksupport layer, potentially creating silica dust during haulingand dumping. Highway projects are usually scheduled duringwarmer weather when soil and materials are dry, whereasindustrial projects continue through most seasons, includingwetter weather. As concrete is finished, the sand and aggregateare pushed into lower layers and the paste rises to the topcreating a smooth surface. On industrial sites the concretemixture is often worked longer to produce a finer finish andmore of the paste containing little or no silica is at the surface.As tools are used to cut, break, or finish the concrete, thetools’ abrading or cutting action and the depth of intrusioninto the slab will affect the respirable quartz content of thedust generated.Quartz Percent was calculated from the respirable airsample. Information was not collected on the substrate workedand no bulk sampling was included in this dataset. Contractorsare interested in a simple sampling strategy and have expressedan interest in collecting bulk samples to assess a quartz hazard.Since there may be differences in silica content through thedepth of a slab, and the demolition or construction activitywill likely affect the particle size distribution of the dust, bulksamples offer only a crude measure for assessing a respirablesilica hazard.On average, silica exposures on construction sites need tobe reduced. For exposure by task, 12 of 15 categories and fortool 12 of 16 categories are at or in exceedance of the TLV.Controls are needed, whether it be provided by respiratoryprotection or engineering controls. In a recent study withsome use of dust masks and half face cartridge respiratorson commercial construction sites,(7) the respirator choicewas frequently inadequate for the exposure encountered. Ifengineering controls were already appropriately employed, thehigh exposures found in this data set would not be occurring.Only long-term or “full shift” samples were analyzedfor comparison with a full-shift exposure limit. Adequaterespiratory protection is defined as exposure below the TLVinside the respirator considering the protection factor of agiven respirator. The percentage of tool users protected wascalculated using the long term (over 6 hours) samples for 10tools. For all tools except backhoe/excavator, working withouta respirator would usually result in some overexpsoures, withabout half of cement mixer operators overexposed without arespirator (Figure 1) and even more for most other tools. Asthe level of respiratory protection increases, more tool usersare protected, although even with a full face respirator, only73% of tuckpoint grinders, 87% of surface grinders and 90%of rock drillers would have adequate respiratory protection.The use of a positive pressure abrasive blasting helmet isgenerally recognized as the appropriate protective gear forabrasive blasters. It is interesting that this level
The database was designed to collect as much detail as possible for variables that could be important in describing the conditions of exposure. There were 25 variables in the data set. Variables describe sample collection parameters, project conditions, and site and activity conditions. Variables with