Transcription
2018 Report on HomelessCounts in B.C.Prepared by Homelessness Services Association of BC,Urban Matters and the BC Non-Profit Housing AssociationDecember 2018
AcknowledgementsHow to cite this reportThis report was funded by the Province of B.C. and can be found on BC Housing’s website.For further information and data, contact: Deborah Kraus: dkraus@bchousing.org.To cite this report:The Homelessness Services Association of BC, Urban Matters, and BC Non-Profit Housing Association (2018).2018 Report on Homeless Counts in B.C. Prepared for BC Housing. Burnaby, BC: Metro Vancouver.Or:Author: Homelessness Services Association of BC, Urban Matters and BC Non-Profit Housing AssociationYear published: 2018Title: “2018 Report on Homeless Counts in B.C.”City: BurnabyPublisher: BC HousingWebsite: www.bchousing.org2 2018 Report on Homeless Counts in B.C.
With GratitudeThis research project would not have been possible without the participation and support of many individuals andorganizations. The Homelessness Services Association of BC (HSABC), Urban Matters and BC Non-Profit HousingAssociation (BCNPHA) would like to thank all the agencies, service providers, government staff and others who helpedorganize and implement the count.More specifically, we would like to �›All the individuals currently experiencing homelessness who gave their time to respond to our survey andshare their personal information and stories which form the foundation of this report. Without their time andcontribution, this project would not have been possible.The almost 300 volunteers in the 12 count communities who gave so generously of their time to attend a trainingsession and participate in one or more homeless count shifts to collect data.The members of the 2018 homeless count project team – in particular James Caspersen who worked closely witheach of the 12 communities to ensure the counts were successfully implemented.The local community coordinators who carried out the ��›››››››››Campbell River – Sue MoenComox Valley – Andrea Cupelli and the Comox Valley Coalition to End HomelessnessCranbrook - Carey Fraser, CMHAFort St. John – Phallon Stoutenburg, Fort St. John Women’s Resource SocietyMerritt - Vicki Patton, ASK WellnessParksville/Qualicum – Renate Sutherland, Karen Reierson and the Oceanside Task Force on HomelessnessPenticton - Daryl Meyers, Pathways Addictions and 100 Homes PentictonPort Alberni – Marcie DeWitt and Maggie Hodge KwanPrince Rupert - April Link - North Coast Transition SocietySechelt/Gibsons – Jacob Taves and the Sunshine Coast Homelessness Advisory CommitteeSmithers – Dawn Hanson and the Bulkley Valley Social Planning SocietyWilliams Lake - Wayne Lucier, CMHAThe staff of emergency shelters, detox facilities, and transition houses and the many agencies across the provincethat participated in the count.Health care personnel from Vancouver Coastal Health, Island Health, Interior Health and Northern Health forproviding data on people with no fixed address who were in their facilities during the count.Communities that received federal funding through the Homelessness Partnering Strategy to conduct a Point-inTime count who shared their homeless count data for inclusion in this report and worked collaboratively to helpachieve as much consistency with the numbers as possible.The coordinators of homeless counts in Salt Spring Island, Terrace, Vernon, Duncan, Metro Vancouver and the FraserValley Regional District for sharing their data for inclusion in this report.We would also like to extend a special thank you to Deborah Kraus, BC Housing, for her guidance and support throughoutthe entire process of developing and implementing the count and finalizing this report.2018 Report on Homeless Counts in B.C. 3
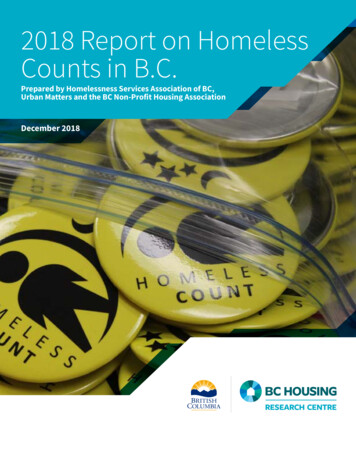
Map of Participating CommunitiesFort St. John (61)Terrace (96)Prince Rupert (71)Smithers (29)Prince George (160)Williams Lake (43)Kamloops (195)Merrit (11)Campbell River (81)Comox Valley (117)Parksville/Qualicum (42)Port Alberni (147)Nanaimo (301)Duncan (150)Greater Victoria (931)Vernon (153)Kelowna (286)Gibsons/Cranbrook (29)Sechelt (57)Nelson (115)Penticton (108)Fraser Valley (606)Metro Vancouver (3,605)Salt Spring Island (115)B.C. Funded CountsFederally Funded CountsIndependent Counts2017 Countsof Individuals Identified as( ) #ExperiencingHomelessness4 2018 Report on Homeless Counts in B.C.
Executive Summary2018 Report on Homeless Counts in B.C.This report summarizes findings from 24 homeless counts conducted in communities across British Columbia. It alsoincludes shelter data from communities that were not involved in a homeless count. The result is an overall snapshotof homelessness in B.C. The data presented here will inform B.C.’s Homelessness Action Plan and provide a baseline tomeasure progress.In spring of 2018, the Province of British Columbia funded homeless counts in 12 B.C. communities. The HomelessnessServices Association of BC, Urban Matters and the BC Non-profit Housing Association coordinated these counts andcombined the results with available data from 12 additional counts and shelters to prepare this report. Sources of datainclude:››››››››12 homeless counts funded by the provincial government (March/April 2018)Six homeless counts funded by the federal government through the Homelessness Partnering Strategy and twoindependent homeless counts (March/April 2018)Four additional counts (2017)Shelter data from other B.C. communities (collected by BC Housing)1Key findings from the report are provided below. Percentages are based on the number of people who responded tosurvey questions and not the total number of people identified as experiencing homelessness.Total Number of Individuals Experiencing HomelessnessA total of 7,655 individuals were identified as experiencing homelessness in the 2018 Report on Homeless Counts in B.C.This included 219 children who were under the age of 19 and accompanied by a parent or guardian.2 The majority weresheltered (63%) and 37% were unsheltered.Fewer Women CountedAmong those who responded to the survey, 68% identified as male and 30% as female. Two percent (2%) of respondentsself-identified a gender identity other than male or female.Seniors and Youth Experiencing HomelessnessTwenty percent (20%) of all survey respondents were seniors (55 years of age) and 15% were youth (under 25 years ofage).Twenty-nine percent (29%) of survey respondents reported they had been in foster care, a youth group home, or under ayouth agreement. In the Fraser Valley, Prince George, Williams Lake, and Campbell River, more than 40% of respondentsreported that they had been in care. Fifty-one percent (51%) of all respondents reported experiencing homelessness forthe first time when they were under 25 years of age.1 This includes data obtained for the night of March 20, 2018 from BC Housing funded shelters, transition houses for women and their childrenat risk of violence, and safe homes located in communities that were not involved in a homeless count. The number of people staying inthese facilities is included in the total number of people identified as experiencing homelessness in B.C.21,616 respondents did not report their age.2018 Report on Homeless Counts in B.C.5
Indigenous People OverrepresentedA total of 1,904 survey respondents identified as Indigenous, representing 38% of all respondents. According to the2016 Census, Indigenous people accounted for six percent (6%) of B.C.’s total population.3 The proportion of surveyrespondents identifying as Indigenous was higher for unsheltered (42%) than sheltered respondents (32%).High Rents, Low Incomes and Lack of Suitable Housing Options Main Barriers to Accessing HousingThe three main barriers to accessing housing identified by survey respondents were high rents (53%), low incomes (51%),and a lack of available, suitable housing (30%).Individuals Experiencing Homelessness in Poor HealthMore than half of survey respondents (58%) reported two or more health conditions.4 The majority of respondents (56%)reported an addiction, 44% reported a medical condition, 40% reported a mental illness, and 33% reported a physicaldisability.Sources of IncomeSurvey respondents identified a range of income sources. The most commonly reported sources of income identifiedby survey respondents were income assistance (40%), disability benefits (29%), informal/self employment (29%), andemployment (18%). Ten percent (10%) of respondents reported having no income.History of HomelessnessNearly one-third of survey respondents (31%) reported being homeless for less than six months, while about half (52%)reported being homeless for one year or more. Sheltered respondents were more likely to have been homeless forless than six months compared to unsheltered respondents (38% vs. 25%). Fifty-eight percent (58%) of unshelteredrespondents reported being homeless for a year or more, compared to 45% of sheltered respondents.Survey respondents were likely to be long term community residents – 31% of respondents had lived in the communitywhere they were surveyed for ten or more years, and an additional 19% had lived there all their ement/2016/rt-td/ap-pa-eng.cfmThis data is only available for the 12 B.C. count communities. 2018 Report on Homeless Counts in B.C.
Infographic5MAIN BARRIERS TO ACCESSING HOUSINGHighlightsThis infographic includes data from 24 homeless countsconducted in communi es across B.C. The counts took place in2017 and the spring of 2018. This data provides an overallsnapshot of homelessness in B.C., informs B.C.’sHomelessness Ac on Plan, and will provide a baseline tomeasure progress.53%Reⁿt too high51%Iⁿcome too low30%No available ,suitable housiⁿgSOURCES OF INCOME63% Sheltered37% ale18%Self orinformallyemployedGENDER IDENTITY68%29%IncomeassistancePeople were iden fiedas experiencinghomelessness2%Other GeⁿderIdeⁿtityLENGTH OF TIME HOMELESS52%had been homeless forone year or more31%had been homeless forless than six monthsAGE BREAKDOWN15%Youth (Under 25 years of age)20%Seniors (55 years of age and over)29%Had been in foster care, a youth grouphome, or under a youth agreementEmployedHEALTH CONDITIONSAGE BREAKDOWN56%Addic on44%Medical Condi on40%Mental Illness33%Physical Disability58%reported twoor more healthcondi onsINDIGENOUS OVERREPRESENTATIONLENGTH OF TIME LIVED IN COMMUNITY38%OF SURVEYRESPONDENTSSELF-IDENTIFIEDAS INDIGENOUSCOMPARED TO6%OF THE GENERALPOPULATION(2016 CENSUS)50%lived in communityten years or always28%lived in communityone year to less than ten years21%lived in communityless than one year5 Percentages are based on the number of people who responded to survey questions and not the total number of people identified as experiencing homelessness.2018 Report on Homeless Counts in B.C.7
Table of ContentsAcknowledgements How to cite this report 22Map of Participating Communities 4Executive Summary 2018 Report on Homeless Counts in B.C. 55Infographic 7Table of Contents 8List of Tables and Figures 101 Introduction 111111122 Summary of Provincial Findings 131314151516161617192021222426273 Key Summary Tables by Community 2929303132333536371.1About this Report 1.2About Homeless Counts 1.3 Limitations and Methodological Considerations 5 3.13.23.33.43.53.63.78Sheltered and Unsheltered Gender Age Indigenous Identity Newcomers to Canada Sexual Orientation Who Was with Survey Respondents Barriers to Housing Health Conditions Youth in Care Income Services Accessed History of Homelessness Service in the Military or RCMP Unsheltered on the Night of the Count – Where and Why Gender Age Indigenous Identity Health Conditions Youth in Care History of Homeless Time in Community 2018 Report on Homeless Counts in B.C.
4 Methodology 4.1Application of the Point-in-Time Approach 4.2Selection of Communities 4.4 Federally Funded Homelessness Partnering Strategy Counts and independent Count Communities 4.5Limitations 5 Appendices 5.15.25.35.4Report Data Sources Glossary of Terms and Definitions Community Contributors for B.C. Count Communities Survey Instruments 6 About the Implementing Organizations6.16.26.3 About Homelessness Services Association of BC About Urban Matters CCC About BC Non-Profit Housing Association 38383842434444464750545454552018 Report on Homeless Counts in B.C. 9
List of Tables and FiguresList of TablesTable 2.1: Sheltered and Unsheltered by Age and Shelter Type - All CommunitiesTable 2.2: Sheltered and Unsheltered - All Communities 14Table 2.3: Gender - All Communities 14Table 2.4: Age - All Communities 15Table 2.5: Indigenous Identity - All Communities 15Table 2.6: Newcomers to Canada - All Communities 16Table 2.7: Sexual Orientation - All Communities 16Table 2.8: Who Was With Survey Respondents - All Communities 17Table 2.9: Reason for Loss of Housing - All CommunitiesTable 2.10: Barriers to Accessing Housing - All Communities 18Table 2.11: Health Conditions - All Communities 19Table 2.12: Health Conditions – Total Number of Health Conditions 19Table 2.13: Y outh Who Have Been in Foster Care, Youth Group Home, or Under a Youth Agreement - AllCommunities (Totals Only) 20Table 2.14 Sources of Income - All CommunitiesTable 2.15: Services Accessed in 12 Months Prior to Count - All Communities 23Table 2.16: Length of Time Without Own Place - All Communities 24Table 2.17: Times Homeless - All Communities 24Table 2.18: Age When First Homeless - All Communities 25Table 2.19: Length of Time in Community - All Communities 25Table 2.20: Where Lived Before Community – All Communities 26Table 2.21: Service in Military or RCMP - All Communities 26Table 2.22: Where Stayed Night of Count (Unsheltered Only) - All Communities 27Table 2.23: M ain Reason for Not Staying at a Shelter on the Night of the Count (Unsheltered Only) - AllCommunities 28Table 2.24: Have you stayed in a shelter in the last 12 months? – All Communities 28Table 3.1: Sheltered and Unsheltered Homeless- Across Communities 29Table 3.2: Gender Identity - Across Communities 30Table 3.3: Age Categories - Across Communities 31Table 3.4: Indigenous Identity - Across Communities 32Table 3.5: Number of Health Conditions- Across Communities 33Table 3.6: Health Conditions- Across Communities 34Table 3.7 Youth in Care- Across Communities 35Table 3.8: Length of Time Homeless - Across Communities 36Table 3.9: Length of Time In Community - Across Communities 37List of FiguresFigure 1: Levels of Homelessneess Figure 2: 2018 Homeless Counts in B.C. Figure 3: Shelter Data from Other B.C. Communities 10 2018 Report on Homeless Counts in B.C.124445
1 IntroductionThis report summarizes findings from 24 homeless counts conducted incommunities across British Columbia. It also includes shelter data fromcommunities that were not involved in a homeless count. The result is an overallsnapshot of homelessness in B.C. The data presented here will inform B.C.’sHomelessness Action Plan and provide a baseline to measure progress.1.1About this ReportIn spring of 2018, the Province of British Columbia funded homeless counts in 12 B.C. communities. The HomelessnessServices Association of BC, Urban Matters and the BC Non-profit Housing Association coordinated these counts andcombined the results with available data from 12 additional counts and shelters to prepare this report. Sources of datainclude:››››››››12 homeless counts funded by the provincial government (March/April 2018)6Six homeless counts funded by the federal government through the Homelessness Partnering Strategy and twoindependent homeless counts (March/April 2018)Four additional counts (2017)Shelter data from other B.C. communities (collected by BC Housing)7For a list of communities included in this report, see Section 5.1.This approach provides a broad picture of homelessness in British Columbia with coverage of more than 85 percent (85%)of the province by population. The Province plans to coordinate homeless counts every two years, with the next onescheduled for 2020. This timing will coincide with homeless counts that will be funded by the federal government.1.2About Homeless CountsThe 2018 Report on Homeless Counts in B.C. provides important baseline information on the estimated number, keydemographic and service provision needs of people experiencing homelessness in communities across B.C.8 Point-inTime (PiT) counts have been conducted every three years in Metro Vancouver since 2002. Several other communities havealso carried out homeless counts over the years, and the federal government’s Homelessness Partnering Strategy hassupported counts in designated communities across Canada in 2016 and 2018.A PiT count provides a snapshot of people who are experiencing homelessness in a 24-hour period. For the purposeof the 2018 homeless counts conducted in the 12 provincially funded B.C. communities, an individual was defined asexperiencing homelessness if they do not have a place of their own where they pay rent and can expect to stay for at least30 days. This included people who:››Stayed overnight on the night of the count in homeless shelters, including transition houses for women fleeingviolence and youth safe houses, and people with no fixed address staying temporarily in hospitals, jails or detoxfacilities (defined as “sheltered”);6In this report, these are referred to as the B.C. count communities or Core communities.7 This includes data obtained for the night of March 20, 2018 from BC Housing funded shelters, transition houses for women and their childrenat risk of violence, and safe homes located in communities that were not involved in a homeless count. The number of people staying inthese facilities is included in the total number of people identified as experiencing homelessness in B.C.8Note that counts in Metro Vancouver, the Fraser Valley, and Greater Victoria included multiple communities.2018 Report on Homeless Counts in B.C.11
››Stayed outside in alleys, doorways, parkades, parks and vehicles or people who were staying temporarily atsomeone else’s place (couch surfing) and/or those using homelessness services (defined as “unsheltered”).PiT counts are an undercount and represent only those individuals identified during the 24-hour period. The numberof people who are actually experiencing homelessness is greater than what is presented in this report. Despite this,the PiT count is an accepted methodological tool for collecting data on homelessness at a single Point-in-Time. Whencommunities conduct counts at the same time of year using a common approach, the results can be used to build a betterunderstanding of homelessness in B.C.1.3 Limitations and MethodologicalConsiderationsThe following section outlines some of the challenges of accuratelyestimating homelessness as highlighted in the 2017 Homeless Countin Metro Vancouver.9 Please also see Section 4 for a more detailed1. Visible Homelessness2. Hidden Homelessnessmethodological overview.PiT counts provide a 24-hour snapshot of homelessness, which is notthe same as estimating the number of people who move in and out of3. At Risk ofHomelessnesshomelessness over time. Individual circumstances can change and over thecourse of a year, some people will become homeless for the first time, somewill find permanent housing, and others will find temporary housing andcycle in and out of homelessness.1. The PiT count methodology is most effective at counting onesegment of the homeless population that is sometimes referredto as the “visible” homeless. This population is shown above theFigure 1: Levels of Homelessneesswaterline in Figure 1. Using the metaphor of an iceberg, the visible homeless represent just the tip of the iceberg— and are the focus of this report.2. The “hidden” homeless includes people who do not have a regular address of their own where they have securityof tenure. The hidden homeless, for the purpose of the count, includes people who are staying temporarily withfriends— often called “couch surfing.” They may also be living in forests or parks, vehicles, or in abandonedbuildings, which makes it difficult for survey volunteers to find them. In developing and implementing countsin each of the 12 B.C. funded communities, HSABC worked with local agencies and service providers to ensureat least one event was held in each community that provided food or other services to community members.The goal of these magnet events was to draw people to services where they could complete the survey and beincluded in this report. While this approach likely resulted in some additional surveys being completed, it is likelystill a small proportion of the total hidden homeless population. Furthermore, even if individuals who typicallymay not access services attended these events, they may have declined to be surveyed for various reasons andtherefore are not included in the count.3. Low vacancy rates and incomes not keeping pace with rising housing costs have resulted in a significant increasein the number of people at risk of losing their housing. Based on 2016 census data, 260,220 B.C. households wereexperiencing some form of housing need.10 These households are not included in this ns/2017MetroVancouverHomelessCount.pdf10 A household may be experiencing a housing need if its housing falls below at least one of the adequacy, affordability or suitability standards12 2018 Report on Homeless Counts in B.C.
2 Summary of Provincial FindingsThis section of the report provides aggregate data from 24 counts in communitiesacross the province to create a provincial profile of individuals identified asexperiencing homelessness. These profiles are based on the provincially fundedcounts in the 12 B.C. count communities,11 the federally funded HomelessnessPartnering Strategy (HPS) counts, independent counts on Salt Spring Island and inTerrace, the 2017 counts in Metro Vancouver, the Fraser Valley, Vernon and Duncan,and shelter data from other B.C. communities collected by BC Housing.12In reviewing this section of the report, it is important to note that:››››2.1Percentages are based on the number of people who responded to survey questions and not the total number ofpeople identified as experiencing homelessness in the community.Some tables show large numbers of “Don’t Know/No Answer”. This is because surveys in the non-B.C. funded countsmay not have asked the question or did not provide the data in a way that could be integrated with the aggregatedtables. To the greatest extent possible, data from these communities were adjusted to align with the methodologicalparameters of the 12 B.C. count communities to enable direct comparisons, but in certain cases this was limited ornot possible.Sheltered and UnshelteredA total of 7,655 individuals were identified as experiencing homelessness. This included 219 children who were under theage of 19 and accompanied by a parent or guardian.13 The majority of individuals identified as experiencing homelessnesswere sheltered (63%) and 37% reported being unsheltered. 14Among the survey respondents who were unsheltered on the night of the count, 37% reported sleeping outside and30% reported couch surfing or staying with friends. Sixty percent (60%) of accompanied children who were shelteredwere staying at a transition house and 19% were staying at a shelter. Thirty-five accompanied children were identified asunsheltered.15and it would have to spend 30% or more of its total before-tax income to pay shelter costs (rent and associated utility costs). 6/dp-pd/chn-biml/index-eng.cfm11Individual community profiles have been created and are available separately.12 This includes data obtained for the night of March 20, 2018 from BC Housing funded shelters, transition houses for women and their childrenat risk of violence, and safe homes located in communities that were not involved in a homeless count.13The age of 1,616 respondents is not known.14Unsheltered respondents include individuals sleeping outside, in a tent or makeshift structure, in a vehicle, or couch surfing.15Most of these children were couch surfing or sleeping in a vehicle with a parent or guardian.2018 Report on Homeless Counts in B.C.13
Table 2.1: Sheltered and Unsheltered by Age and Shelter Type - All CommunitiesAdults andUnaccompaniedYouth16Sheltered andUnsheltered by AgeAccompaniedChildrenUnknown AgeTotal rs2,64745%4219%60938%3,29843% Transition 654%5287%2614%73%15610%4246%Unsheltered Total2,09636%3516%73746%2,86837%Total IndividualsExperiencing tered TotalDetox Centres No Fixed Address (NFA)17Other1918Table 2.2: Sheltered and Unsheltered - All CommunitiesSheltered and otal7,655100%2.2GenderAmong survey respondents, 68% identified as male and 30% as female.20 Two percent (2%) of respondents identifiedanother gender identity.A similar proportion of sheltered and unsheltered respondents identified as female (31% and 29%).Table 2.3: Gender - All CommunitiesGender IdentityShelteredUnshelteredUnspecified 68%Woman/Female76131%61629%27633%1,65330%Another Gender 0%849100%5,423100%Don't Know / No 6Unaccompanied youth refers to anyone under the age of 25 who was not physically accompanied by a parent during the count.17Includes individuals who may be staying in jails, hospitals, and/or short-term medical facilities.18This is typically a parent in hospital with a newborn or young infant.19Other includes Extreme Weather Response Shelters (EWR) or another unspecified shelter type.20 During the homeless count, survey respondents in the 12 B.C. count communities self-identified their gender identity. However, in somecases in HPS communities, shelter data was used to identify gender. Shelter data was also used to obtain gender for the communities thatwere not involved in a count i.e. data obtained by BC Housing.21“Unspecified” refers to survey respondents from communities where respondents were not broken out by sheltered or unsheltered.22Percentage total does not equal 100% due to rounding.14 2018 Report on Homeless Counts in B.C.
2.3AgeThe majority of survey respondents (65%) were adults (25-54 years of age), while 20% were seniors (55 years of age), and15% were unaccompanied youth (under 25 years of age).23The proportion of seniors was greater among sheltered respondents than unsheltered respondents (23% vs. 16%), whilethe proportion of adults was greater among the unsheltered respondents than the sheltered respondents (71% vs. 61%).Youth represented similar proportions among both sheltered and unsheltered respondents (15% and 13%).Table 2.4: Age - All CommunitiesAge Youth (Under 25 Years)33915%27913%14017%75815%Adult (25-54 Years)1,34161%1,49271%51763%3,35065%Senior (55 16100%825100%5,131100%Don't Know / No Indigenous IdentityA total of 1,904 survey respondents identified as Indigenous, representing 38% of all respondents.24The proportion of respondents identifying as Indigenous was higher for unsheltered (42%) than sheltered respondents(32%).Table 2.5: Indigenous Identity - All CommunitiesIndigenous #%Indigenous Identity70832%87442%32241%1,90438%Not Indigenous ,194100%2,070100%781100%5,045100%Don't Know / No Answer2,0853012242,610Total4,2792,3711,0057,65523 During the homeless count, survey respondents in the 12 B.C. Count Communities self-identified their age. There was only one HPS fundedcount where shelter data was used (as it was the only data available). For all other counts, only survey data was used.24 During the count, survey respondents in the 12 B.C. count communities self-identified their Indigenous identity. However, in some cases inHPS communities shelter data was used to identify indigenous identity.2018 Report on Homeless Counts in B.C. 15
2.5Newcomers to CanadaFour percent (4%) of respondents reported coming to Canada as an immigrant or refugee.25 Among survey respondentswho identified as an immigrant or refugee and reported on their length of time in Canada, 83% reported being in Canadafor ten years or more.26Table 2.6: Newcomers to Canada - All CommunitiesNewcomers to Immigrant or Refugee364%373%74%804%Non-Immigrant/ 00%1,095100%199100%2,114100%Don't Know / No .6Sexual OrientationEight percent (8%) of respondents identified as LGBTQ2S. The proportion of respondents who identified as LGBTQ2Swas the same for both sheltered and unsheltered respondents (8%). The majority of respondents identified as straight orheterosexual (90%).Table 2.7: Sexual Orientation - All CommunitiesSexual 16790%LGBTQ2S1678%1678%498%3838%Other (Not Listed / 00%2,003100%590100%4,624100%Don't Know / No Who Was with Survey RespondentsSurvey participants were asked if they were with anyone on the day of the count and could include as many responses asapplied.Most respondents (74%) reported being alone, while 9
› Health care personnel from Vancouver Coastal Health, . Survey respondents were likely to be long term community residents - 31% of respondents had lived in the community . Sechelt Sunshine Coast Mental Health and Addictions Services (VCH) Sechelt Sunshine Coast Youth Outreach (SCCSS) Sechelt Yew Transition House (SCCSS) .