Transcription
remote sensingArticleRemote-Sensing Monitoring of GrasslandDegradation Based on the GDI in Shangri-La, ChinaYanlin Yang 1,2,3 , Jinliang Wang 1,2,3, *, Yun Chen 1,2,3 , Feng Cheng 1,2,3 , Guangjie Liu 1,2,3Zenghong He 1,2,3123*andCollege of Tourism and Geographic Sciences, Yunnan Normal University, Kunming 650500, China;yanlin yang88@163.com (Y.Y.); cqchenyun@126.com (Y.C.); chengfeng rs@163.com (F.C.);guangjiers@gmail.com (G.L.); moyuduye123@163.com (Z.H.)Key Laboratory of Resources and Environmental Remote Sensing for Universities in Yunnan,Kunming 650500, ChinaRemote Sensing Research Laboratory, Center for Geospatial Information Engineering and Technology ofYunnan Province, Kunming 650500, ChinaCorrespondence: jlwang@ynnu.edu.cn; Tel.: 86-871-6594-1202Received: 23 October 2019; Accepted: 13 December 2019; Published: 16 December 2019 Abstract: Grassland resources are important land resources. However, grassland degradation hasbecome evident in recent years, which has reduced the function of soil and water conservationand restricted the development of animal husbandry. Timely and accurate monitoring of grasslandchanges and understanding the degree of degradation are the foundation for the scientific useof grasslands. The grassland degradation index of ground comprehensive evaluation (grasslanddegradation index, GDIg ) is a digital expression of grassland growth that can accurately indicate thedegradation of grasslands. In this research, the accuracy of GDIg in evaluating grassland degradation isdiscussed; the typical areas of grassland degradation in Shangri-La City, i.e., the towns of Jiantang andXiaozhongdian, are selected as the research area. Through a field survey and spectroscopy combinedwith Huanjing-1 (HJ-1) satellite image data, grassland degradation was monitored in the study areafrom 2008 to 2017. The results show that: (1) GDIg based on six indicators, namely, above-groundbiomass, cover level, height, biomass of edible herbage, biomass of toxic weeds, and species richness,can effectively indicate grassland degradation, with the accuracy of the degradation grade assessmentreaching 98.6%. (2) The correlation between the GDIg and the grey values of 4 wavebands and 7 typesof vegetation indexes derived from the HJ-1 is analysed, and the degraded grassland inversion modelwas built and revised based on HJ-1 data. The grassland degradation evaluation index of remotesensing (GDIrs ) model indicates that grassland degradation is proportional to the ratio vegetationindex (RVI). (3) The grassland area was 405.40 km2 in the initial monitoring period, accountingfor 17.26% of the study area, while at the end of the monitoring period, the area was 338.87 km2 ,with a loss of 66.53 km2 . From 2008 to 2017, the area of non-degraded and slightly degradedgrassland in the study area presented a downward trend, with decreases of 59.87 km2 and 49.93 km2 ,respectively. In contrast, the area of moderately degraded grassland increased by 41.17 km2 from91.58 km2 in 2008 to 132.74 km2 in 2017, accounting for 39.17% of the grassland. The area of severelydegraded grassland was 78.32 km2 , accounting for 23.11% of the grassland in 2017. (4) The degradedgrasslands in the study area mainly transformed into the degradation-enhanced (deterioration) type.As the transformation rate gradually slows down, the current situation of grassland degradation isnot hopeful.Keywords: grassland degradation; GDI; remote sensing monitoring; Shangri-LaRemote Sens. 2019, 11, 3030; ensing
Remote Sens. 2019, 11, 30302 of 181. IntroductionSince grasslands have the ecological functions of preventing impacts from wind, fixing sand,maintaining water and soil, conserving water, purifying air and maintaining biodiversity, they areone of the most important types of terrestrial ecosystems on Earth. Moreover, as the basis for animalhusbandry and the production of products such as beef, mutton and dairy products, grasslands havean important economic value [1,2]. Grassland degradation is the deterioration of grassland ecologicalenvironment caused by the influence of unfavourable natural factors such as drought, wind andsand erosion, salinity, waterlogging, groundwater level change, or irrational artificial use such asovergrazing, over-excavation, indiscriminate mowing. These negative impacts are represented interms of low yield of above-ground grassland biomass, declining quality, reduced grassland utilization,and even loss of value in use grassland. The values of such indicators as above-ground biomass,average height, coverage and edible herb biomass of degraded grassland show a significant declinecompared with that of non-degraded grassland. These indicators are important to judge whether thedegeneration of grassland happens or not. In China, there are 400 million hectares of natural grassland,accounting for 41.7% of the land area. However, 90% of the natural grassland is degrading to variousdegrees [3,4]. Faced with the increasingly severe situation of grassland degradation, timely, accurateacquisition of grassland growth conditions over large areas is particularly vital for the treatment andutilization of degraded grasslands. Remote-sensing technology has been widely applied in grasslanddegradation monitoring because of its high efficiency, accuracy and wide monitoring range [5].At present, the remote-sensing methods commonly used in the identification, evaluation andmonitoring of degraded grasslands include artificial interpretation imaging methods, remote-sensingimage classification methods, and remote-sensing vegetation index methods, each with its ownadvantages and disadvantages. Among them, the remote-sensing vegetation index method canenhance the difference in the spectral spectrum through waveband combination and algebraicoperations and more accurately analyse the differences between different land objects. Characterisedby simple operation, high efficiency, and good applicability, this method has been widely used invegetation classification and degraded grassland monitoring [6].In the 1980s, Justice [7], Li [8], Huang [9], and others used remote-sensing vegetation index methodsto carry out research on grassland degradation with National Oceanic and Atmospheric AdministrationAdvanced Very High Resolution Radiometer (NOAA/AVHRR), Landsat MSS (Multispectral Scanner)and other remote-sensing images, initiating the practice of applying remote-sensing vegetation indexmethods to the monitoring of degraded grasslands. Subsequently, Gao [10], Cao [11], Lukasf [12],etc. used the normalized difference vegetation index (NDVI) derived from satellite data fromNOAA, SPOT (Système Probatoire d’Observation de la Terre), MODIS (Moderate-resolution ImagingSpectroradiometer), and so forth to estimate the grassland cover level. Using the grassland cover levelas an evaluation index for grassland degradation, monitoring research on degraded grasslands in theQinghai–Tibet Plateau area was carried out and good results were obtained. At the same time, somescholars added indicators such as grassland biomass and height on the basis of grassland coverage toconduct remote-sensing monitoring research on grassland degradation. For example, Zha [13] usedgrassland coverage and edible herb amount as degraded grassland indicators, combined with thesoil adjusted vegetation index (SAVI) derived from Thematic Mapper (TM) image data, to carry outremote-sensing monitoring on grassland degradation in the Qinghai Lake area and beyond.In all the aforementioned studies, degraded grassland evaluations were conducted based ona singular indicator, which is not adequate for the quantitative evaluation of degraded grasslands.For this reason, Li [14] introduced the grassland degradation index (GDI) into the monitoring ofdegradation using remote sensing. In her monitoring of grassland degradation based on remotesensing in the Tibetan region, she conducted a grassland degradation evaluation with GDI at theground scale by weighting and summing the three indicators of grassland coverage, above-groundbiomass and height. The remote-sensing inversion model of grassland degradation was establishedusing NDVI derived from the TM image data and GDI of ground measurement, thus carrying out
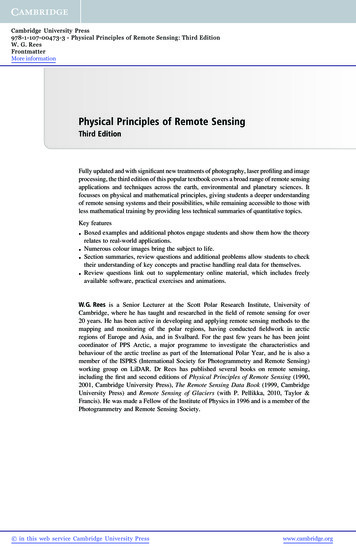
Remote Sens. 2019, 11, 30303 of 18remote-sensing monitoring more effectively. This method further improves the previous methodsof remote-sensing monitoring of degraded grasslands in which a singular evaluation index of grasscoverage or biomass was used. Moreover, it is more objective and more widely accepted to invertgrassland degradation. To date, Du [15], Xu [16] and other scholars have used GDI combined withremote-sensing (RS), geographic information systems (GIS) and global positioning systems (GPS)technologies (3S) as the grassland degradation assessment system to carry out independent grasslanddegradation monitoring research in the middle and upper reaches of the Heihe River and in MaduoCounty of the Three-River Source region, highlighting the application of GDI for dynamic monitoringresearch on degraded grassland.Nevertheless, all scholars considered the positive factors of grassland growth in the calculationof the GDI value. In the case of increased grassland biomass related to the height and coverageof poisonous, invasive weeds, the GDI obtained according to these three indicators would not beapplicable [17] and would be incompatible with the evaluation indicators of grassland degradationin the Classification Index of Degradation, Desertification and Salinization of Natural Grassland (GB19377-2003) [18], which is the standard of China. To this end, this paper discusses the calculation ofthe grassland degradation index of ground comprehensive evaluation (GDIg ) based on six degradedgrassland evaluation indicators, i.e., grassland biomass, height, coverage, species abundance, edibleherb biomass, and toxic weed biomass, collects grassland data from typical degradation areas (thetowns of Jiantang and Xiaozhongdian) in Shangri-La. The remote-sensing inversion model of degradedgrassland was constructed based on the collected data and was utilized to explored the degradationevaluation accuracy of the improved GDIg and the applicability of remote-sensing monitoring ondegraded grasslands. This research will provide a more improved method for remote-sensingmonitoring of grassland degradation and offer data support for the treatment of degraded grasslandsand the utilization of grassland resources in Shangri-La.2. Materials and Methods2.1. Study AreaShangri-La is located in the eastern part of the Diqing Tibetan Autonomous Prefecture innorthwestern Yunnan Province, China, and is in the hinterland of the world-famous natural heritagescenic site “Three Parallel Rivers”. In the centre of Shangri-La sit the towns of Jiantang andXiaozhongdian, where the grasslands concentrate, with a longitude of 99 330 E–100 58’E and alatitude of 27 200 N–28 09’N, as shown in Figure 1.The study area covers 2335.6 km2 , with an average elevation of 3450 m. With no summerseason, the grasslands begin to turn green in May, wither at the end of October. The annual averagetemperature is 5.5 C, and the annual average precipitation is 1100 mm. There are snow-cappedmountains, deep valleys and vast grasslands. There are famous scenic spots such as the DukezongAncient City, the Pudacuo National Park, the Songzanlin Monastery, Napa Lake and Yila Grassland.According to the natural conditions and use types of the study area, the grassland is dividedinto three categories: alpine meadow, subalpine (forest) meadow and swamp meadow, among whichsubalpine forest meadow is the most widely distributed and the largest in area. Surveys indicated thatthere are more than 106 grassland plants in the study area, including Leymus chinensis (Trin.) Tzvel,Poa annua L, Cyperus rotundus L, Carex spp., dandelion Taraxacum mongolicum (Hand.-Mazz), Potentillafulgens Wall, Artemisia parviflora, Ligularia vellerea, Primula malacoides Franch, Erigeron breviscapus (Vant.)Hand.-Mazz, Euphorbia esula Linn, Euphorbia jolkinii, etc. [19]. The grassland type in Shangri-La isnatural grassland. The local farmers raise livestock such as yak, horse, and Tibetan pig, most of whichare grazed in free range instead of fixed ones. They hardly mow the grassland and feed the livestockwith oat and highland barley stems in the winter.
RemoteRemote Sens.Sens. 2019,2020, 11,12, 3030x FOR PEER REVIEW44 ofof 1819Figure 1. Location and sampling points of the study area.Figure 1. Location and sampling points of the study area.2.2. Data Sources and PreprocessingThe study area covers 2335.6 km2, with an average elevation of 3450 m. With no summer season,2.2.1.Huanjing 1begin(HJ-1)toSatelliteData in May, wither at the end of October. The annual averagethe grasslandsturn greentemperatureis 5.5 C,andtheobtainedannual fromaverageprecipitationis research1100 mm.Thereare astgrasslands.Therearefamousscenicspotssuchas the camerasDukezong1A and Huanjing 1B satellite (HJ-1A/B). Equipped with two charge coupled device anlinMonastery,NapaLakeandYilaGrassland.the same type, its footprint width is 700 km, and the ground pixel resolution is 30 m. Four wavebandsAccordingthe naturalrangeconditionsand useµm),typesgreenof the(wavelengthstudy area, thegrasslandis dividedare used:blue to(wavelengthof 0.43–0.52rangeof ubalpine(forest)meadowandswampmeadow,amongred (wavelength range of 0.63–0.69 µm), and near-infrared (wavelength range of twidelydistributedandthelargestinarea.SurveysThe study uses a total of 3 scene images. The satellite data on 9 October 2008, 10 October 2013 andindicatedthereare more106 grasslandplantsin theincludingLeymus chinensis13Octoberthat2017,adoptedby thanthis studyare sourcedfromthestudyChinaarea,Centrefor tundusL,Carexspp.,dandelionTaraxacummongolicumData and Application (http://www.cresda.com/CN/), and the original data have gone through basic(Hand.-Mazz), includingPotentilla fulgensWall,Artemisiaradiometricparviflora, Ligulariavellerea,Primula ,calibrationand .[19].Thethe ENVI 5.3 (Exelis Visual Information Solutions Inc., New York, NY, USA) platform.grassland type in Shangri-La is natural grassland. The local farmers raise livestock such as yak,2.2.2.Surveyhorse,Grasslandand Tibetanpig, Datamost of which are grazed in free range instead of fixed ones. They hardlymow the grassland and feed the livestock with oat and highland barley stems in the winter.The field investigation was conducted on 16 to 26 July and 24 September to 1 October in 2017 for atotal of 17 days in the towns of Jiantang and Xiaozhongdian of Shangri-La covering 32 sample plots.2.2. Data Sources and PreprocessingWith 3 quadrats for each plot, a total of 96 quadrats were investigated for data collection, including 49insubalpinemeadow,18Satellitein alpineDatameadow, and 29 in swamp meadow. This study used grasslands of2.2.1.Huanjing1 (HJ-1)consistent growing conditions with an area larger than 0.009 km2 as samples. Each grassland sampledatawere fromobtainedfrom toChina’sresearchand developmentpointRemote-sensingis placed over 100m awayeach otherensure independentan effective andvalid matchbetween pedwithtwochargecoupled(CCD)sample points and the image pixel. With every sample points investigating 3 quadrat, deviceeach quadratcamerasof2thetype,itsfromfootprintwidth isThe700 informationkm, and the forgroundresolutionis 30 m. Fourcovers1mandsameis 5 mapartone another.each pixelquadratabout f0.43–0.52μm),green(wavelengthrangeof 0.52–0.60biomass, coverage, average height, number of species, edible herb biomass and inedible herbbiomassμm),collectedred (wavelengthrangeof standards0.63–0.69 μm),near-infrared(wavelengthrange Resourceof 0.76–0.90μm).wasaccordingto thein theandTechnicalRegulationfor GrasslandSurveyThe study uses a total of 3 scene images. The satellite data on 9 October 2008, 10 October 2013 and 13October 2017, adopted by this study are sourced from the China Centre for Resources Satellite Data
Remote Sens. 2019, 11, 30305 of 18(NY/T 2998-2016) [20], which is a standard issued by the Ministry of Agriculture of the People’sRepublic of China.2.3. Determination of the Grassland Degradation Evaluation System2.3.1. Normalization of Evaluation IndicatorsAmong the grassland samples collected in the research field, the six indicators of abovegroundbiomass, average height, number of species, coverage, edible herb biomass and toxic weed biomassare indexes with different concepts of measurement units. In order to eliminate the impact of thesedifferent measurement units, normalization is required in processing each indicator to ensure that canquantitatively reflect the degradation of grassland. The normalization formula is shown in Equation (1).xi Xi XiminXimax Ximin(1)where: xi is the result of the normalization of i indicator; Xi is the original value of i indicator; Ximin isthe minimum of i indicator; Ximax is the maximum value of i indicator.2.3.2. Weight Calculation of IndicatorsAs the indicators of degraded grassland, such as coverage, average height, aboveground biomassand toxic weed biomass, differ from one another in their capability to indicate the degree of degradation,it is necessary to determine the weight of each indicator before calculating the GDI. Based on studiesby Li [21] and Wu [22], factor analysis can be used to objectively and scientifically obtain the weightsof each indicator. Factor analysis is an analysis method that evaluates abstract factors through specificindicators. This can transform multiple variables into few unrelated comprehensive indicators whichcan better reflect the characteristics and essence of things. Factor analysis can describe each variableof the original data by the sum of the linear function of the least number of common factor and thespecial factor. The variance contribution rate of the common factor can reflect its ability to interpretthe total variance of the original variables. The higher the value becomes, the more important thefactor is. The variance contribution rate of the common factor can be used to calculate the weight ofthe degraded grassland evaluation index. In this study, factor analysis method was carried out on sixindicators to work out their weights in SPSS 22 (IBM SPSS Statistics Inc., New York, NY, USA) software.2.3.3. Ground Comprehensive Evaluation Grassland Degradation Index (GDIg ) Calculationand GradingThe grassland GDIg is a digital representation of the comprehensive evaluation of degradedgrassland and a weighted summation of each degradation indicator. GDIg value changes from 0 (mostdegraded) to 1 (less degraded). The survey found that the degraded grasslands in the study area hadsignificant changes in the six indicators of above-ground biomass, average height, coverage, numberof species, edible herb biomass and toxic weed biomass; therefore, these indicators were selected forgrassland degradation evaluation. Moreover, the degraded grasslands in the research area experiencetoxic weed invasion. When calculating GDIg , it is necessary to reduce the value of the toxic weedbiomass to eliminate the phenomenon of GDIg increasing instead of decreasing in response to toxicweed invasion. The formula for calculating GDIg is shown in Equation (2):GDIg nXvi wi vd wd(2)i 1where GDIg is the grassland ground evaluation index, n is the number of variables, vi is the indexnormalization value, wi is the indicator weight value, vd is the toxic weed biomass normalization value,and wd is the poisonous weed biomass weight value.
Remote Sens. 2019, 11, 30306 of 18According to the GB 19377-2003 standard [18], the degrees of degraded grasslands in the studyarea are divided into four levels: non-degraded, mildly degraded, moderately degraded, and severelydegraded. The calculated GDIg values are arranged from small to large to indicate the degree ofgrassland degradation from strong to weak, which are ordered samples. Ordered sample optimalsegmentation is the statistical method used for ordered samples and it can minimize the internaldifferences of each segment while maximizing external differences after segmentation [21]. It wasused to determine the clustering statistics among the GDIg values of degraded grasslands to carryout the division of each GDIg indicating the degradation grade. The optimal segmentation of GDIg iscompleted on the DPS7.5 (Data Processing System Hangzhou, Zhejiang, China,) software platform.2.4. Construction of Remote-Sensing Models of Degraded GrasslandsThe surface configuration of grasslands, such as biomass, coverage and other vegetationinformation, is closely related to the waveband information and vegetation index of remote-sensingimage data [22,23]. The image waveband or vegetation index with the highest correlation with GDIg ,if known, can be used to construct a GDIg and remote-sensing inversion model for the quantitativestudy of degraded grassland. Hence, this paper studies the correlation between the GDIg and fourHJ-I wavebands and the derived NDVI, renormalized difference vegetation index (RDVI), differencevegetation index (DVI), soil-adjusted vegetation index, (SAVI), perpendicular vegetation index (PVI),enhanced vegetation index, (EVI) and ratio vegetation index (RVI). The vegetation index calculationmethod is consistent with that of Yu [24], who found the remote-sensing data with the highestcorrelation for constructing the degraded grassland inversion model. The common vegetation indexwas extracted with HJ-1A/B satellite as the data source, and the correlation analysis with GDI wascarried out to screen the most relevant remote-sensing vegetation index to construct the monitoringregression model.Based on the GDIg value of the degraded grassland generated by the field survey in 2017,combined with the environment satellite-derived vegetation index RVI, the degraded grassland canbe studied with high precision and quantification. Due to the inconsistent radiation conditionsof environmental satellite images in different years, the radiation information detected cannot beevaluated by the same standard. To explore the degraded grassland in the study area in 2008 and 2013,it is necessary to perform radiation correction on the environmental image RVI of each year so thatgrassland degradation can be monitored by the same standard [15,25] RVI radiation registration isgenerally performed by establishing a radiation registration model for the ground objects that have notchanged during the study period. The reason for this is that the radiation values obtained with thesame type of sensor for the same ground object at different times should be equal or roughly equal.The RVI2017 value derived from the environmental satellite data in 2017 was adopted as thestandard with which to register the RVI2008 and RVI2013 values in the study area. In the images of threephases in 2008, 2013 and 2017, 480 points were discovered where no changes in ground objects occurred.After extracting the RVI2008 , RVI2013 , and RVI2017 values of these 480 points for a related analysis,a linear regression model for radiation correction is built to obtain the RVI radiation correction models.2.5. Land-Use Classification Method in Research AreaIn order to study the change of grassland distribution in Shangri-La in nearly 10 years from2008 to 2017, the support vector machine (SVM) algorithm in the supervised classification is adopted,which has the characteristics of fast and high precision in the classification of features. According tothe “Classification of Land Use Status” (GB/T 21010-2017) standard, the land use in the study area areclassified into six first-grade types: farmland, forest, grassland, building land, water body, and iceand snow land. In the sample selection, since the separability of the ice and snow land and the bareland in the study area is less than 1, these two are combined into one type of ground object. With theENVI5.3 platform referring to the historical images of Google Map in September 2017, the selection oflocal samples on environmental satellite images is carried out to ensure that the number of sample
Remote Sens. 2019, 11, 30307 of 18selections of each type is more than 400, and that the separability of each sample is larger than 1.9.In the meantime, with the 16-m resolution image of the GaoFeng 1 satellite of Jiantang Town in July2017, after the geometric registration with the image of environmental satellite in 2017, 1000 points aregenerated randomly in the study area by using the random generation point function in the ArcGISMap. The ground object type of the raster cell where each point is located is determined by manualvisual interpretation as auxiliary data for verifying the accuracy of the classification result under theENVI Post-Classification function.2.6. Accuracy Test2.6.1. GDIg Evaluation Accuracy TestThe study selects the sample data collected from the south bank of Bitahai Nature Reserve as theindicator standard for non-degraded grassland. Based on the (GB 1977-2003) standard, 96 samplescollected are classified by non-degraded grassland, slightly degraded grassland, moderately degradedgrassland, and severely degraded grassland. The accuracy of degradation classification by GDI istested by contrasting with the classification results based on GB (19377-2003) standard.2.6.2. Fitting Model Accuracy TestOver-fitting will occur in the process of establishing a grassland degradation monitoring modelby linear fitting, and there will be some error in the inversion between the vegetation index and theground-based degradation index. In order to test whether the model is applicable to the grasslanddegradation evaluation in the study area, it is necessary to carry out an accuracy test. The 30 verificationgroup sample data collected at the same period were substituted into the fitted model to obtain thesimulated GDI of the verification group, and then the relative error and root mean square error (RMSE)of the measured GDI values were calculated. The smaller the relative error is, the closer the result is tothe real value. Relative error and RMSE calculation formulas are Formulas (3) and (4) respectively.C (GDI g GDIrs )/GDIg 100%RMSE rXni 1(GDI g GDIrs )2 /n(3)(4)where C is the relative error, RMSE is the root mean square error, and n is the number of samples, GDIgis the ground observed value, and GDIrs is the remote-sensing fitting value.3. Results3.1. GDIg Calculation ResultsThe study carries out factor analysis on actual grassland measurement data within the SPSS 22software to extract the variance of each indicator component. The cumulative variance contribution rateof the first two components reached 83.79%. With the rate of more than 80%, the grassland degradationinformation can use the first two principal components to replaces the original six evaluation indicators.Equations (5) and (6) show the linear combination equations of each index constructed according tothe number of payloads and the eigenvalues of each indicator.F1 0.344x1 0.509x2 0.499x3 0.187x4 0.573x5 0.104x6(5)F2 0.011x1 0.196x2 0.363x3 0.620x4 0.170x5 0.645x6(6)The variance contribution rates of these two principal components are taken as the weights of thegrassland degradation indicators. Then the coefficients of the six indicators in the linear combinationof the principal components are respectively weighted and averaged to obtain the comprehensive
Remote Sens. 2019, 11, 30308 of 18coefficient. Finally, the composite coefficients are normalized to obtain weight of indicator. The weightsof the six indicators, including aboveground biomass, average height, coverage, number of species,biomass of edible herbs and biomass of toxic weeds, are 0.27, 0.12, 0.12, 0.14, 0.11 and 0.24, respectively.By using Equation (2), the GDIg values of 96 grassland quadrats were obtained to be between0.165 and 0.782. In the DPS7.5 software, 96 sample data were segmented in an orderly manner.The four-segment segmentation results were used to represent the four levels of grassland degradation,and the GDIg value corresponding to the dividing nodes is used as the threshold of each degradationlevel, as shown in Table 1. The optimal classification result is the range of the partition interval, which isrepresented by ordinal classification in the ordered samples. Since the number of classifications is4, samples numbered from 1–29 are grouped as one range, and samples 30–70, 71–91 and 92–96 aregrouped as the other three ranges.Table 1. GDIg grading indicators for grassland degradation.Degradation LevelOptimal Segmentation ResultGDIg Dividing NodeNon-degradedSlight degradationModerate degradationSevere degradation92 9671 9130 701 29GDIg 0.51620.3757 GDIg 0.51620.2560 GDIg 0.3757GDIg 0.2560Note: The correspond GDIg value of each interval is the demarcation standard of each degradation level, GDIg isthe grassland degradation index of ground comprehensive evaluation.The non-degraded grassland is determined according to the GB 19377-2003 standard.The benchmark vegetation characteristics are based on the surface and soil conditions of the grasslandsof the same use type in the demonstration zone near the monitoring site in natural grassland reserveswith the same hydrothermal conditions. In line with the GB 19377-2003 standard, the 96 samplescollected were evaluated for de
remote-sensing monitoring on grassland degradation in the Qinghai Lake area and beyond. In all the aforementioned studies, degraded grassland evaluations were conducted based on . latitude of 27 200N-28 09'N, as shown in Figure1. The study area covers 2335.6 km2, with an average elevation of 3450 m. With no summer