Transcription
Oracle Crystal BallOracle Crystal Ball Decision OptimizerOracle Crystal Ball Enterprise Performance ManagementOracle Crystal Ball Classroom Student EditionOracle Crystal Ball Classroom Faculty EditionOracle Crystal Ball Enterprise Performance Management for Oracle HyperionEnterprise Planning SuiteOracle Crystal Ball SuitePredictor User's GuideRelease 11.1.2.2
Crystal Ball Predictor User's Guide, 11.1.2.2Copyright 1988, 2012, Oracle and/or its affiliates. All rights reserved.Authors: EPM Information Development TeamOracle and Java are registered trademarks of Oracle and/or its affiliates. Other names may be trademarks of their respectiveowners.This software and related documentation are provided under a license agreement containing restrictions on use anddisclosure and are protected by intellectual property laws. Except as expressly permitted in your license agreement orallowed by law, you may not use, copy, reproduce, translate, broadcast, modify, license, transmit, distribute, exhibit,perform, publish, or display any part, in any form, or by any means. Reverse engineering, disassembly, or decompilationof this software, unless required by law for interoperability, is prohibited.The information contained herein is subject to change without notice and is not warranted to be error-free. If you findany errors, please report them to us in writing.If this is software or related documentation that is delivered to the U.S. Government or anyone licensing it on behalf ofthe U.S. Government, the following notice is applicable:U.S. GOVERNMENT RIGHTS:Programs, software, databases, and related documentation and technical data delivered to U.S. Government customersare "commercial computer software" or "commercial technical data" pursuant to the applicable Federal AcquisitionRegulation and agency-specific supplemental regulations. As such, the use, duplication, disclosure, modification, andadaptation shall be subject to the restrictions and license terms set forth in the applicable Government contract, and, tothe extent applicable by the terms of the Government contract, the additional rights set forth in FAR 52.227-19, CommercialComputer Software License (December 2007). Oracle America, Inc., 500 Oracle Parkway, Redwood City, CA 94065.This software or hardware is developed for general use in a variety of information management applications. It is notdeveloped or intended for use in any inherently dangerous applications, including applications that may create a risk ofpersonal injury. If you use this software or hardware in dangerous applications, then you shall be responsible to take allappropriate fail-safe, backup, redundancy, and other measures to ensure its safe use. Oracle Corporation and its affiliatesdisclaim any liability for any damages caused by use of this software or hardware in dangerous applications.This software or hardware and documentation may provide access to or information on content, products, and servicesfrom third parties. Oracle Corporation and its affiliates are not responsible for and expressly disclaim all warranties of anykind with respect to third-party content, products, and services. Oracle Corporation and its affiliates will not be responsiblefor any loss, costs, or damages incurred due to your access to or use of third-party content, products, or services.
ContentsDocumentation Accessibility . . . . . . . . . . . . . . . . . . . . . . . . . . . . . . . . . . . . . . . . . . . . . . . . . . . . . . . . . . . 5Chapter 1. Welcome . . . . . . . . . . . . . . . . . . . . . . . . . . . . . . . . . . . . . . . . . . . . . . . . . . . . . . . . . . . . . . . . . 7About Predictor . . . . . . . . . . . . . . . . . . . . . . . . . . . . . . . . . . . . . . . . . . . . . . . . . . . . . . . 7How This Guide Is Organized . . . . . . . . . . . . . . . . . . . . . . . . . . . . . . . . . . . . . . . . . . . . . 8Screen Capture Notes . . . . . . . . . . . . . . . . . . . . . . . . . . . . . . . . . . . . . . . . . . . . . . . . 8Example Files . . . . . . . . . . . . . . . . . . . . . . . . . . . . . . . . . . . . . . . . . . . . . . . . . . . . . . 8Online Help . . . . . . . . . . . . . . . . . . . . . . . . . . . . . . . . . . . . . . . . . . . . . . . . . . . . . . . . . . 8Developer Kit . . . . . . . . . . . . . . . . . . . . . . . . . . . . . . . . . . . . . . . . . . . . . . . . . . . . . . . . . 9Accessibility Notes . . . . . . . . . . . . . . . . . . . . . . . . . . . . . . . . . . . . . . . . . . . . . . . . . . . . . 9Additional Resources . . . . . . . . . . . . . . . . . . . . . . . . . . . . . . . . . . . . . . . . . . . . . . . . . . . 9Chapter 2. Getting Started with Predictor . . . . . . . . . . . . . . . . . . . . . . . . . . . . . . . . . . . . . . . . . . . . . . . . . 11Forecasting Basics . . . . . . . . . . . . . . . . . . . . . . . . . . . . . . . . . . . . . . . . . . . . . . . . . . . . . 11Creating Spreadsheets with Historical Data . . . . . . . . . . . . . . . . . . . . . . . . . . . . . . . . . . . 12Starting Predictor and Running a Forecast . . . . . . . . . . . . . . . . . . . . . . . . . . . . . . . . . . . 13Analyzing Results at a Basic Level . . . . . . . . . . . . . . . . . . . . . . . . . . . . . . . . . . . . . . . . . . 14Learning More . . . . . . . . . . . . . . . . . . . . . . . . . . . . . . . . . . . . . . . . . . . . . . . . . . . . . . . 14Chapter 3. Setting Up Predictor Forecasts . . . . . . . . . . . . . . . . . . . . . . . . . . . . . . . . . . . . . . . . . . . . . . . . . 15Guidelines for Setting Up a Forecast . . . . . . . . . . . . . . . . . . . . . . . . . . . . . . . . . . . . . . . . 15Selecting the Location and Arrangement of Historical Data . . . . . . . . . . . . . . . . . . . . . . . 17Selecting Discontiguous Data . . . . . . . . . . . . . . . . . . . . . . . . . . . . . . . . . . . . . . . . . . 18Selecting Data Attributes—Seasonality, Events, Screening . . . . . . . . . . . . . . . . . . . . . . . . 19Viewing Historical Data by Seasonality . . . . . . . . . . . . . . . . . . . . . . . . . . . . . . . . . . . 20Viewing and Managing Events . . . . . . . . . . . . . . . . . . . . . . . . . . . . . . . . . . . . . . . . . 24Viewing Screened Data . . . . . . . . . . . . . . . . . . . . . . . . . . . . . . . . . . . . . . . . . . . . . . 28Setting Screening Options . . . . . . . . . . . . . . . . . . . . . . . . . . . . . . . . . . . . . . . . . . . . 28Selecting a Forecasting Method . . . . . . . . . . . . . . . . . . . . . . . . . . . . . . . . . . . . . . . . . . . 29Using Classic Time-series Forecasting Methods . . . . . . . . . . . . . . . . . . . . . . . . . . . . . 30Using ARIMA Time-series Forecasting Methods . . . . . . . . . . . . . . . . . . . . . . . . . . . . 33Using Multiple Linear Regression . . . . . . . . . . . . . . . . . . . . . . . . . . . . . . . . . . . . . . . 37Setting Forecast Options . . . . . . . . . . . . . . . . . . . . . . . . . . . . . . . . . . . . . . . . . . . . . . . . 39Contentsiii
Selecting Error Measures . . . . . . . . . . . . . . . . . . . . . . . . . . . . . . . . . . . . . . . . . . . . . 39Selecting Forecasting Techniques . . . . . . . . . . . . . . . . . . . . . . . . . . . . . . . . . . . . . . . 40Chapter 4. Analyzing Predictor Results . . . . . . . . . . . . . . . . . . . . . . . . . . . . . . . . . . . . . . . . . . . . . . . . . . . 41Understanding the Predictor Results Window . . . . . . . . . . . . . . . . . . . . . . . . . . . . . . . . . 41Entering the Number of Time Periods to Forecast . . . . . . . . . . . . . . . . . . . . . . . . . . . 43Selecting a Confidence Interval . . . . . . . . . . . . . . . . . . . . . . . . . . . . . . . . . . . . . . . . 43Selecting How to Display and Analyze Results . . . . . . . . . . . . . . . . . . . . . . . . . . . . . . . . . 44Adjusting Forecasted Data . . . . . . . . . . . . . . . . . . . . . . . . . . . . . . . . . . . . . . . . . . . . . . . 44Custom Rounding . . . . . . . . . . . . . . . . . . . . . . . . . . . . . . . . . . . . . . . . . . . . . . . . . 45Pasting Predictor Forecasts . . . . . . . . . . . . . . . . . . . . . . . . . . . . . . . . . . . . . . . . . . . . . . 46Time-series Forecast Method Results . . . . . . . . . . . . . . . . . . . . . . . . . . . . . . . . . . . . 47Multiple Linear Regression Results . . . . . . . . . . . . . . . . . . . . . . . . . . . . . . . . . . . . . . 47Viewing Charts . . . . . . . . . . . . . . . . . . . . . . . . . . . . . . . . . . . . . . . . . . . . . . . . . . . . . . . 47Customizing Charts . . . . . . . . . . . . . . . . . . . . . . . . . . . . . . . . . . . . . . . . . . . . . . . . 48Copying and Printing Charts . . . . . . . . . . . . . . . . . . . . . . . . . . . . . . . . . . . . . . . . . . 49Creating Reports . . . . . . . . . . . . . . . . . . . . . . . . . . . . . . . . . . . . . . . . . . . . . . . . . . . . . . 49Extracting Results Data . . . . . . . . . . . . . . . . . . . . . . . . . . . . . . . . . . . . . . . . . . . . . . . . . 50Analyzing and Using Extracted Results . . . . . . . . . . . . . . . . . . . . . . . . . . . . . . . . . . . 51Appendix A. Predictor Tutorials . . . . . . . . . . . . . . . . . . . . . . . . . . . . . . . . . . . . . . . . . . . . . . . . . . . . . . . . 53About Predictor Tutorials . . . . . . . . . . . . . . . . . . . . . . . . . . . . . . . . . . . . . . . . . . . . . . . 53Tutorial 1—Shampoo Sales . . . . . . . . . . . . . . . . . . . . . . . . . . . . . . . . . . . . . . . . . . . . . . 53Tutorial 2—Toledo Gas . . . . . . . . . . . . . . . . . . . . . . . . . . . . . . . . . . . . . . . . . . . . . . . . . 57Viewing and Analyzing Predictor Results . . . . . . . . . . . . . . . . . . . . . . . . . . . . . . . . . 59Pasting Results into the Spreadsheet . . . . . . . . . . . . . . . . . . . . . . . . . . . . . . . . . . . . . 62Creating a Report of Predictor Results . . . . . . . . . . . . . . . . . . . . . . . . . . . . . . . . . . . 64Extracting Results . . . . . . . . . . . . . . . . . . . . . . . . . . . . . . . . . . . . . . . . . . . . . . . . . . 65Glossary . . . . . . . . . . . . . . . . . . . . . . . . . . . . . . . . . . . . . . . . . . . . . . . . . . . . . . . . . . . . . . . . . . . . . . . . 71Index . . . . . . . . . . . . . . . . . . . . . . . . . . . . . . . . . . . . . . . . . . . . . . . . . . . . . . . . . . . . . . . . . . . . . . . . . . 75ivContents
Documentation AccessibilityFor information about Oracle's commitment to accessibility, visit the Oracle Accessibility Program website athttp://www.oracle.com/pls/topic/lookup?ctx acc&id docacc.Access to Oracle SupportOracle customers have access to electronic support through My Oracle Support. For information, visit http://www.oracle.com/pls/topic/lookup?ctx acc&id info or visit http://www.oracle.com/pls/topic/lookup?ctx acc&id trs if you are hearing impaired.5
6Documentation Accessibility
Welcome1In This ChapterAbout Predictor. 7How This Guide Is Organized. 8Online Help . 8Developer Kit . 9Accessibility Notes . 9Additional Resources . 9About PredictorForecasting is an important part of many business decisions. Every organization must set goals,try to predict future events, and then act to fulfill the goals. As the timeliness of market actionsbecomes more important, the need for accurate planning and forecasting throughout anorganization is essential to get ahead. The difference between good and bad forecasting can affectthe success of an entire organization.Predictor is an easy-to-use, graphically oriented forecasting feature included in:lOracle Crystal Ball, including Student and Faculty EditionslOracle Crystal Ball Decision OptimizerlOracle Crystal Ball Enterprise Performance ManagementIf you have historical data in your spreadsheet model, Predictor analyzes the data for trends andseasonal variations. It then predicts future values based on this information. You can answerquestions such as, “What are the likely sales figures for next quarter?” or, “How much materialdo we need to have on hand?” As an added benefit, you can automatically save Predictor forecastsas Crystal Ball assumptions for immediate use in powerful risk analysis models. See Chapter 2,“Getting Started with Predictor,” for an overview of how Predictor works and what it can do foryou.Predictor runs on several versions of Microsoft Windows and Microsoft Excel. For a list ofrequired hardware and software, see the current Oracle Crystal Ball Installation and LicensingGuide.About Predictor7
How This Guide Is OrganizedThis guide includes the following additional sections to help you use Predictor:lChapter 2, “Getting Started with Predictor”Procedures for starting Predictor and running basic forecasts using default settingslChapter 3, “Setting Up Predictor Forecasts”Procedures for running forecasts with customized settingslChapter 4, “Analyzing Predictor Results”Descriptions of Predictor results and how to analyze themlAppendix A, “Predictor Tutorials”A basic tutorial that quickly introduces Predictor’s features and an advanced tutorial thatuses multiple regression analysislGlossaryDefinitions of terms specific to Predictor as well as statistical terms used in this manualFor additional examples, definitions of statistical terms, and publication references, see thePredictor section of the Oracle Crystal Ball Reference and Examples Guide.Screen Capture NotesThe screen captures in this manual were taken in Microsoft Excel 2003 for Microsoft WindowsXP Professional.Because of round-off differences between various system configurations, you may noticecalculated results that are slightly different from those in the examples.Example FilesExample names are listed in full wherever given.ä To open an example file:1Select Help, then Crystal Ball, and then Examples Guide.2Click its name in the Model Name list. (In Microsoft Excel 2007 or later, select Resources in theHelp group, and then select Examples Guide.)Online HelpYou can display online help for Predictor by pressing F1 or clicking Help in the Predictor wizard.Tip: Click Contents at the top of the Help window for a table of contents.8Welcome
Developer KitIf you are familiar with Visual Basic for Applications (VBA) or other supported developmentsystems, you can use the Predictor developer kit to automate a number of basic forecasting andanalysis operations. For details, see the Oracle Crystal Ball Developer's Guide.Accessibility NotesYou do not need to enable keyboard accessibility specifically for Crystal Ball and its features;command access is always in accessible mode. Crystal Ball, including Predictor, followsMicrosoft Windows conventions for accessing commands using the keyboard. When you pressAlt, shortcut keys are underlined in menus and dialogs. Crystal Ball output can be extracted toMicrosoft Excel spreadsheets and pasted into PowerPoint slides, which are accessible throughMicrosoft Office. Starting with Crystal Ball version 11.1.2.0.00, an optional Accessibility mode,available through the Options tab of the Run Preferences dialog, activates special features forpeople with visual or motor impairments. For example, default chart display includes distinctionby patterns as well as colors. For additional information about Crystal Ball accessibility, see theOracle Crystal Ball User's Guide. For information about Microsoft Excel or PowerPointaccessibility, refer to Microsoft Office product documentation.Additional ResourcesOracle offers technical support, training, and other services to help you use Crystal Ball mosteffectively.For more information, see the Crystal Ball Web site at:http://www.oracle.com/crystalballDeveloper Kit9
10Welcome
2Getting Started with PredictorIn This ChapterForecasting Basics .11Creating Spreadsheets with Historical Data .12Starting Predictor and Running a Forecast .13Analyzing Results at a Basic Level .14Learning More .14Forecasting BasicsMost historical or time-based data contains an underlying trend or seasonal pattern. However,most historical data also contains random fluctuations (“noise”) that make it difficult to detectthese trends and patterns without a computer. Predictor uses sophisticated time-series methodsto analyze the underlying structure of the data. It then projects the trends and patterns to predictfuture values.Predictor uses two types of forecasting:llTime-series forecasting breaks historical data into components: level, trend, seasonality,and error. Predictor analyzes these components and then projects them into the future topredict likely results.Multiple linear regression works best when outside influences have an effect on the variablethat you want to forecast. Regression takes historical data from the influencing variables anddetermines the mathematical relationship between these variables and the target variable.It then uses time-series forecasting methods to forecast the influencing variables andcombines the results mathematically to forecast the target variable.In Predictor, a data series is a set of historical data for a single variable. When you run Predictor,it uses each time-series method on each of the selected data series and calculates a mathematicalmeasure of goodness-of-fit. Predictor selects the method with the best goodness-of-fit as themethod that will yield the most accurate forecast. Predictor performs this selectionautomatically, but you can also select individual methods manually or override the method thatPredictor recommends with a different one.The final forecast shows the most likely continuation of the data. Keep in mind that all thesemethods assume that some aspects of the historical trend or pattern will continue into the future.However, the farther out you forecast, the greater the likelihood that events will diverge frompast behavior, and the less confident you can be of the results. To help you gauge the reliabilityForecasting Basics11
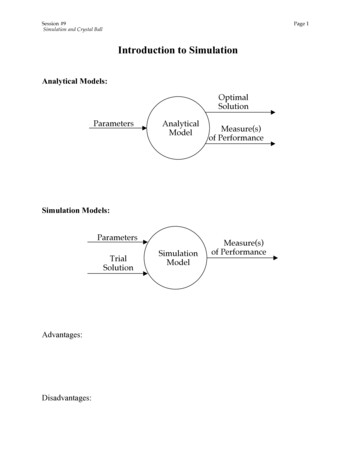
of the forecast, Predictor provides a confidence interval indicating the degree of uncertaintyregarding the forecast.After finding the best forecast for the data, Predictor displays detailed output that can includestatistics, charts, reports, and interactive Microsoft Excel PivotTables. Predictor can also pastethe forecasted values into a spreadsheet and create Crystal Ball assumptions from forecastedvalues so you can perform a “what-if” simulation.The following topics describe how to set up Predictor forecasts using default settings so you cangenerate results quickly for further analysis:l“Creating Spreadsheets with Historical Data” on page 12l“Starting Predictor and Running a Forecast” on page 13l“Analyzing Results at a Basic Level” on page 14l“Learning More” on page 14Predictor basics are demonstrated in “Tutorial 1—Shampoo Sales” on page 53. You may findit helpful to work through this tutorial now, or read through the following sections first andthen try the tutorial. When you are ready to expand your forecasting skills, Chapter 3, “SettingUp Predictor Forecasts,” provides detailed instructions.Creating Spreadsheets with Historical DataBefore using Predictor, create a Microsoft Excel spreadsheet with historical data to analyze. Thespreadsheet should include:lllOptional: A descriptive spreadsheet title.Optional: A date (or other time period, such as Q2-2004) column or row, either at the topor along the left side of the data (in the last column before the data). If you format the datesas Microsoft Excel dates, Predictor can find the dates, extend them with the forecasted values,and use them as chart labels.Historical data, spaced equal time periods apart, in columns or rows adjacent to the datecolumn or row. To produce a reasonable forecast, you should have at least six historical datapoints. Other requirements:mmmm12Single moving average analysis requires that the number of historical data points betwice the number of points to forecast.Double moving average analysis requires that the number of historical data points bethree times the number of points to forecast (or at least six, whichever is higher).To use seasonal methods, you must have at least two seasons (complete cycles) ofhistorical data.For multiple linear regression, the number of historical data points must be greater thanor equal to the number of independent variables (counting the included constant as anindependent variable).Getting Started with Predictor
mmmlTo lag an independent variable in multiple linear regression, lag must be less than thenumber of historical data points. For details on lags, see “Notes about Autocorrelations”on page 23.For multiple linear regression with lags, the number of data points minus any lags andleading blanks must be greater than the number of independent variables, plus 1 if aconstant is included in the regression equation.When values in the date series are not in Microsoft Excel date format, the intervalsbetween the values must all be exactly the same. For example, you can use integers forweeks (1, 2, 3, and so on) but you cannot omit any. The following is not an acceptabledata series: 1, 2, 3, 5, 7. Also consider the valid date series 01-Jan, 01-Feb, 01-Mar. Thisis no longer valid when converted into days expressed as integers: 1, 32, 60.Optional: Headings for each data column or row, such as SKU 23442, Gas Usage, or InterestRate.The Toledo Gas spreadsheet (Figure 1) has all these components.Figure 1Example SpreadsheetStarting Predictor and Running a Forecastä Before you start Predictor:1Open a model with historical data (see “Creating Spreadsheets with Historical Data” on page 12).2Select a cell within the range to analyze.Starting Predictor and Running a Forecast13
ä To start Predictor:1Select Run, and then Predictor.The first time you start Predictor, the Predictor wizard Welcome panel opens. After that,Input Data opens.The Welcome panel introduces Predictor and provides an overview of how it works.2If Welcome opens, click Next to advance to Input Data.3Set up a forecast following the instructions in Chapter 3, “Setting Up Predictor Forecasts.” To set up abasic forecast, see “Guidelines for Setting Up a Forecast” on page 15.4To run a forecast and produce results, click Run.The Predictor Results window opens.Note: You can click Run from any of the wizard panels except Welcome at any time, as long asthe data range has been properly defined on the Input Data panel.To use forecasted results, see “Analyzing Results at a Basic Level” on page 14.Analyzing Results at a Basic LevelPredictor simplifies the forecasting process, but you must understand the results it produces.For a detailed description of all results and how to analyze them, see Chapter 4, “AnalyzingPredictor Results.” At a basic level, you can view results for different series and paste results intothe spreadsheet model:l“Understanding the Predictor Results Window” on page 41l“Entering the Number of Time Periods to Forecast” on page 43l“Selecting How to Display and Analyze Results” on page 44Learning MoreThis chapter introduced Predictor at a basic level and suggested topics with more advancedcontent. If you have not already done so, you may find it helpful to:ll14Work through “Tutorial 1—Shampoo Sales” on page 53Consider reviewing Chapter 3, “Setting Up Predictor Forecasts,” to learn procedures forincreasing the accuracy of Predictor forecasting and analysisGetting Started with Predictor
Setting Up Predictor Forecasts3In This ChapterGuidelines for Setting Up a Forecast.15Selecting the Location and Arrangement of Historical Data .17Selecting Data Attributes—Seasonality, Events, Screening .19Selecting a Forecasting Method .29Setting Forecast Options .39Guidelines for Setting Up a ForecastTip: To preview these steps, work through “Tutorial 1—Shampoo Sales” on page 53.ä Follow these steps to set up a Predictor forecast and generate results:1Create and open a spreadsheet model with historical data as described in “Creating Spreadsheets withHistorical Data” on page 12.2Select a data cell and start Predictor (see “Starting Predictor and Running a Forecast” on page 13).Note: You can select an entire data range or a single cell and let Predictor determine therange. If columns or rows of data are separated by blank columns or rows, you canuse Ctrl click to select one cell in each data series. For details, see “SelectingDiscontiguous Data” on page 18.3Display the Input Data panel of the Predictor wizard.If Welcome opens, click Next to display Input Data.4In Input Data, confirm that:lThe appropriate data range is selected, including any row labels and column headerslColumn Header and Label settings are correctFor details, click Help or see “Selecting the Location and Arrangement of Historical Data”on page 17.5Click Next to display Data Attributes.6In Data Attributes, indicate the time period for the data.Guidelines for Setting Up a Forecast15
For example, if the data points represent monthly numbers, select months.7For Seasonality, select AutoDetect so Predictor will use statistical algorithms to determine whether thedata is seasonal. Findings are displayed in a statement to the right of the list box. To fine-tune seasonalitysettings or use optional events and screening settings, see “Selecting Data Attributes—Seasonality,Events, Screening” on page 19.8Optional: If you are analyzing more than one data series with AutoDetect, click View Seasonality tochart the seasonality for each series.For more information, see “Viewing Historical Data by Seasonality” on page 20.9Click Next to open the Methods panel, and select forecasting methods.10 Depending on the Data Attributes Seasonality setting, select one or more of these:llllNon-seasonal Methods—Work best on data that does not show a pattern that repeatsregularly over a certain number of time periods, but can show a trend of decreasing orincreasing over timeSeasonal Methods—Work best on data that shows a pattern that repeats regularly overa certain number of time periods and can also show a trend of decreasing or increasingover timeARIMA—Useful in a variety of situations, particularly with many historical values andvery few outlier valuesMultiple Linear Regression—Useful when independent variables affect another variableof interestTip: If Non-seasonal Methods and Seasonal Methods are available, select both.If you have selected several series and one of them is controlled by the other, it is a dependentvariable. In that case, select Multiple Linear Regression and see “Using Multiple LinearRegression” on page 37.11 When settings are complete, click Next to review or change forecasting options.12 Select an error measure and a forecasting technique.The Glossary in this document and the Predictor sections of the Oracle Crystal Ball Referenceand Examples Guide describe these settings. For basic forecasting, use the defaults: RMSEand standard forecasting.13 When all Options settings are complete, click Run to run the forecast and produce results. For moreinformation, see “Starting Predictor and Running a Forecast” on page 13.The following topics describe how to customize Predictor settings to more closely reflect thehistorical data and provide more accurate forecast results:16l“Selecting the Location and Arrangement of Historical Data” on page 17l“Selecting Data Attributes—Seasonality, Events, Screening” on page 19l“Selecting a Forecasting Method” on page 29l“Setting Forecast Options” on page 39Setting Up Predictor Forecasts
Selecting the Location and Arrangement of HistoricalDataUse the Input Data panel of the Predictor wizard to select the location and arrangement ofhistorical data to analyze.Tip: After you start Predictor the first time, Input Data opens automatically whenever you startPredictor, or click Input Data in the navigation pane of the Predictor wizard.ä To select the location and arrangement of historical data:1Open a model with historical data, select a data cell in the range to analyze, and start Predictor asdescribed in “Starting Predictor and Running a Forecast” on page 13.Input Data shows a possible data selection in the Location of data series text box and theillustration at the right side of the panel.2Location of data series indicates the cells that contain data to analyze. If the data series have headersor labels at the beginning of the rows or columns of data, include them in the selection and select theappropriate Headers settings. If necessary, select a different data range.Note: If you select one cell before you start the wizard, the data range is selectedautomatically, based on the continuously filled cells around the selected cell. If youselect a range of cells before you start the wizard, that range is selected. If you do notselect a cell, or if you select an empty cell before you start the wizard, you ca
As an added benefit, you can automatically save Predictor forecasts as Crystal Ball assumptions for immediate use in powerful risk analysis models. See Chapter 2, "Getting Started with Predictor," for an overview of how Predictor works and what it can do for you. Predictor runs on several versions of Microsoft Windows and Microsoft Excel.